R E S E A R C H A R T I C L E
Open Access
Regeneration and reprogramming compared
Bea Christen
1†, Vanesa Robles
1,3,4†, Marina Raya
1, Ida Paramonov
1, Juan Carlos Izpisúa Belmonte
1,2*Abstract
Background:Dedifferentiation occurs naturally in mature cell types during epimorphic regeneration in fish and some amphibians. Dedifferentiation also occurs in the induction of pluripotent stem cells when a set of transcription factors (Oct4, Sox2, Klf4andc-Myc) is over expressed in mature cell types.
Results:We hypothesised that there are parallels between dedifferentiation or reprogramming of somatic cells to induced pluripotent stem cells and the natural process of dedifferentiation during epimorphic regeneration. We analysed expression levels of the most commonly used pluripotency associated factors in regenerating and non-regenerating tissue and compared them with levels in a pluripotent reference cell. We found that some of the pluripotency associated factors (oct4/pou5f1, sox2, c-myc, klf4, tert, sall4, zic3, dppa2/4andfut1, a homologue of ssea1) were expressed before and during regeneration and that at least two of these factors (oct4, sox2) were also required for normal fin regeneration in the zebrafish. However these factors were not upregulated during
regeneration as would be expected if blastema cells acquired pluripotency.
Conclusions:By comparing cells from the regeneration blastema with embryonic pluripotent reference cells we found that induced pluripotent stem and blastema cells do not share pluripotency. However, during blastema formation some of the key reprogramming factors are both expressed and are also required for regeneration to take place. We therefore propose a link between partially reprogrammed induced pluripotent stem cells and the half way state of blastema cells and suggest that a common mechanism might be regulating these two processes.
Background
Differentiation during development is normally viewed as a one way process from undifferentiated to more dif-ferentiated cells. However, some lower vertebrates such as teleost fish and some amphibians are able to compen-sate for the loss of body parts by regenerating a nearly perfect copy of the original part by dedifferentiating cellsin vivoto facilitate regeneration.
After the loss of an appendage undifferentiated, pluri-or multipotent cells from different pluri-origins accumulate at the damaged surface to form a regeneration blastema. The blastema is formed after wound closure through dedifferentiation of at least three terminally differen-tiated cell types, fibroblasts [1], keratinocytes [2] and myotubes [3]. Endogenous stem cells like muscle satel-lite cells also seem to provide cells for the blastema [4]. Despite the heterogeneous origin of the blastema cells, histologically they appear as a homogeneous population of cells and therefore have been traditionally viewed as a
single cell type. This view however has been recently challenged [5]. After blastema formation, a period of extensive proliferation of blastema cells follows, before the cells re-differentiate to produce all the different cell types for the tissues of the missing appendage.
In contrast, it only recently became possible to dedif-ferentiate or reprogram somatic cells to pluripotent cells in vitro [6]. Exposure to just four transcription factors (most commonlyOct4, Sox2, c-MycandKlf4) is enough to reprogram fibroblasts and many other differentiated cell types into induced pluripotent stem (iPS) cells [7-11]. This raises the question whether thein vivo ded-ifferentiation or reprogramming seen during regenera-tion has similarities to the in vitroreprogramming of fibroblasts to iPS cells.
We noticed that two of the reprogramming factors were expressed during Xenopus limb regeneration. Furthermore, a recent publication presented evidence that the reprogramming factors c-myc, sox2 andklf4 were expressed during regeneration in newts [12]. Therefore we thought to investigate the similarities and differences on a more systematic and broader scale. * Correspondence: [email protected]
†Contributed equally
1
Center for Regenerative Medicine of Barcelona, 08003 Barcelona, Spain
In this paper we explore the possibility of similarities between reprogramming and regeneration from a mole-cular point of view. We chose two of the current regen-eration models, zebrafish andXenopusfor this purpose. Each model offers different opportunities and techniques that add to the general picture of blastema cell forma-tion. In particular we concentrated on caudal fin regen-eration in zebrafish and limb and tail regenregen-eration in Xenopus. While these three structures are very different anatomically it has been shown that the underlying molecular mechanism of regeneration is very similar [13-18], therefore conservation of the differentiation sta-tus of the blastema cells of these three appendages is as well expected. We focused on the studies of gene expression by quantitative real time polymerase chain reaction (qPCR) of regenerating and non-regenerating tissue compared to an embryonic, pluripotent reference cell type, analysis of the blastema cell cycle by fluores-cence-activated cell sorting (FACS) and a functional approach by knocking down pou5f1/oct4andsox2 with morpholinos in the zebrafish caudal fin demonstrating that some of the core factors needed for reprogramming are present and required during regeneration.
Results
Expression of pluripotency associated markers
To determine whether there are any similarities between in vivoregeneration and reprogramming of fibroblast cells to iPS cells we made two assumptions. First, we treated the blastema as a homogeneous population of cells, as would be predicted if they dedifferentiated to a pluripotent state and second, we expected overall levels of pluripotency associated factors to increase as abun-dance of blastema cells increases up to a comparable expression level of a pluripotent reference cell.
To assess the differentiation status of blastema cells a panel, consisting of zebrafish andXenopus homologues of the genes most commonly used to characterize mouse or human ES and iPS cells, was put together. The panel includes the four most commonly used repro-gramming factors oct4 (pou class 5 homoeobox1, also called pou5f1), sox2 (sex determining region Y box 2), klf4(kruppel-like factor 4),c-myc (proto-oncogene myc) as well as sall4(sal-like4),lin28,a1, 3/4 fucosyltransfer-ase lewis1(Fut1) which is the homologue of stage-speci-fic embryonic antigen-1(ssea1) and others (See Table 1). The panel, however, does not include nanog, a main player for pluripotency acquisition [19], since no homo-logue has been described either in zebrafish orXenopus. Foroct4, four homologues have been described in Xeno-pus (oct25, oct60, oct79 and oct91) and it has been shown for three of them that they can rescue the phe-notype of an oct4-/-knockout mouse embryonic stem (ES) cell line [20].
We first tested the panel of genes in a cell type repre-senting the closest to a pluripotent cell type in these species. Since neither Xenopusnor zebrafish ES cell cul-tures have been properly established [21] we used cells from early developmental stages of both species.
For Xenopus, animal cap cells were chosen as the pluripotent cell type, as these cells are able to differenti-ate into many different cell types of all three germ layers in culture by over-expressing specific genes or by cultur-ing the caps in different conditions [22,23].
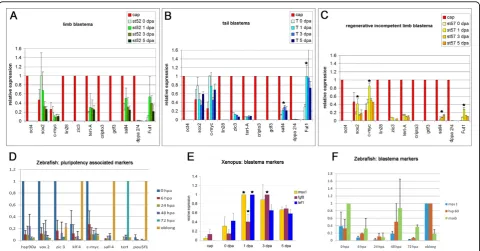
All but two of the pluripotency associated markers tested inXenopuswere expressed in the animal cap cells indicating that a similar gene core network might be operational during early amphibian development to con-fer pluripotency (Figure 1A) to that found in the main-tenance of pluripotency of mouse or human ES/iPS cells [24-27]. The exceptions were Fut1, the homologue of ssea1, andoct91 which did not show expression above the rt- control. (The results foroct25, oct60 andoct79 were combined asoct4 in Figure 1A-1C since they all showed similar expression profiles while oct91was left out of Figure 1A-1C)
To cover the complete process of Xenopus limb and tail regeneration we chose four discrete time points that represent different stages of regeneration to assess the differentiation status of blastema cells: non-regenerating tissue (0 day post amputation (dpa)), blastema formation (1 dpa), blastema expansion (3 dpa) and blastema redif-ferentiation (5 dpa). If cells acquired pluripotency during regeneration one could expect to see an increase in pluripotency associated markers either during blastema formation (1 dpa) or blastema expansion (3 dpa). Since, Xenopusloses the capacity to regenerate its limbs during metamorphosis (stage (st) 56 to 63) [28,29], we included regenerative incompetent limbs at st57 as a further con-trol in our study.
The expression profile of the same factors in Xenopus blastema cells showed some differences to animal cap cells. Out of 11 factors tested only six or seven were expressed in a limb or tail blastema, respectively and each of these factors was also expressed in both non-regenerating limbs (0 dpa) and regenerative incompetent limbs (st57) (Figure 1A-1C).
Of these seven genes, four (zic3, tert-A, dppa2/4, sall4) were expressed at lower levels in the blastema than in pluripotent cells, whilesox2 and c-myc, two of the factors facilitating reprogramming, and Fut-1, an early marker in the reprogramming process, were expressed at similar or higher levels. Not expressed above rt- control were the homologues of oct4 (oct25, oct60, oct79, oct91), lin28, cripto3and gdf3 (Figure 1A and 1B).
Furthermore, none of the factors tested was upregu-lated during limb regeneration. However, some tissue Christenet al.BMC Biology2010,8:5
http://www.biomedcentral.com/1741-7007/8/5
specific differences between tail and limbs were found. Two of the factors, sall4and Fut1, displayed modest upregulation during tail blastema formation, but no sta-tistically significant upregulation during limb regenera-tion even though both factors showed a similar expression wave over time in tail and limb regeneration. (see Figure 1B and 1A). To our surprise we also found some upregulation ofsox2, c-mycandFut1in regenera-tive incompetent pseudo blastemas of st57 limbs that peaked at 1 dpa and dropped back to expression levels
of non-regenerating (0 dpa) limbs by 3 dpa. Since this peak of expression was not seen with all the genes tested, we assumed that it is biologically real and not caused by a technical error. Furthermore, sall4 is also significantly upregulated at 3 dpa and 5 dpa in the regenerative incompetent limbs (Figure 1C). We do not know what the significance of these expression peaks are, however they are certainly not relevant for pluripo-tency in these regenerative incompetent pseudo blaste-mas. A similar early peak of sox2 expression has also
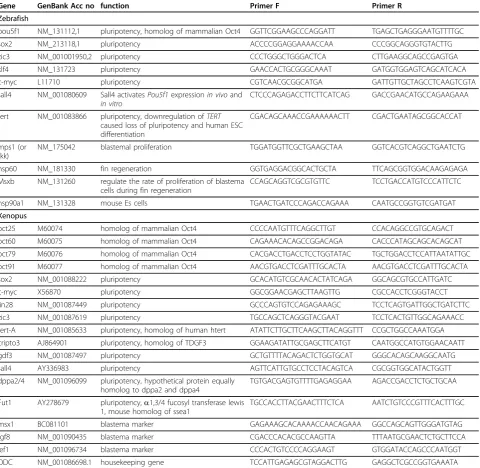
Table 1 Gene panel.
Gene GenBank Acc no function Primer F Primer R
Zebrafish
pou5f1 NM_131112,1 pluripotency, homolog of mammalian Oct4 GGTTCGGAAGCCCAGGATT TGAGCTGAGGGAATGTTTTGC
sox2 NM_213118,1 pluripotency ACCCCGGAGGAAAACCAA CCCGGCAGGGTGTACTTG
zic3 NM_001001950,2 pluripotency CCCTGGGCTGGGACTCA CTTGAAGGCAGCCGAGTGA
klf4 NM_131723 pluripotency GAACCACTGCGGGCAAAT GATGGTGGAGTCAGCATCACA
c-myc L11710 pluripotency CGTCAACGCGGCATGA GATTGTTGCTAGCCTCAAGTCGTA
sall4 NM_001080609 Sall4 activatesPou5f1expressionin vivoand
in vitro
CTCCCAGAGACCTTCTTCATCAG GACCGAACATGCCAGAAGAAA
tert NM_001083866 pluripotency, downregulation ofTERT
caused loss of pluripotency and human ESC differentiation
CGACAGCAAACCGAAAAAACTT CGACTGAATAGCGGCACCAT
mps1 (or tkk)
NM_175042 blastemal proliferation TGGATGGTTCGCTGAAGCTAA GGTCACGTCAGGCTGAATCTG
hsp60 NM_181330 fin regeneration GGTGAGGACGGCACTGCTA TTCAGCGGTGGACAAGAGAGA
Msxb NM_131260 regulate the rate of proliferation of blastema cells during fin regeneration
CCAGCAGGTCGCGTGTTC TCCTGACCATGTCCCATTCTC
hsp90a1 NM_131328 mouse Es cells TGAACTGATCCCAGACCAGAAA CAATGCCGGTGTCGATGAT
Xenopus
oct25 M60074 homolog of mammalian Oct4 CCCCAATGTTTCAGGCTTGT CCACAGGCCGTGCAGACT
oct60 M60075 homolog of mammalian Oct4 CAGAAACACAGCCGGACAGA CACCCATAGCAGCACAGCAT
oct79 M60076 homolog of mammalian Oct4 CACGACCTGACCTCCTGGTATAC TGCTGGACCTCCATTAATATTGC
oct91 M60077 homolog of mammalian Oct4 AACGTGACCTCGATTTGCACTA AACGTGACCTCGATTTGCACTA
sox2 NM_001088222 pluripotency GCACATGTCGCAACACTATCAGA GGCAGCGTGCCATTGATC
c-myc X56870 pluripotency GGCGGAACGAGCTTAAGTTG CGCCACCTCGGGTACCT
lin28 NM_001087449 pluripotency GCCCAGTGTCCAGAGAAAGC TCCTCAGTGATTGGCTGATCTTC
zic3 NM_001087619 pluripotency TGCCAGCTCAGGGTACGAAT TCCTCACTGTTGGCAGAAACC
tert-A NM_001085633 pluripotency, homolog of human htert ATATTCTTGCTTCAAGCTTACAGGTTT CCGCTGGCCAAATGGA
cripto3 AJ864901 pluripotency, homolog of TDGF3 GGAAGATATTGCGAGCTTCATGT CAATGGCCATGTGGAACAATT
gdf3 NM_001087497 pluripotency GCTGTTTTACAGACTCTGGTGCAT GGGCACAGCAAGGCAATG
sall4 AY336983 pluripotency AGTTCATTGTGCCTCCTACAGTCA CGCGGTGGCATACTGGTT
dppa2/4 NM_001096099 pluripotency, hypothetical protein equally homolog to dppa2 and dppa4
TGTGACGAGTGTTTTGAGAGGAA AGACCGACCTCTGCTGCAA
Fut1 AY278679 pluripotency,a1,3/4 fucosyl transferase lewis 1, mouse homolog of ssea1
TGCCACCTTACGAACTTTCTCA AATCTGTCCCGTTTCACTTTGC
msx1 BC081101 blastema marker GAGAAAGCACAAAACCAACAGAAA GGCCAGCAGTTGGGATGTAG
fgf8 NM_001090435 blastema marker CGACCCACACGCCAAGTTA TTTAATGCGAACTCTGCTTCCA
lef1 NM_001096734 blastema marker CCCACTGTCCCCAGGAAGT GTGGATACCAGCCCAATGGT
ODC NM_001086698.1 housekeeping gene TCCATTGAGAGCGTAGGACTTG GAGGCTCGCCGGTGAAATA
been found in the non-regenerating ventral iris during lens regeneration in newts [12].
To test the quality of our dataset, three other genes that have been described as blastema markers (msx1, fgf8 and lef1), were tested and showed the expected upregulation of expression during the first 5 dpa (Figure 1E) giving us confidence in the quality of the dataset [13,30-32].
Other studies have reported sox2 and c-myc expres-sion in newt lens and limb regeneration [12]. While these authors report upregulation of the two factors in newt limbs, we did not see a significant change in expression levels during regeneration inXenopus. More-over, the two factors were also expressed in regenerative incompetent limbs in Xenopus, with c-myc being expressed at much higher levels in the older limb than in the younger, regenerative competent limb.
For zebrafish, embryos at the oblong blastula stage (3 2/3 hpf at 28.5°C) were chosen to represent the pluripo-tent cell type since this stage is considered optimal to try to derive zebrafish ES cells [33]. These blastula
derived cells have been shown to be able to contribute towards the germ line if injected into zebrafish embryos and therefore to be pluripotent [34].
In accordance, we found that all eight pluripotency related genes tested were expressed in these blastula cells (Figure 1D and Additional file 1), with three of them (pou5f1, klf4, sall4) expressed at significantly higher levels than in early regenerating fin cells. The other five genes (sox2, c-myc, tert, zic3, hsp90a) were expressed at low levels, both in the embryonic cells and in non-regenerating fin, with onlysox2showing signifi-cantly higher expression in fin than in embryonic cells (Figure 1D). We noticed, though, much higher sox2 expression in a slightly younger blastula stage (unpub-lished result) but not in oblong stage.
In agreement with results obtained inXenopus, none of the eight pluripotency associated markers tested showed any upregulation during wound healing (6 h), blastema formation (24 h, 48 h) or blastema outgrowth (72 h). Intriguingly, pou5f1 was not completely shut down in adult fins and was also expressed in the
Figure 1qPCR of a pluripotent cell type compared with cells of the regeneration blastema.A)Relative expression of pluripotency associated genes inXenopuscap cells compared to limb blastema (st52) at different time points during regeneration. In red is relative
expression of animal cap cells, in green the relative expression of st52 limb blastemas at 0 dpa, 1 dpa, 3 dpa and 5 dpa. (note: the results for
oct25, oct60andoct79expression was combined asoct4expression).B)Relative expression of pluripotency associated genes inXenopuscap cells and st52 tail blastema cells.C)Relative expression of pluripotency associated genes inXenopuscap cells and regenerative incompetent pseudo blastemas of st57 limbs at 0 dpa, 1 dpa, 3 dpa, and 5 dpa. Asterisks indicate significant (P< 0.05) upregulation of expression compared to 0 dpa.D)Relative gene expression for pluripotency associated markers in zebrafish non-regenerating (0 hpa), regenerating (6 hpa to 72 hpa) fin and embryonic cells in oblong stage.E)Relative expression of blastema markers in cap cells and regenerating limbs. Asterisks indicate significant (P< 0.05) upregulation of gene expression compared to the previous time point.F)Relative expression of blastema markers in zebrafish non-regenerating (0 hpa), regenerating (6 hpa to 72 hpa) fin and embryonic cells in oblong stage. For each gene, expression was normalized to highest expressing tissue. Error bars indicate Standard deviation (SD). (For statistical differences see Additional file 1).
Christenet al.BMC Biology2010,8:5 http://www.biomedcentral.com/1741-7007/8/5
blastema, while no expression was found in blastemas of either newts orXenopus ([12], this paper). Some of the fin blastema markers were unexpectedly highly expressed also at oblong stage (Figure 1F).
These results demonstrate that expression of tency associated genes alone does not indicate pluripo-tency of that cell, since all of these genes are also expressed in differentiated cells of the limb, tail and fin at similar levels.
To make sure we did not miss any relevant gene in our panel, we investigated the relative expression of pluripotency associated genes in previously published microarray data sets from regenerating Xenopuslimbs and cap cells and zebrafish caudal fin (see Methods). We found good agreement with our qPCR results in that the relative expression of pluripotency associated markers was generally higher in animal cap cells than in Xenopusblastema cells and in particular they were not upregulated upon amputation in limb blastema cells compared to non-regenerating limbs. One notable dif-ference though is, that oct91 was found to be more highly expressed in animal cap cells, but similarly was not expressed or very lowly expressed in blastema cells. The difference might originate from a suboptimal pri-mer set used in qPCR analysis.
The zebrafish caudal fin qPCR results too, were in agreement with published microarray data from regener-ating adult fins. Generally the stem cell markers were expressed both in regenerating and non-regenerating fins and none was upregulated in blastema cells, while the relative expression of blastema markers was higher in regenerating adult fins [35]. This confirms that our qPCR results represent the general trend.
Spatial expression pattern of pluripotency associated stem cell markers
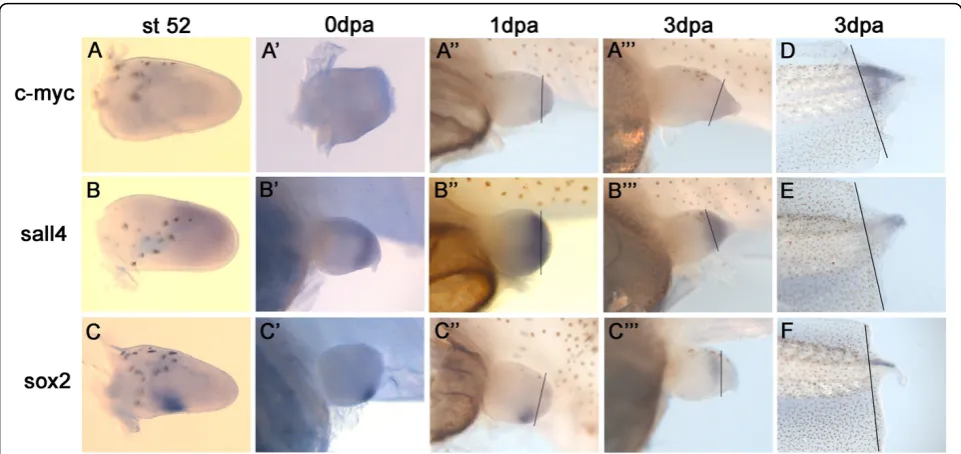
For function, not only absolute expression level but also spatial distribution of a factor matters. Therefore, we investigated the spatial expression of some of the repro-gramming and pluripotency associated factors in Xeno-pus looking at the expression patterns of the three factors that showed the highest absolute real time expression (sox2, c-mycandsall4).
In situ hybridization revealed that c-myc was most highly expressed in the non-regenerating Xenopus tail and the tail blastema where it spread over the whole of the regeneration bud, including notochord, neural tube and mesenchyme (Figure 2D). The expression in the developing (Figure 2A) and regenerating limb bud (Fig-ure 2A’-2A"’ was much lower and diffusely spread over the whole limb bud, which matched with the qPCR result where expression was four times lower in the limb bud than in 3 dpa tail blastema.
The expression pattern of sall4 in developing and regenerating limb buds has been published previously
[36] and is included here because it is one of the most highly expressed pluripotency associated genes in regen-eration blastemas.
We found sall4was localised to the distal mesench-yme of the developing st52 limb bud (Figure 2B) and was also strongly expressed in the mesenchyme of the regenerating limb (Figure 2B’-2B"’), which was in agree-ment with the published expression pattern. In the regeneration bud of the tail sall4was mainly localized to the distal tip (Figure 2E).
In contrast,sox2 showed a very distinct localization to a posterior region in the developing limb bud just proxi-mal to the amputation plane (Figure 2C). In the regen-erating limb sox2 seemed still confined to the same region in the distal stump and showed little or no expression in the blastema itself (Figure 2C’-2C"’). Dur-ing collection of blastemas for qPCR this distal stump region was included since dedifferentiation is thought to happen in this distal zone.
During tail regeneration sox2expression was confined to the neural tube (Figure 2F).
The diffuse expression pattern seen for c-myc and sall4is compatible with a model where c-mycandsall4 induce or facilitate dedifferentiation of the stump tissue and keep the cells in a less differentiated state. However, the localised expression pattern seen for sox2 points more towards a role in the development of a specific tis-sue or cell type in the neural tube and limb bud. Cell cycle analysis in regenerating and non-regenerating fin cells versus embryonic cells
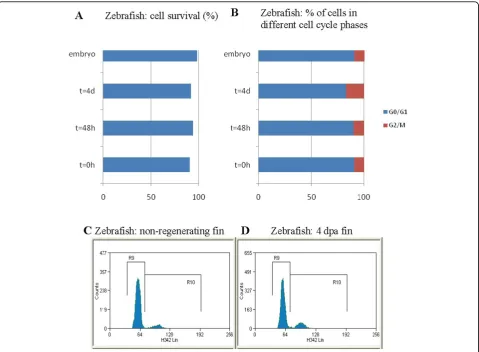
Embryonic stem cells differ markedly from other cells in their cell cycle profile and regulation. It has been shown that ES cells and other pluripotent cells have much shorter gap phases (G1 and G2) or lack them altogether. These particular cell cycle properties of ES cells have been connected with pluripotency maintenance [37]. To compare cell cycle profiles of pluripotent blastomere cells and fin blastema cells, we performed a FACS analy-sis of their cell cycle.
Cell survival after blastomere and blastemal cell recov-ery was high in all samples, ranging from 90% to 98% (Figure 3A). In all samples most of the cells were in G0/ G1. The percentage of cells in G2/Mitosis (G2/M) was quite similar in the non-regenerating fin (t = 0 hours post amputation (hpa)), early regenerating fin (48 hpa blastema) and in the embryo (9.3%, 10.6% and 10.14% respectively) but higher in 4 dpa blastema cells (17.2%) where regenerative outgrowth is at its highest (Figure 3B, 3C and 3D).
blastema were more actively dividing than in the non-regenerating fin. On the other hand, histograms from flow cytometric analysis of Hoechst-stained cells did not show similarities between FACS cell profile in embryos and in the regenerating fin (data not shown) indicating that blastemal cells are controlled by a somatic cell cycle and do not revert to an embryonic one.
Knockdown of eitherpou5f1orsox2impairs fin regeneration
Having shown the presence of the reprogramming fac-tors, we wanted to test whether they were necessary for regeneration. To test for functionality we carried out a morpholino knockdown in the zebrafish caudal fin using two published morpholinos which had been tested in the embryo for specificity and function. We chose to use morpholino 1 (from now on called pou MO) against thepou5f1gene [38]. Pou MO has been shown to phe-nocopy the mutant strain spiel-ohne-grenzen (spg), which has a mutation in thepou5f1gene. The sox2 MO has been previously tested during retina pattern forma-tion in zebrafish [39]. Since we did not know what phe-notypes to expect for pou MO and sox2 MO injected fin blastemas, we used msxb morpholino, which has a published phenotype in fin regeneration as a positive control. The homeobox genemsxb, a frequently used blastema marker, has been shown to be indispensable
for blastema growth with a morpholino knockdown method [40]. If we were able to replicate the published msxb MO phenotype in the fin then we could have con-fidence in the phenotype from the pou MO and sox2 MO.
As a control for unspecific phenotypes induced by injection we injected the lineage tracer dextran and a pou MO with five mismatches (pou 5-mis MO). As expected neither dextran nor pou 5-mis MO had an effect on fin outgrowth (Figure 4A and 4G (The increase in dorsal regrowth seen with pou 5-mis MO is not sig-nificant)). Our positive control, msxb MO, injected into a 3 dpa blastema inhibited fin regeneration to a similar extent as previously published [40] (Figure 4B and 4G). When pou MO and sox2 MO were injected into the dorsal 3 dpa fin blastema an impairment of regeneration was observed in the dorsal fin (Figure 4C and 4D). While msxb MO reduced overall regrowth in the dorsal fin to 77% of ventral fin regrowth, pou MO and sox2 MO reduced dorsal regrowth over four days to 78% and 87%, respectively. However, if regrowth was calculated for the last 24 h only, when morpholino was actively present, the inhibition was much more pronounced, with dorsal regrowth down to 22%, 33% and 58% for msxb MO, pou MO and sox2 MO, respectively. This demonstrates that both pou5f1 and sox2 are not only
Figure 2In situhybridization ofc-myc, sall4andsox2in developing and regenerating limbs and tails.A-A"’)Expression ofc-mycin developing st52 limbs (A) and amputated limbs at 0 dpa, 1 dpa and 3 dpa (A’-A"’). c-myc expression is diffuse and very weak in the developing limb bud and the blastema.B-B"’)Expression ofsall4in developing st52 (B) and regenerating limbs at 0 dpa, 1 dpa, 3 dpa (B’-B"’).sall4is expressed diffusely in the distal mesenchyme of the developing limb bud and after amputation in the whole of the blastema.C-C"’)Expression ofsox2in developing (C) and regenerating (C’-C"’) limbs.sox2is expressed proximal to the blastema in the posterior mesenchyme.D)c-myc
mRNA is expressed in the entire regeneration bud of a 3 dpa tail and is much stronger than in limbs.E)sall4mRNA expression in 3 dpa tail is mainly seen in the distal tip of the regenerating tail.F)sox2 mRNA expression in 3 dpa tail is confined to the neural tube. (dpa = days post amputation). Thin black line indicates amputation plane
Christenet al.BMC Biology2010,8:5 http://www.biomedcentral.com/1741-7007/8/5
present in the fin blastema but also necessary for regen-eration at 3 dpa (Figure 4H).
Injection of msxb MO only showed a significant reduc-tion of fin outgrowth if injected into a 3 dpa blastema in accordance with the observed increase inmsxb expres-sion around that time as detected by qPCR orin situ hybridization [41]. Reasoning that the reprogramming factorspou5f1andsox2might be already needed at an earlier time point during fin regeneration we injected morpholino at different times during blastema formation and regrowth. Injection of morpholino into 0 dpa fins had no effect on regeneration, though for technical rea-sons we were only able to inject much lower volumes than into blastemas themselves. Injection of sox2 MO into a 1 dpa regenerating fin also did not lead to a pheno-type (Figure 4F and 4I). However, pou MO injected into 1 dpa blastema inhibited dorsal fin outgrowth by 40%. If morpholinos were injected into 2 dpa fin blastemas again pou MO but not sox2 MO reduced fin outgrowth by a similar extent as at 1 dpa (Figure 4E, 4F and 4I).
So while msxb and sox2 are only needed for fin regrowth at three days post amputation,pou5f1 has an additional function during the formation and outgrowth of the early blastema.
To see if the reduction in regrowth was due to cell death we performed terminal deoxynucleotidyl transfer-ase-mediated dUTP nick end labeling (TUNEL) staining 24 h after injecting pou MO into 2 dpa fin blastemas to visualise dying cells. A count of defined areas of four different fins revealed no difference in numbers of dying cells between the dorsal and the ventral fin (Figure 4J). In contrast, when we analysed cell proliferation by pH3 immunostaining in 4 dpa fin blastemas injected with pou MO 24 h earlier, we could see a clear and signifi-cant reduction (P≤ 0.05) in cell divisions in the dorsal fin in three out of four fins (Figure 4J). The difference between dorsal and ventral cell divisions is not as big as expected because pH3 immunostaining only marks actively dividing cells at one particular time point. Furthermore dorsal outgrowth seems to recover over
Figure 3Cell cycle analysis.(A)Cell survival after blastomere and blastemal cell recovery at different time points (0 h, 48 h and 4 d).(B)
time since dorsal and ventral regrowth differences become less pronounced 48 h after MO injection.
Discussion
Restricted dedifferentiation of blastema cells
Appendage regeneration is a complex biological process that takes place only in a few lower vertebrates like tele-ost fish and some amphibians. A key step in the replace-ment of the lost appendage is the formation of the blastema, a transient structure of undifferentiated and proliferating cells which gives rise to all the different
cell types in the newly formed appendage. However, how exactly blastema formation is achieved is still unknown. The idea that the process of dedifferentiation of fibroblast cells to iPS cells and dedifferentiation dur-ing in vivo regeneration is regulated by a similar mechanism is attractive but unexplored.
For that reason, expression profiles of pluripotency associated factors in blastemal cells were compared with expression profiles in pluripotent embryonic reference cells. A hallmark of vertebrate epimorphic regeneration is the re-activation of genes that are active during
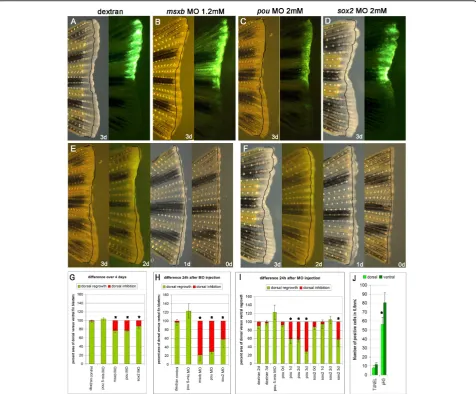
Figure 4Morpholino injection into zebrafish caudal fins.A-D)Bright field and fluorescence picture of a dextran (A) msxb MO (B) pou MO (C) and sox2 MO (D) injected and electroporated fin: injections were done into the dorsal half of a 3 dpa blastema and photographed 24 h later.E, F)Time course for pou MO (E) and sox2 MO (F) injected and electroporated fins at 3 dpa, 2 dpa, 1 dpa and 0 dpa. Pictures were taken 24 h after injection.G-I)Percentage of dorsal versus ventral fin outgrowth (in green) and average inhibition of dorsal versus ventral fin (in red) of fins which were injected 3 dpa (G, H) and on day 0 to 3 pa as indicated (I). (see Method for exact calculation) (Asterisk indicate significant difference (P< 0.5) compared to dextran or pou 5-mis MO control or for 1 dpa injected fins between pou MO and sox2 MO injected fins).J)
Measurement of apoptosis and cell proliferation in pou MO injected fins. There is no significant difference between dorsal and ventral fins in apoptosis as measured by TUNEL while there is a significant reduction of cell divisions in the dorsal fin as measured by pH3 staining (P≤0.05). Black lines indicate blastema size on day of injection. Error bars indicate standard error.
Christenet al.BMC Biology2010,8:5 http://www.biomedcentral.com/1741-7007/8/5
embryonic development [42]. We assumed that if blas-tema cells became pluripotent they would reactivate or upregulate the genes which are part of the pluripotency network, as is seen for iPS cells [25-27].
However, we found that blastemal cells had little in common with our pluripotent reference cells. Blastema cells neither upregulated any of the key transcription factors needed for induction of iPS cells (pou5f1, sox2, c-myc, klf4) as would be expected if they became pluri-potent nor did they significantly upregulate many of the other transcription factors needed for self-renewal in iPS cells. Furthermore, hierarchical clustering of the published global gene expression data for Xenopus ani-mal cap cells and blastema cells [43-45] demonstrated that they exhibit a different expression pattern, that is, blastema cells clustered on a different tree branch than pluripotent cells (data not shown). In other aspects as well, blastema cells were distinct from pluripotent cells. The analyses of the cell cycle showed that blastema cells have all the characteristics of somatic cells and cycle more slowly than pluripotent stem cells.
Furthermore, evaluation of the expression pattern of the three most highly expressed genes duringXenopus regeneration in the qPCR analysis revealed that one is not expressed uniformly in the blastema as would be expected if it had a role in conferring or maintaining pluripotency in these cells. This evidence suggests that blastema cells are not pluripotent but at best only multi-potent. A similar conclusion was reached for newt blas-tema cells since neither oct4 nor nanog, two of the central factors in the network conferring pluripotency to iPS cells, were expressed [12]. Additionally, a recently published paper implies that blastema cells have less dif-ferentiation potential than thought [5]. Kragl et al. (2009) reported that the regeneration blastema in Axolotl is a pool of heterogeneous progenitor cells with restricted developmental potential, despite the rather uniform and undifferentiated appearance of blastema cells. By labelling specific tissues with embryonic tissue grafts marked with green fluorescent protein they could show that each tis-sue produces its own progenitor cells. These progenitors do not cross tissue boundaries during regeneration but only regenerate its own tissue type, so muscle regenerates muscle and cartilage regenerates cartilage, with the only exception of dermis which is able to make cartilage and dermis but not muscle. In accordance, a recent proteo-mics analysis of regeneratingXenopuslimb buds revealed a significant number of upregulated proteins in blastema cells are also found in one or more adult stem cell types [46]. Whether this means that mature cell types dediffer-entiate to become more like adult stem cells or whether resident adult stem cells are activated to produce blas-tema cells with hallmarks of the cells of origin is unclear at the moment.
Possible mechanism and function
Despite the evidence that blastema cells are not pluripo-tent there are some strong similarities between blastema cells and iPS cells. Blastema cells and their precursors express low levels of some or all of the key factors needed for reprogramming to iPS cells. We hypothesise that these low levels are sufficient to trigger a similar mechanism to reprogramming which then gets stalled in an early, partially reprogrammed state leading to a cell which is only multipotent. Such intermediate states are frequently found during reprogramming among iPS colonies. Some inroads have been made in deciphering the mechanism of reprogramming by analysing this/ these intermediate state/s (see review: [47]).
The process of reprogramming is slow and takes one to two weeks. Some of the earliest markers that are upregulated during this process are alkaline phosphatase (AP) and SSEA1. The SSEA1 expressing cells then acti-vate other pluripotency associated genes likeOct4, Sox2, Nanog andTertonly late in the process. The two early markers (AP and Fut1, homologue of ssea1) are also either expressed or upregulated during blastema forma-tion in Xenopus(not shown and Figure 1). Therefore it is plausible that these two genes might function in a similar way during dedifferentiation and blastema for-mation as during reprogramming by facilitating the action of the later factors.
not enough to confer real pluripotency reverting the blas-tema cells to a completely reprogrammed state, however, that a synergistic effect ofpou5f1together with other pluripotency genes, could enable these cells to dediffer-entiate and provide them with the multipotency required to give rise to certain cell types, allowing the reconstitu-tion of the lost structure. However, whilepou5f1/oct4is required for fin regeneration, it does not seem to be essential for blastema formation in general, since neither Xenopusnor newt reactivatepou5f1/oct4homologue expression in the blastema [12]. But then again repro-gramming of neural stem cells has also been achieved withoutOct4as one of the reprogramming factors indi-cating that reprogramming can be successful without exogenousOct4[48].
In contrast to what was observed for pou5f1, sox2 seems to be mainly required for regenerative outgrowth similarly to what has been observed formsxb. Taking the expression pattern ofsox2in limb and tail blastema and its role in fin outgrowth into account we speculate that sox2 could have a role in specifying early neural precursor cells that contribute to the innervation of the regenerate. A role for sox2 in neurogenesis has been previously described in other species [49,50] and in mouse ES cells [51]. Furthermore, in a previousin vitro study we observed thatsox2is expressed in blastula cell colonies that will subsequently give rise to neuronal pre-cursors (unpublished results). Additionally, limb and fin blastema outgrowth requires innervation to proliferate and replace structures [52-55].
Research into the mechanism behind reprogramming also demonstrated that the presence of the reprogram-ming factors alone was not sufficient for success since secondary iPS cells harbouring dox-inducible transgenes were only induced at a rate of 2% [56,57]. There are sev-eral lines of evidence that a correct stoichiometric mix-ture of the reprogramming factors is necessary for successful reprogramming and that more is not necessa-rily better. Leaving some of the factors out of the repro-gramming cocktail can increase iPS efficiency in cells with expression of these factors [58]. Others have found that in an all-in-one vector approach, the sequence of the factors is important, again pointing towards the importance of delivering the correct relative level for each reprogramming factor. This could explain why low levels of the pluripotency associated factors might be sufficient to start the dedifferentiation/reprogramming process during blastema formation if the stoichiometric requirement is fulfilled. Furthermore, it could also account for why older, non-regeneratingXenopuslimbs will not initiate blastema formation despite expressing the same factors but at different and ineffective stoichio-metric combination.
Conclusions
Knocking down the expression of pou5f1/oct4andsox2 with morpholinos resulted in an impairment of regen-eration, indicating that, despite the low expression levels, these factors do have a functional role during epi-morphic regeneration. In the light of this functional evi-dence we make an associative link between partially reprogrammed iPS cells and the half way state of blas-tema cells and suggest that the processes leading to these two cell types might be regulated by some com-mon mechanisms.
Methods
Animal maintenance
Zebrafish (AB strain) were maintained in tanks with recirculating water system under standard conditions [59]. Xenopus laevis tadpoles were kept in a recirculat-ing system at 23°C and fed twice a day until the required stage [60].
Embryo collection and blastema recovery
Zebrafish embryos were washed for two minutes with a 0.5% bleach solution, rinsed twice with embryo medium (EM) and kept in fresh EM at 28°C until they reached the oblong stage (3 2/3 h) [61].
For blastema recovery, fish were anaesthetized in tri-cain, caudal fins were partially amputated and animals were then kept in system tank until sample recovery. Samples were recovered at different times: 0 hours post-amputation (hpa), 6 hpa (when a thin layer of wound epidermis appears), 24 hpa (wound epidermis), 48 hpa (functional blastema), 3 dpa and 4 dpa. Fin samples from six animals were pooled for each replicate and four to seven replicates have been done.
For Xenopusanimal caps, embryos were obtained by artificial fertilization and cultured in 0.1 Modified Barth’s Saline (MBS) until stage 9 at which point 20 ani-mal caps were excised and pooled for RNA extraction. For tail and limb transections tadpoles were anaesthe-tized in 1/3000 MS222 in 0.1 × MMR and transferred to a moistened paper towel. For tail amputations, the posterior 50% of the tail was removed with iridectomy scissors. Limbs (st52 or st57) were amputated bilaterally at mid zeugopod level. After amputation tadpoles were let to recover in 0.1 × MMR and kept and fed in the lab in individual tanks till blastema recovery. Blastemas (including about 200μm of the distal stump tissue) of 20 tadpoles each were recovered at 0 dpa, 1 dpa, 3 dpa and 5 dpa and pooled for RNA extraction. Two to three replicas have been done for each time point.
RNA extraction and cDNA Synthesis
Total RNA was extracted from zebrafish embryos, cap cells or blastemas using TRIZOL® method according to the manufacturer’s guidelines (Invitrogen S.A., Barcelona, Christenet al.BMC Biology2010,8:5
http://www.biomedcentral.com/1741-7007/8/5
Spain) RNA concentration was measured using a Nano-Drop spectrophotometer (ND-1000) and 0,2-1μg total RNA was used for reverse transcription in a 20μl mix-ture containing 1μl of 50μM Oligo(dT) primer, 2μl 10 mM dNTP Mix, 4μl 5× cDNA synthesis Buffer, 1μl 0,1 MDTT, 1μl RnaseOUT, 1μl Cloned AMV RT (15 units/
μl) (Invitrogen S.A, Barcelona, Spain) and DEPC-treated water to 20μl. The reverse transcription was conducted at 50°C for 50 minutes and 85°C for five minutes, and samples were stored at -20°C until use. A pool of 100 embryos was used for each replicate
Real-Time quantitative PCR
PCR products were detected by measuring the increase in fluorescence caused by the binding of SYBR GREEN dye (Invitrogen, 11760-500) to dsDNA in the reaction tube. For zebrafish 10 μl SYBR were added to 6 μl water, 2μl sample and 1μl of each primer (10 μM). For Xenopus the cDNA was diluted 1:25 first and then 5μl of the dilution were combined with 3 μl of water and 1
μl of each primer (10 μM) before 10 μl SYBR green were added. The primers were designed by using the Primer Express (v.3.0) Software from Applied Biosys-tems Foster City, CA, USA. Primer pairs were chosen to minimize dimerization and to be situated as far as possi-ble towards the 3’end of the mRNA. Relative expression of the PCR products was determined by using theΔΔCt method [62,63] using as housekeeping gene rpl13A (Zebrafish) or ornithine decarboxylase (ODC) (Xenopus) and then normalizing against the highest expression. Each sample was run in duplicate to triplicate and the mean Ct was used in the equation. The primer sets used are shown in Table 1.
Flow cytometry analysis
For cell cycle analysis, cells were incubated at 37°C for 30 minutes using Hoechst 33342 (H342 - SIGMA, Madrid, Spain) (10 μg/ml final concentration). The tubes were cooled on ice and cells were pelleted by cen-trifugation (200 g, 5 minutes). The supernatant was removed and cells were resuspended in 0.5 ml of PBS (4°C).
Propidium Iodide (PI - SIGMA, Madrid, Spain) was added at 4 μg/mL (final concentration) to detect dead cells. Immediately after, samples were acquired in a Moflo cell sorter (DakoCytomation (Fort Collins, CO, USA)) adjusted for both UV (351 nm) and blue (488 nm) excitation lines for the detection of H342 (450/65) and PI (670/30) fluorescence respectively. All analyses were performed applying Summit software DakoCyto-mation (Fort Collins, CO, USA).
Re-analysis of microarray data sets
Microarray data are available at the NCBI Gene Expres-sion Omnibus database under the following accesExpres-sion numbers:Xenopusanimal cap - GSE3334 (Dickinson et al., 2006), GSE8990, GSE8496, Xenopus regenerating
hindlimb - GSE9813 (Pearl et al., 2008), GSE4738 (Grow et al., 2006), zebrafish caudal fin adult - GSE3667 [35], zebrafish caudal fin larval - GSE10184, zebrafish caudal fin adult/larval - GSE10188.
Microarray data was normalized independently for each experiment using GC-RMA in R statistical software http://www.r-project.org. Then for each gene in each sample a relative expression was calculated using a per-cent rank. It is defined as a rank of the value in a data-set as a percentage of the datadata-set, and evaluates the relative standing of a value within a dataset. The percent ranks of the genes of interest were obtained from respective probes in each dataset.
The hierarchical clustering was performed using hclust function with theaveragemethod in R software.
Immunohistochemistry
For cell division and apoptosis detection, fins were fixed (with PFA 4% for 2 h at 4°C) and used as whole mounts. Fins were first washed three times in Tris buffered saline (TBS) for 10 minutes before they were permeabelised in TBS plus 0.02% Triton and 0.05% tween-20 for 30 min-utes at RT. They were than washed twice in TBS for five minutes, incubated in 10 mM Tris-HCl plus 5 mM EDTA at pH 8.5 for 10 minutes before proteinase K trea-ted (20μg/ml) in the same Tris buffer as before for 15 minutes. Two washes in 5 mM EDTA for five minutes were followed by incubation in the TdT buffer pH7.75 for 10 minutes to equilibrate for the TUNEL reaction. For the TUNEL reaction (2 h at 37°C) the in situ Cell death detection kit TMR red from Roche Diagnostics, Barcelona, Spain was used according to manufacturer’s instruction with an enhancement step of the signal. To stop the reaction, fins were washed in Saline-sodium citrate (SSC) plus EDTA buffer twice for 10 minutes, fol-lowed by two washes in TBS for 10 minutes. Fins were blocked in TBS plus 6% donkey serum twice for 10 min-utes and then incubated in biotinylated anti-rodamin (1:20) and anti-pH3 (1:500) antibody (rat, Sigma) over-night at 4°C. Next day fins were washed extensively in TBS plus serum before incubated in secondary antibody (Strepdavidine-Alexa568, 1:400; and anti-rat IgG-Cy5, 1:100) overnight at 4°C. Finally samples were washed in TBS, exposed to Dapi for five minutes and mounted to be examined as previously described.
In situhybridization
with KpnI and transcribed with T7 while sense probe was cut with XhoI and transcribed with Sp6. Sox2-pCMV-Sport6 was cut with BamHI to make either anti-sense or anti-sense probe and transcribed with T7 or Sp6, respectively.
MO microinjection andin vivoelectroporation
MO microinjection and electroporation was essentially done as in [40] with a few modifications. Fish were anesthetized with tricaine as previously described and one of 4 MO (GeneTools, Inc. Philomath, OR, USA) was injected into the dorsal side of a 0 to 3 dpa fin blas-tema grown at 28°C. Immediately after the injection of the blastema distal to each dorsal bony ray with MO, the whole fin was electroporated using a CUY21 Square Wave Electroporator and CUY647-5 × 10 tweezer elec-trodes (Nepa Gene Co, Ldt, Japan). We used the same parameters as Thummel et al.; with 10 consecutive 50 msec pulses at 15V with a one second pause between pulses and an approximately 2 mm gap between the tweezer electrodes. As conducting gel we used 3% methylcellulose. Each fish was tracked individually to calculate the regeneration progress over time. Zebrafish fins were imaged just after MO injection/electroporation and again 24 h later. The area of both dorsal and ventral regrowth was measured using the MetaMorph office programme (Molecular Devices Corporation, USA). Per-centage of overall fin regrowth was determined as (D/V) x100 (where D is dorsal blastema and V is ventral blas-tema 24 h after MO injection). Growth over the last 24 h was calculated by (Dx-D(x-1))×100/(Vx-V(x-1)) (where Dx is dorsal blastema at day x and D(x-1) is dor-sal blastema on the day before, Vx is ventral blastema at day x and V(x-1) is ventral blastema on day before, making sure that D(x-1) and V(x-1) (dorsal and ventral blastema on day of morpholino injection) are of equal size. N = 5 for dextran 2d, n > 20 for pou MO 3d, n = 8 to 12 for rest.
Morpholinos used are: msxb MO;
TTAAC-CATCCGCCACGAGCTGCTGC, pou MO;
CGCTCTCTCCGTCATCTTTCCGCTA, pou 5-mis MO, CGGTCTGTCCGTGATCTTTGCGGTA, sox2 MO; GCTCGGTTTCCATCATGTTATACA. Each mor-pholino contained a 3’fluorescein tag and was resus-pended as a 2 mM solution in water and either injected at 1.2 mM (msxb MO) or 2 mM (sox2 MO, pou MO, pou 5-mis MO).
Statistical analysis
In zebrafish, qPCR data were analyzed with SPSS soft-ware (SPSS Inc., Chicago, IL, USA) (SPSS Statistics 17.0) using a repeated measures linear mixed-effect model (LME) to test the significance of changes in gene expression. Oblong stage (for pluripotency associated markers) and 48 hpa (for blastema markers) were used as intercept for the models, whereas replicates were
used as a grouping factor (random effect). Results in Additional file 1 show the expression effect size at each time point (mean+-SEM) compared to oblong stage and 48 hpa, respectively. For verifying XenopusqPCR or the morpholino knockdown results a student t-test was performed.
Animal Welfare
All animal experiments were done with the approval of the institutions ethical committee.
Additional file 1: Figure S1: Statistical relevance of changes in expression levels. Effect sizes (mean ± error) for each regeneration time point on the intercept, for zebrafish pluripotency associated makers and blastema markers. Oblong stage (for pluripotency markers) and 48 hpa (for blastema markers) were the intercept of the models. Asterisks represent statistical differences with the intercept.
Click here for file
[ http://www.biomedcentral.com/content/supplementary/1741-7007-8-5-S1.PDF ]
Additional file 2: Figure S2: Cell divisions in non- regenerating and regenerating fin. Immunohistochemistry of phospho-Histone H3 localization in zebrafish fins: 0 hours (A) and 48 hours (B) post amputation.
Click here for file
[ http://www.biomedcentral.com/content/supplementary/1741-7007-8-5-S2.PDF ]
Abbreviations
dpa: days post amputation; ES: embryonic stem; FACS: fluorescence-activated cell sorting; G0: gap phase 0; G1: gap phase 1; G2: gap phase 2; hpa: hours post amputation; hpf: hours post fertilisation; iPS: induced pluripotent stem; M: Mitosis; MMR: Marc’s modified Ringers; MO: morpholino; pH3: phospho-Histone H3; qPCR: quantitative real time polymerase chain reaction; st: stage; TBS: Tris buffered saline; TUNEL: terminal deoxynucleotidyl transferase-mediated dUTP nick end labelling.
Acknowledgements
We thank Carme Fabregat, Dr. Mercé Martí, Dr. Filipe Martinez-Pastor, José Miguel Vaquero, Lola Mulero, Cristina Pardo and Cristina Morera for technical assistance. This work was partially supported by grants from Ramón y Cajal Program RYC-2008-02339 (VR), Fondo de Investigaciones Sanitarias (TERCEL, PI052847), Marató de TV3, MICINN, Fundación Cellex, The G. Harold and Leila Y. Mathers Charitable Foundation and Ipsen Foundation.
Author details 1
Center for Regenerative Medicine of Barcelona, 08003 Barcelona, Spain.
2Gene Expression Laboratory, The Salk Institute for Biological Studies, La
Jolla, California 92037, USA.3Current address: INDEGSAL, University of León, 24071 León, Spain.4Current address: Department of Molecular Biology,
University of León, 24071, León, Spain.
Authors’contributions
BC participated in design of the study, collected all theXenopusdata, participated in the collection and interpretation of morpholino knockdown and drafted the manuscript. VR participated in design of the study, collected and interpreted all zebrafish qPCR data, collection and interpretation of FACS results, participated in setting up and interpretation of morpholino knockdown and drafted the manuscript. MR helped with design of study, participated in morpholino knockdown study and helped with manuscript. IP provided data analysis and interpretation of microarray reanalysis and helped with manuscript. JCIB participated in design of the study, financial support and helped with manuscript writing.
Received: 15 October 2009
Accepted: 20 January 2010 Published: 20 January 2010 Christenet al.BMC Biology2010,8:5
http://www.biomedcentral.com/1741-7007/8/5
References
1. Satoh A, Bryant SV, Gardiner DM:Regulation of dermal fibroblast dedifferentiation and redifferentiation during wound healing and limb regeneration in the Axolotl.Development, Growth & Differentiation2008,
50:743-754.
2. Satoh A, Graham GM, Bryant SV, Gardiner DM:Neurotrophic regulation of epidermal dedifferentiation during wound healing and limb
regeneration in the axolotl (Ambystoma mexicanum).Dev Biol2008,
319:321-335.
3. Echeverri K, Clarke JD, Tanaka EM:In VivoImaging Indicates Muscle Fiber Dedifferentiation Is a Major Contributor to the Regenerating Tail Blastema.Developmental Biology2001,236:151-164.
4. Morrison JI, Loof S, He P, Simon A:Salamander limb regeneration involves the activation of a multipotent skeletal muscle satellite cell population. The Journal of Cell Biology2006,172:433-440.
5. Kragl M, Knapp D, Nacu E, Khattak S, Maden M, Epperlein HH, Tanaka EM:
Cells keep a memory of their tissue origin during axolotl limb regeneration.Nature2009,460:60-65.
6. Takahashi K, Yamanaka S:Induction of pluripotent stem cells from mouse embryonic and adult fibroblast cultures by defined factors.Cell2006,
126:663-676.
7. Aasen T, Raya A, Barrero MJ, Garreta E, Consiglio A, Gonzalez F, Vassena R, BilićJ, Pekarik V, Tiscornia G, Edel M, Boué S, Izpisúa Belmonte JC:Efficient and rapid generation of induced pluripotent stem cells from human keratinocytes.Nat Biotechnol2008,26:1276-1284.
8. Huangfu D, Osafune K, Maehr R, Guo W, Eijkelenboom A, Chen S, Muhlestein W, Melton DA:Induction of pluripotent stem cells from primary human fibroblasts with only Oct4 and Sox2.Nat Biotechnol2008,
26:1269-1275.
9. Kim JB, Sebastiano V, Wu G, Araúzo-Bravo MJ, Sasse P, Gentile L, Ko K, Ruau D, Ehrich M, Boom van den D, Meyer J, Hübner K, Bernemann C, Ortmeier C, Zenke M, Fleischmann BK, Zaehres H, Schöler HR:Oct4-induced pluripotency in adult neural stem cells.Cell2009,136:411-419.
10. Loh YH, Agarwal S, Park IH, Urbach A, Huo H, Heffner GC, Kim K, Miller JD, Ng K, Daley GQ:Generation of induced pluripotent stem cells from human blood.Blood2009,113:5476-5479.
11. Takahashi K, Tanabe K, Ohnuki M, Narita M, Ichisaka T, Tomoda K, Yamanaka S:Induction of pluripotent stem cells from adult human fibroblasts by defined factors.Cell2007,131:861-872.
12. Maki N, Suetsugu-Maki R, Tarui H, Agata K, Del Rio-Tsonis K, Tsonis PA:
Expression of stem cell pluripotency factors during regeneration in newts.Dev Dyn2009,238:1613-1616.
13. Lin G, Slack JM:Requirement for Wnt and FGF signaling in Xenopus tadpole tail regeneration.Dev Biol2008,316:323-335.
14. Poss KD, Shen J, Nechiporuk A, McMahon G, Thisse B, Thisse C, Keating MT:
Roles for Fgf signaling during zebrafish fin regeneration.Dev Biol2000,
222:347-358.
15. Stoick-Cooper CL, Weidinger G, Riehle KJ, Hubbert C, Major MB, Fausto N, Moon RT:Distinct Wnt signaling pathways have opposing roles in appendage regeneration.Development2007,134:479-489. 16. Whitehead GG, Makino S, Lien CL, Keating MT:fgf20 is essential for
initiating zebrafish fin regeneration.Science2005,310:1957-1960. 17. Yokoyama H, Ogino H, Stoick-Cooper CL, Grainger RM, Moon RT:
Wnt/beta-catenin signaling has an essential role in the initiation of limb regeneration.Dev Biol2007,306:170-178.
18. Kawakami Y, Rodriguez Esteban C, Raya M, Kawakami H, Marti M, Dubova I, Izpisua Belmonte JC:Wnt/beta-catenin signaling regulates vertebrate limb regeneration.Genes & Development2006,20:3232-3237. 19. Silva J, Nichols J, Theunissen TW, Guo G, van Oosten AL, Barrandon O,
Wray J, Yamanaka S, Chambers I, Smith A:Nanog is the gateway to the pluripotent ground state.Cell2009,138:722-737.
20. Morrison GM, Brickman JM:Conserved roles for Oct4 homologues in maintaining multipotency during early vertebrate development. Development2006,133:2011-2022.
21. Xing JG, Lee LE, Fan L, Collodi P, Holt SE, Bols NC:Initiation of a zebrafish blastula cell line on rainbow trout stromal cells and subsequent development under feeder-free conditions into a cell line, ZEB2J. Zebrafish2008,5:49-63.
22. Ariizumi T, Takahashi S, Chan TC, Ito Y, Michiue T, Asashima M:Isolation and differentiation of Xenopus animal cap cells.Current Protocols in Stem Cell Biology2009,Chapter 1, Unit 1D 5.
23. Sive HL, Grainger RM, Harland RM:Animal cap isolation fromXenopus
laevis.Cold Spring Harb Protoc2007.
24. Boyer LA, Lee TI, Cole MF, Johnstone SE, Levine SS, Zucker JP, Guenther MG, Kumar RM, Murray HL, Jenner RG, Gifford DK, Melton DA, Jaenisch R, Young RA:Core transcriptional regulatory circuitry in human embryonic stem cells.Cell2005,122:947-956.
25. Rao S, Orkin SH:Unraveling the transcriptional network controlling ES cell pluripotency.Genome Biology2006,7:230.
26. Orkin SH, Wang J, Kim J, Chu J, Rao S, Theunissen TW, Shen X,
Levasseur DN:The Transcriptional Network Controlling Pluripotency in ES Cells.Cold Spring Harbor Symposia on Quantitative Biology2008.
27. Wang J, Rao S, Chu J, Shen X, Levasseur DN, Theunissen TW, Orkin SH:A protein interaction network for pluripotency of embryonic stem cells. Nature2006,444:364-368.
28. Dent JN:Limb regeneration in larvae and metamorphosing individuals of the South African clawed toad.Journal of Morphology1962,110:61-77. 29. Beck CW, Izpisua Belmonte JC, Christen B:Beyond early development:
Xenopus as an emerging model for the study of regenerative mechanisms.Dev Dyn2009,238:1226-1248.
30. Beck CW, Christen B, Barker D, Slack JMW:Temporal requirement for bone morphogenetic proteins in regeneration of the tail and limb ofXenopus tadpoles.Mechanisms of Development2006,123:674-688.
31. Beck CW, Christen B, Slack JMW:Molecular Pathways Needed for Regeneration of Spinal Cord and Muscle in a Vertebrate.Developmental Cell2003,5:429-439.
32. Endo T, Tamura K, Ide H:Analysis of gene expressions during Xenopus forelimb regeneration.Dev Biol2000,220:296-306.
33. Fan L, Crodian J, Liu X, Alestrom A, Alestrom P, Collodi P:Zebrafish embryo cells remain pluripotent and germ-line competent for multiple passages in culture.Zebrafish2004,1:21-26.
34. Lin S, Long W, Chen J, Hopkins N:Production of germ-line chimeras in zebrafish by cell transplants from genetically pigmented to albino embryos.Proceedings of the National Academy of Sciences of the United States of America1992,89:4519-4523.
35. Andreasen EA, Mathew LK, Tanguay RL:Regenerative growth is impacted by TCDD: gene expression analysis reveals extracellular matrix modulation.Toxicol Sci2006,92:254-269.
36. Neff AW, King MW, Harty MW, Nguyen T, Calley J, Smith RC, Mescher AL:
Expression of Xenopus XlSALL4 during limb development and regeneration.Dev Dyn2005,233:356-367.
37. Burdon T, Smith A, Savatier P:Signalling, cell cycle and pluripotency in embryonic stem cells.Trends in Cell Biology2002,12:432-438.
38. Burgess S, Reim G, Chen W, Hopkins N, Brand M:The zebrafish spiel-ohne-grenzen (spg) gene encodes the POU domain protein Pou2 related to mammalian Oct4 and is essential for formation of the midbrain and hindbrain, and for pre-gastrula morphogenesis.Development2002,
129:905-916.
39. Pujic Z, Omori Y, Tsujikawa M, Thisse B, Thisse C, Malicki J:Reverse genetic analysis of neurogenesis in the zebrafish retina.Dev Biol2006,
293:330-347.
40. Thummel R, Bai S, Sarras MP Jr, Song P, McDermott J, Brewer J, Perry M, Zhang X, Hyde DR, Godwin AR:Inhibition of zebrafish fin regeneration using in vivo electroporation of morpholinos against fgfr1 and msxb. Dev Dyn2006,235:336-346.
41. Akimenko MA, Johnson SL, Westerfield M, Ekker M:Differential induction of four msx homeobox genes during fin development and regeneration in zebrafish.Development1995,121:347-357.
42. Kizil C, Otto GW, Geisler R, Nusslein-Volhard C, Antos CL:Simplet controls cell proliferation and gene transcription during zebrafish caudal fin regeneration.Dev Biol2009,325:329-340.
43. Pearl EJ, Barker D, Day RC, Beck CW:Identification of genes associated with regenerative success of Xenopus laevis hindlimbs.BMC Developmental Biology2008,8:66.
44. Grow M, Neff AW, Mescher AL, King MW:Global analysis of gene expression in Xenopus hindlimbs during stage-dependent complete and incomplete regeneration.Dev Dyn2006,235:2667-2685.
45. Dickinson K, Leonard J, Baker JC:Genomic profiling of mixer and Sox17beta targets during Xenopus endoderm development.Dev Dyn
46. King MW, Neff AW, Mescher AL:Proteomics analysis of regenerating amphibian limbs: changes during the onset of regeneration.The International Journal of Developmental Biology2009,53:955-969. 47. Hochedlinger K, Plath K:Epigenetic reprogramming and induced
pluripotency.Development2009,136:509-523.
48. Shi Y, Do JT, Desponts C, Hahm HS, Scholer HR, Ding S:A combined chemical and genetic approach for the generation of induced pluripotent stem cells.Cell Stem Cell2008,2:525-528.
49. Ferri AL, Cavallaro M, Braida D, Di Cristofano A, Canta A, Vezzani A, Ottolenghi S, Pandolfi PP, Sala M, DeBiasi S, Nicolis SK:Sox2 deficiency causes neurodegeneration and impaired neurogenesis in the adult mouse brain.Development2004,131:3805-3819.
50. Pevny LH, Nicolis SK:Sox2 roles in neural stem cells.The International Journal of Biochemistry & Cell Biology2009.
51. Chen S, Choo AB, Nai-Dy W, Heng-Phon T, Oh SK:Knockdown of Oct-4 or Sox-2 attenuates neurogenesis of mouse embryonic stem cells.Stem Cells and Development2007,16:413-420.
52. Endo T, Bryant SV, Gardiner DM:A stepwise model system for limb regeneration.Dev Biol2004,270:135-145.
53. Kumar A, Godwin JW, Gates PB, Garza-Garcia AA, Brockes JP:Molecular basis for the nerve dependence of limb regeneration in an adult vertebrate.Science2007,318:772-777.
54. Satoh A, James MA, Gardiner DM:The role of nerve signaling in limb genesis and agenesis during axolotl limb regeneration.The Journal of Bone and Joint Surgery2009,91:90-98.
55. Geraudie J, Singer M:Relation between nerve fiber number and pectoral fin regeneration in the teleost.The Journal of Experimental Zoology1977,
199:1-8.
56. Hockemeyer D, Soldner F, Cook EG, Gao Q, Mitalipova M, Jaenisch R:A drug-inducible system for direct reprogramming of human somatic cells to pluripotency.Cell Stem Cell2008,3:346-353.
57. Wernig M, Lengner CJ, Hanna J, Lodato MA, Steine E, Foreman R, Staerk J, Markoulaki S, Jaenisch R:A drug-inducible transgenic system for direct reprogramming of multiple somatic cell types.Nat Biotechnol2008,
26:916-924.
58. Eminli S, Utikal J, Arnold K, Jaenisch R, Hochedlinger K:Reprogramming of neural progenitor cells into induced pluripotent stem cells in the absence of exogenous Sox2 expression.Stem Cells (Dayton, Ohio)2008,
26:2467-2474.
59. Westerfield M:The Zebrafish Book. A Guide for the Laboratory Use of Zebrafish (Danio rerio).Eugene, OR, University of OregonPress 1995, 385. 60. Nieuwkoop PD, Faber J:Normal table of Xenopus Laevis (Daudin).
North-Holland, Amsterdam1967.
61. Kimmel CB, Ballard WW, Kimmel SR, Ullmann B, Schilling TF:Stages of embryonic development of the zebrafish.Dev Dyn1995,203:253-310. 62. Gibson UE, Heid CA, Williams PM:A novel method for real time
quantitative RT-PCR.Genome Research1996,6:995-1001.
63. Winer J, Jung CK, Shackel I, Williams PM:Development and validation of real-time quantitative reverse transcriptase-polymerase chain reaction for monitoring gene expression in cardiac myocytes in vitro.Analytical Biochemistry1999,270:41-49.
64. Pownall ME, Tucker AS, Slack JM, Isaacs HV:eFGF, Xcad3 and Hox genes form a molecular pathway that establishes the anteroposterior axis in Xenopus.Development1996,122:3881-3892.
doi:10.1186/1741-7007-8-5
Cite this article as:Christenet al.:Regeneration and reprogramming compared.BMC Biology20108:5.
Submit your next manuscript to BioMed Central and take full advantage of:
• Convenient online submission
• Thorough peer review
• No space constraints or color figure charges
• Immediate publication on acceptance
• Inclusion in PubMed, CAS, Scopus and Google Scholar • Research which is freely available for redistribution
Submit your manuscript at www.biomedcentral.com/submit Christenet al.BMC Biology2010,8:5
http://www.biomedcentral.com/1741-7007/8/5