R E S E A R C H A R T I C L E
Open Access
Patterns of adiposity, vascular phenotypes
and cognitive function in the 1946 British
Birth Cohort
Stefano Masi
1,2*†, Georgios Georgiopoulos
3†, Tauseef Khan
1, William Johnson
4, Andrew Wong
5,
Marietta Charakida
1, Peter Whincup
6, Alun D. Hughes
7, Marcus Richards
5, Rebecca Hardy
5and John Deanfield
1Abstract
Background:The relationship between long-term exposure to whole body or central obesity and cognitive function, as well as its potential determinants, remain controversial. In this study, we assessed (1) the potential impact of 30 years exposure to different patterns of whole body and central adiposity on cognitive function at 60–64 years, (2) whether trajectories of central adiposity can provide additional information on later cognitive function compared to trajectories of whole body adiposity, and (3) the influence of vascular phenotypes on these associations.
Methods:The study included 1249 participants from the prospective cohort MRC National Survey of Health and Development. Body mass index (BMI), waist circumference (WC), and vascular (carotid intima-media thickness, carotid-femoral pulse wave velocity) and cognitive function (memory, processing speed, reaction time) data, at 60–64 years, were used to assess the associations between different patterns of adult WC or BMI (from 36 years of age) and late midlife cognitive performance, as well as the proportion of this association explained by cardiovascular phenotypes. Results:Longer exposure to elevated WC was related to lower memory performance (p< 0.001 for both) and longer choice reaction time (p= 0.003). A faster gain of WC between 36 and 43 years of age was associated with the largest change in reaction time and memory test (P< 0.05 for all). Similar associations were observed when patterns of WC were substituted with patterns of BMI, but when WC and BMI were included in the same model, only patterns of WC remained significantly associated with cognitive function. Participants who dropped one BMI category and maintained a lower BMI had similar memory performance to those of normal weight during the whole follow-up. Conversely, those who dropped and subsequently regained one BMI category had a memory function similar to those with 30 years exposure to elevated BMI. Adjustment for vascular phenotypes, levels of cardiovascular risk factors, physical activity, education, childhood cognition and socioeconomic position did not affect these associations.
Conclusions:Longer exposure to elevated WC or BMI and faster WC or BMI gains between 36 and 43 years are related to lower cognitive function at 60–64 years. Patterns of WC in adulthood could provide additional information in predicting late midlife cognitive function than patterns of BMI. The acquisition of an adverse cardiovascular phenotype associated with adiposity is unlikely to account for these relationships.
Keywords:Obesity, waist circumference, cognitive function, vascular phenotypes, lifetime risk
* Correspondence:s.masi@ucl.ac.uk †Equal contributors
1National Centre for Cardiovascular Prevention and Outcomes, Institute of
Cardiovascular Science, University College London, 1 St Martin le Grande, London EC1A 4NP, UK
2Department of Clinical and Experimental Medicine, University of Pisa, Pisa,
Italy
Full list of author information is available at the end of the article
Background
The increasing prevalence of obesity represents a major public health concern, as it is associated with an in-creased risk of several chronic diseases, including cardio-vascular disease (CVD). Several reports have suggested that exposure to whole body and abdominal obesity could influence cognitive function and risk of dementia, although results are conflicting and limited to older co-horts [1–7]. A recent study found that gene variants as-sociated with greater body mass index (BMI) are also related to lower cognitive function [8], supporting the hypothesis that shared biological pathways could in-crease the risk of obesity and cognitive dysfunction. However, whether the association of obesity with cogni-tive outcomes is related to the cumulacogni-tive burden of ex-posure or vulnerability to the effects of rapid changes of whole body or abdominal fat at specific stages of adult-hood remains unclear.
Several factors could account for the association be-tween amount and distribution of body fat and reduced cognitive function. A lifetime exposure to obesity is asso-ciated with the acquisition of an adverse cardiovascular phenotype. Carotid-to-femoral pulse wave velocity (PWV) and common carotid artery intima-media thickness (cIMT) are validated surrogate markers of arterial stiffness and atherosclerotic CVD [9,10], and are known to be af-fected by exposure to whole body and abdominal obesity [11–14]. In turn, increased cIMT and PWV are associated with lower cognitive performance [15–20] and with a higher burden and rate of deposition ofβ-amyloid in the brain [21, 22]. Therefore, an altered vascular phenotype identified by greater cIMT or PWV could contribute to the association between adiposity and cognitive perform-ance, but this has not been studied.
The MRC National Survey of Health and Develop-ment (NSHD, also known as the 1946 British Birth Co-hort) is the oldest of the British Birth Cohort studies [23], and is unique in providing measures of BMI and waist circumference (WC) across the entire life course, together with a characterisation of vascular phenotypes, cardiovascular risk factors and cognitive function at 60–64 years. Using this population, we have previously explored the impact of BMI and its change over time on cognitive function at the age of 53 years [24]. We now extend this work to investigate whether central adiposity has an effect over and above the effect of gen-eral adiposity on cognitive function at 60–64 years of age. We also assess whether rapid changes of BMI or WC over different periods of adult life can have a spe-cific influence on cognitive function at 60–64 years of age. Finally, we explored what proportion, if any, of the association between adult patterns of adiposity and cognitive function could be explained by acquisition of an adverse cardiovascular phenotype.
Methods Population
The MRC NSHD is a nationally representative sample of 5362 singleton births to married parents in England, Scotland and Wales, stratified by social class, during 1 week in March 1946 [25,26]. The cohort has been followed-up 23 times from birth to age 69 years. The present study is based on the 1249 (74%) of 1690 participants who had adi-posity measures, vascular phenotype and cognitive data at 60–64 years with a BMI > 18.5 kg/m2. Further details on the sample invited at the 60–64 years assessment are provided in Additional file1.
Cognitive assessment
Cognitive function was assessed at age 60–64 years using a validated verbal memory test, a letter search speed test and two reaction time tests (simple reaction time, choice reaction time) [24]. Details of each cognitive test are provided in Additional file1.
Adiposity measures
Weight, height and WC were measured during adult-hood at ages 36, 43, 53 and 60–64 years. BMI was calcu-lated as weight (kg) divided by squared height (m2), and was used to define adiposity status according to World Health Organization criteria (BMI 18.5–25 kg/m2 normal weight, 25–29 kg/m2overweight, and≥30 kg/m2 obese) at each age. Similarly, we identified three classes of cardiometabolic risk related to WC, namely (1) low risk = WC ≤94 cm for males and≤80 cm for females; (2) increased risk = WC > 94 cm and≤102 cm for males and > 80 cm and≤88 cm for females; (3) substantially increased risk = WC > 102 cm for males and > 88 cm for females [27]. Participants in the classes defined as increased and substantially increased risk were combined into an elevated WC group.
Vascular phenotypes
At age 60–64 years, PWV and cIMT were measured using validated devices and following standard protocols [28,29], as reported in Additional file1.
Covariates
Statistical analysis
Mean (standard deviation), or median (IQR) for skewed variables, were used to describe continuous variables and percentages for binary variables. We tested for effect modification by sex of obesity indices on cognitive outcomes by introducing relevant inter-action terms (BMI*sex) in multivariable regression models. Level of statistical significance for interaction terms was set at 0.1 and, when a significant inter-action was found, results were stratified by sex. We fitted a series of linear multivariable regression models to establish the associations between (1) BMI at 60–64 years, (2) patterns of overweight/obesity, and (3) conditional change in BMI from 36 to 43, 43 to 53, and 53 to 60–64 with each cognitive outcome and with each vascular phenotype (PWV, cIMT). In each model, inverse probability weighting was imple-mented to account for dropout due to death. The models were sequentially adjusted for covariates: MODEL 1 adjusted for sex, education and childhood cognition; MODEL 2 = MODEL 1 + socioeconomic position at 53 years, systolic blood pressure and heart rate at age 60–64; MODEL 3 (fully adjusted) = MODEL 2 + total cholesterol, smoking, diabetes and levels of physical activity at 60–64 years. In analyses exploring the association between patterns or condi-tional changes of BMI with cognitive outcomes (2 and 3), MODEL 3 was further adjusted for duration of diabetes. We also tested for effect modification by socioeconomic position and education levels of the association between BMI changes and cognitive out-comes. All multivariable regression models of cogni-tive outcomes on cross-sectional measures or longitudinal patterns of BMI were further adjusted for PWV and, separately, cIMT to explore what propor-tion of these associapropor-tions could be explained by car-diovascular phenotype. Each analysis was repeated using WC rather than BMI as the exposure. To assess whether central adiposity had an effect over and above the effect of general adiposity, each cross-sectional and longitudinal analysis was repeated in-cluding BMI and WC in the same models. Further details on the statistical methods are reported in Additional file 1. Statistical analyses were performed using Stata 13.1.
Results
Table 1 reports the characteristics of the total sample used in these analyses (n= 1249) as well as the differ-ences between groups of normal weight, overweight and obese at 60–64 years old. We have previously re-ported that the sample attending the clinical research facility showed some differences in characteristics compared with those not attending [30].
Cross-sectional analysis
Association of BMI and WC with cognitive function at 60–64 years
We did not find any significant effect modification of obesity indices on cognitive outcomes by sex, apart from the letter search speed test. In models adjusted for sex, education and childhood cognition, BMI was positively associated with cIMT (regression coefficient (β) = 0. 003 mm per kg/m2; 95% confidence interval (CI) 0.001 to 0.005;p= 0.01) and PWV (β= 0.040 m/sec per kg/m2; 95% CI 0.012 to 0.068; p= 0.005) (Table 2). The association of BMI with cIMT remained significant in the fully adjusted model, while that with PWV was attenuated in MODEL 2 and further reduced in the final model (Table2). A higher BMI was associated with a lower performance on the verbal memory test (β=
−0.195 number of words per kg/m2; 95% CI –0.274 to −0.116; p< 0.001) and the letter search speed test (β=−0.005 number of targets hit per kg/m2; 95% CI
–0.010 to −0.001; p= 0.018). When stratified by sex, the association between higher BMI and lower letter search speed test performance was stronger in females than in males (Additional file 1: Table S1). These associations remained significant in the fully adjusted models. No associations were observed between BMI and choice reaction time or simple reaction time (Table 2). Additional file 1: Table S2 reports the associations between WC and the vascular and cognitive measures at 60–64 years. WC was associated with vascular phenotypes, verbal memory test performance and, differently from BMI, with choice reaction time, but not with performance in the letter search speed test. When BMI and WC were included in the same model, the associations of both with performance in the verbal memory test and letter search speed test were strongly attenuated, suggesting that the two measures of adiposity provided similar information. In turn, WC remained significantly associated with choice reaction time after adjustment for BMI (β= 6.73; 95% CI 1.32 to 12.1; p= 0.015).
Associations of cardiovascular risk factors/phenotypes with cognitive function at 60–64 years
MODELS 2 and 3 did not affect the association between PWV and verbal memory test. As PWV was associated with both BMI and memory function, we tested whether the association between BMI and verbal memory test per-formance was attenuated by PWV, suggesting that PWV may be a mediator of the association between adiposity and memory performance. However, adjustment for PWV only slightly attenuated the association between BMI and verbal memory test in the fully adjusted model (unadjusted for PWV:β=−0.172 number of words per kg/m2; 95% CI
–0.258 to−0.086 vs. adjusted for PWVβ=−0.170 number of words per kg/m2; 95% CI–0.256 to−0.084; proportional difference inβ= 1.3%).
Longitudinal analysis
Association of patterns of cumulative exposure to overweight or obesity and elevated WC in adulthood with cognitive function
From age 36 to 60–64 years, the prevalence of over-weight/obesity increased from 29% to 69%. Of 1021 participants with vascular phenotypes at 60–64 years and complete BMI records at all ages, 141 (14%) had a reduction in BMI category during 27 years of follow-up; 78 (8%) subsequently regained weight, leav-ing 63 (6%) with stable weight reduction. Earlier on-set of overweight/obesity was associated with a worse cardiometabolic profile and higher PWV and cIMT
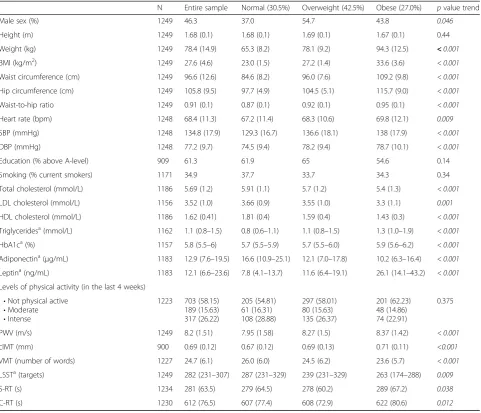
Table 1Participant characteristics by BMI category at the age of 60–64 years
N Entire sample Normal (30.5%) Overweight (42.5%) Obese (27.0%) pvalue trend
Male sex (%) 1249 46.3 37.0 54.7 43.8 0.046
Height (m) 1249 1.68 (0.1) 1.68 (0.1) 1.69 (0.1) 1.67 (0.1) 0.44
Weight (kg) 1249 78.4 (14.9) 65.3 (8.2) 78.1 (9.2) 94.3 (12.5) <0.001
BMI (kg/m2) 1249 27.6 (4.6) 23.0 (1.5) 27.2 (1.4) 33.6 (3.6) < 0.001
Waist circumference (cm) 1249 96.6 (12.6) 84.6 (8.2) 96.0 (7.6) 109.2 (9.8) < 0.001
Hip circumference (cm) 1249 105.8 (9.5) 97.7 (4.9) 104.5 (5.1) 115.7 (9.0) < 0.001
Waist-to-hip ratio 1249 0.91 (0.1) 0.87 (0.1) 0.92 (0.1) 0.95 (0.1) < 0.001
Heart rate (bpm) 1248 68.4 (11.3) 67.2 (11.4) 68.3 (10.6) 69.8 (12.1) 0.009
SBP (mmHg) 1248 134.8 (17.9) 129.3 (16.7) 136.6 (18.1) 138 (17.9) < 0.001
DBP (mmHg) 1248 77.2 (9.7) 74.5 (9.4) 78.2 (9.4) 78.7 (10.1) < 0.001
Education (% above A-level) 909 61.3 61.9 65 54.6 0.14
Smoking (% current smokers) 1171 34.9 37.7 33.7 34.3 0.34
Total cholesterol (mmol/L) 1186 5.69 (1.2) 5.91 (1.1) 5.7 (1.2) 5.4 (1.3) < 0.001
LDL cholesterol (mmol/L) 1156 3.52 (1.0) 3.66 (0.9) 3.55 (1.0) 3.3 (1.1) 0.001
HDL cholesterol (mmol/L) 1186 1.62 (0.41) 1.81 (0.4) 1.59 (0.4) 1.43 (0.3) < 0.001
Triglyceridesa(mmol/L) 1162 1.1 (0.8–1.5) 0.8 (0.6–1.1) 1.1 (0.8–1.5) 1.3 (1.0–1.9) < 0.001
HbA1ca(%) 1157 5.8 (5.5–6) 5.7 (5.5–5.9) 5.7 (5.5–6.0) 5.9 (5.6–6.2) < 0.001
Adiponectina(μg/mL) 1183 12.9 (7.6–19.5) 16.6 (10.9–25.1) 12.1 (7.0–17.8) 10.2 (6.3–16.4) < 0.001
Leptina(ng/mL) 1183 12.1 (6.6–23.6) 7.8 (4.1–13.7) 11.6 (6.4–19.1) 26.1 (14.1–43.2) < 0.001
Levels of physical activity (in the last 4 weeks) •Not physical active
•Moderate •Intense
1223 703 (58.15) 189 (15.63) 317 (26.22)
205 (54.81) 61 (16.31) 108 (28.88)
297 (58.01) 80 (15.63) 135 (26.37)
201 (62.23) 48 (14.86) 74 (22.91)
0.375
PWV (m/s) 1249 8.2 (1.51) 7.95 (1.58) 8.27 (1.5) 8.37 (1.42) < 0.001
cIMT (mm) 900 0.69 (0.12) 0.67 (0.12) 0.69 (0.13) 0.71 (0.11) <0.001
VMT (number of words) 1227 24.7 (6.1) 26.0 (6.0) 24.5 (6.2) 23.6 (5.7) < 0.001
LSSTa(targets) 1249 282 (231–307) 287 (231–329) 239 (231–329) 263 (174–288) 0.009
S-RT (s) 1234 281 (63.5) 279 (64.5) 278 (60.2) 289 (67.2) 0.038
C-RT (s) 1230 612 (76.5) 607 (77.4) 608 (72.9) 622 (80.6) 0.012
Values are presented as mean ± standard deviation, N (%) ora
median (IQR). Comparisons between normal weight, overweight and obese groups were performed by test for trend using linear regression
Numbers in italic indicate statistical significance
SBPsystolic blood pressure,DBPdiastolic blood pressure,cIMTcommon carotid artery intima-media thickness,PWVpulse wave velocity,VMTverbal memory test,
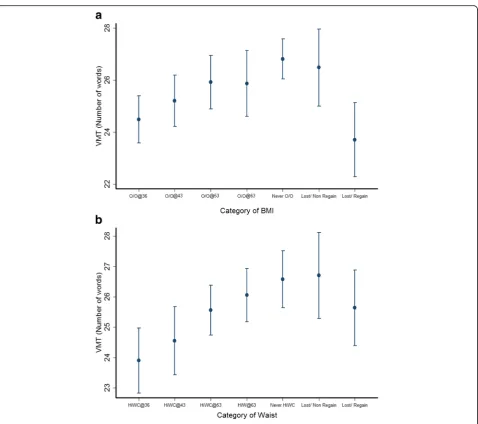
(Additional file 1: Table S4). There was a graded rela-tionship between increasing length of time being over-weight/obese and decreasing verbal memory test performance (β=−0.752 words per category of increasing length of time overweight/obese; 95% CI –1.157 to −0. 346;p for trend < 0.001). Individuals who were classified as overweight/obese at age 36 years recalled 2.3 (95% CI
−3.5 to−1.1) fewer words compared to those who were al-ways normal (Fig.1a). Participants who were able to drop one BMI category and maintain a lower BMI had a similar verbal memory test performance to those who had never been overweight or obese. Conversely, those who dropped one BMI category but who subsequently moved up a
category had a verbal memory test score similar to those with onset of overweight/obesity at 36 years old. There was no association between patterns of overweight/obesity and letter search, simple and choice reaction time tests (Additional file1: Figures S1 and S2).
Full adjustment for cardiovascular risk factors (MODEL 3) only slightly reduced the association be-tween increased duration of overweight/obesity exposure and verbal memory test (β=−0.666 words per category of increasing length of time being overweight/obese; 95% CI –1.119 to −0.213; p for trend = 0.004). Further adjustment of this association by PWV resulted in a 0.9% change in theβcoefficient (β=−0.672 words per category
Table 2Cross-sectional associations of BMI with carotid intima-media thickness and pulse wave velocity with verbal memory, letter search speed, choice and simple reaction test at age 60–64 years
MODEL 1 MODEL 2 MODEL 3
β(95% CI) p β(95% CI) p β(95% CI) p
VASCULAR MEASURES
1. cIMT (mm) 0.003 (0.0003 to 0.005) 0.025 0.002 (−0.0003 to 0.005) 0.085 0.003 (0.0004 to 0.006) 0.024
2. PWV (m/s) 0.040 (0.012 to 0.068) 0.005 0.018 (−0.009 to 0.045) 0. 192 0.014 (−0.015 to 0.043) 0.355
COGNITIVE MEASURES
1. VMT (n. of words) –0.195 (−0.274 to−0.116) < 0.001 −0.178 (−0.255 to−0.098) < 0.001 −0.162 (−0.248 to−0.076) <0.001
2. LSSTa(targets) –0.005 (−0.010 to−0.001) 0.018 −0.005 (−0.010 to−0.001) 0.027 −0.004 (−0.009 to 0.001) 0.117
3. RT (s)
a. Simple 0.485 (−0.373 to 1.344) 0.267 0.552 (−0.324 to 1.428) 0.217 0.689 (−0.300 to 1.679) 0.172
b. Choice 0.910 (−0.222 to 2.042) 0.115 0.983 (−0.157 to 2.123) 0.091 1.014 (−0.292 to 2.320) 0.128
Linear regression models were used to assess associations between variables
MODEL 1 adjusted for sex, education, childhood cognition; MODEL 2 = MODEL 1 + adjustments for socioeconomic position at age 53, systolic blood pressure and heart rate at age 60–64; MODEL 3 (fully adjusted) = MODEL 2 + adjustments for total cholesterol, smoking, diabetes and levels of physical activity. In each model, inverse probability weighting was implemented to account for the probability of survival until the end of follow-up
Numbers in italics indicate statistical significance
cIMTcommon carotid artery intima-media thickness,PWVpulse wave velocity,VMTverbal memory test,LSSTletter search speed test,RTreaction time test
a
Indicates log transformed dependent variables
Table 3Cross-sectional associations of carotid intima-media thickness and pulse wave velocity with verbal memory test, letter search speed and reaction time at 60–64 years
VMT (n. of words) LSSTa(targets) S-RT (s) C-RT (s)
β(95% CI) p β(95% CI) p β(95% CI) p β(95% CI) p
PWV Model 1 −0.355 (−0.616 to−0.095) 0.008 0.004 (−0.018 to 0.026) 0.701 −0.958 (−3.676 to 1.760) 0.489 −1.871 (−5.485 to 1.741) 0.309
Model 2 −0.297 (−0.578 to−0.015) 0.039 0.006 (−0.020 to 0.032) 0.629 −0.344 (−3.402 to 2.714) 0.825 −1.357 (−5.270 to 2.557) 0.496
Model 3 −0.166 (0.461 to 0.129) 0.270 0.007 (−0.022 to 0.036) 0.634 −0.029 (−3.417 to 3.359) 0.987 −1.148 (−5.710 to 2.749) 0.492 cIMT Model 1 0.220 (−3.470 to 3.912) 0.906 −0.036 (−0.218 to 0.145) 0.695 6.819 (−27.267 to 40.906) 0.694 16.606 (−32.294 to 65.507) 0.505 Model 2 0.487 (−3.162 to 4.136) 0.793 −0.049 (−0.235 to 0.138) 0.607 10.673 (−24.072 to 45.418) 0.546 21.282 (−27.069 to 69.635) 0.388 Model 3 1.287 (−2.340 to 4.913) 0.486 −0.015 (−0.222 to 0.192) 0.888 12.470 (−24.800 to 49.740) 0.511 25.184 (−25.895 to 76.264) 0.333 Linear regression models were used to assess associations between variables
cIMTcommon carotid artery intima-media thickness,PWVpulse wave velocity,VMTverbal memory test,LSSTletter search speed test,C-RTchoice reaction time test,S-RTsimple reaction time test
MODEL 1 adjusted for sex, education and childhood cognition; MODEL 2 = MODEL 1 + adjustments for socioeconomic position at age 53, systolic blood pressure and heart rate at age 60–64; MODEL 3 (fully adjusted) = MODEL 2 + adjustments for total cholesterol, smoking, diabetes and levels of physical activity. In each model, inverse probability weighting was implemented to account for the probability of survival until the end of follow-up
a
of increasing length of time being overweight/obese; 95% CI –1.125 to −0.220; p for trend = 0.0037), and a 6.9% change of the βcoefficient was observed when the same association was adjusted for cIMT (β=−0.620 words per category of increasing length of time being overweight/ obese; 95% CI –1.176 to −0.063; p for trend = 0.029).
When added to the model, the interaction between medi-cation use and overweight/obese groups was not signifi-cant, and exclusion of participants with previous CVD history did not substantially affect results.
Analyses were repeated using patterns of WC in place of BMI. Similar to findings for BMI, longer exposure to
Fig. 1aPatterns of overweight/obesity change and performance in the verbal memory test (VMT) at age 60–64 years. Data points represent mean number of words recalled and vertical bars indicate 95% CI for each group. O/O@36, O/O@43, O/O@53 and O/O@60–64 = Overweight/ obesity since 36, 43, 53 and 60–64 years old, respectively; Never O/O = never overweight/obese; Lost/Non-regain = dropped and did not regain one category of BMI; Lost/Regain = dropped and regained one category of BMI. VMT = Verbal memory test. Results are adjusted for sex, childhood cognition and education, and inverse probability weighting was implemented to account for dropout due to death. Test for trend for O/O@36 to O/O@60–64:p< 0.0001. Pairwise comparison of Never O/O versus Lost/Non-regain (p= 0.9) and Lost/Regained (p= 0.002). Pairwise comparison of O/O@36 versus Lost/Non-regain (p= 0.007) and Lost/Regain (p= 0.9). Adjustment for cardiovascular risk factors, PWV and cIMT did not affect these differences.bPatterns of waist circumference (WC) change and performance in the verbal memory test (VMT) at age
elevated WC was associated with a worse cardiometa-bolic profile and higher PWV and cIMT (Additional file
1: Table S5). Greater length of time with elevated WC was associated with decreases in verbal memory test score, so that those with elevated WC from age 36 years had the lowest mean scores (β=−0.980 words per category of increasing length of exposure to elevated WC; 95% CI –1.424 to −0.536; p for trend < 0.001) (Fig. 1b); this association remained in the fully adjusted model (β=−1.051; 95% CIs −1.532 to
−0.571, p for trend < 0.001). Individuals who were able to drop and not regain one category of WC had a similar memory performance as the group who al-ways had a normal WC. Further adjustment of MODEL 3 for PWV resulted in a 0.8% decrease in the regression coefficient (β=−1.043 words per cat-egory of increasing length of exposure to elevated WC; 95% CIs −1.529 to −0.556; p for trend < 0.001) and a 13.8% decrease was observed when the same association was adjusted for cIMT (β=−0.906 words per category of increasing length of exposure to elevated WC; 95% CI –1.508 to −0.304; p for trend = 0.003). No clear trends were observed for the associations between categories of WC and letter search speed or simple reac-tion time tests (Addireac-tional file1: Figures S3 and S4A). For choice reaction time, participants with high WC at 53 years and before had slower times than those with raised WC at 60–64 and those never having had a raised WC (β= 14.115 words per category of increasing length of exposure to elevated WC; 95% CI 6.453 to 21.776;p for trend = 0.003) (Additional file1: Figure S4B).
When both BMI and WC were included in the same fully adjusted model, the linear trend across categories of exposure to elevated WC for verbal memory test (β =−0.871 per change in WC category; 95% CI−1.720 to
−0.024, p for trend = 0.044) and choice reaction time test (β= 14.087 per change in WC category; 95% CI 3. 300 to 24.873; pfor trend = 0.011) remained significant, while the association between categories of BMI and ver-bal memory test score was considerably reduced and no longer significant (β=−0.257 per change in BMI cat-egory; 95% CI –0.979 to 0.465, p= 0.485).
Association of BMI and WC gains in adulthood with cognitive function
A faster increase in BMI between 53 to 60–64 years was related to lower verbal memory test score at age 60–64 (Additional file 1: Figure S5A), but this association was attenuated in MODELS 2 and 3 (Table 4). A greater BMI increase between 36 and 43 years was related to lower log (letter search speed) at age 60–64 (Additional file 1: Figure S5B). This association remained highly sig-nificant in the fully adjusted model (Table 4), and was stronger in females than in males (Additional file1: Table
S8 and Figure S6S). Evidence of effect modification by so-cial class was observed for the association between BMI change from 36 to 43 years and choice reaction time, such that this association was stronger in those from more advantaged social classes (Additional file1: Table S9).
A greater increase in WC between 36 and 43 years was associated with poorer performance in all cognitive tests at 60–64 years (Fig. 2a–d). The progressive adjust-ments from MODEL 1 to MODEL 3 minimally attenu-ated the strength of these associations (Table 5). As for BMI, a faster increase in WC between 53 to 60–64 years was related to lower verbal memory test score at age 60–64, but this association was attenuated in MODEL 3 (Table 5). There was no evidence of effect modification by socioeconomic position or education level of the as-sociation between WC increase and cognitive outcomes.
When changes of BMI and WC were included in the same fully adjusted model, faster WC gain between 36 and 43 years remained significantly associated with choice reaction time (β= 8.664; 95% CI 2.054 to 15.275; p= 0.010), and a weaker association was observed with verbal memory test performance (β=−0.530; 95% CI–1. 116 to 0.050;p= 0.070). In contrast, the association be-tween gain of WC at 36–43 years with letter search speed as well as between gain of BMI at 36–43 and letter search speed became non-significant.
Discussion
This study shows that different patterns of whole body and abdominal obesity are associated with cognitive function at 60–64 years. Cumulative exposure to ele-vated BMI and WC over 30 years was related to poorer memory function at 60–64 years. We identified a sensi-tive period in early adulthood when a faster gain of BMI and WC might have a greater impact on cognitive capacities in late midlife compared to weight gain in other periods, and show that patterns of cumulative ex-posure or rapid changes in WC remain associated with cognition even after adjustment for BMI. Finally, we found that the relationships between patterns of adi-posity and cognitive function were not explained by CVD risk factors and vascular phenotypes. The process of neurodegeneration leading to cognitive decline and dementia is complex and likely to result from the inter-action of multiple factors. Our findings support the adoption of early interventions based on the prevention of central and whole body obesity as possible measures to reduce the burden of cognitive decline in the general population.
influence of adult patterns of BMI on cognition. Using data from the NSHD cohort, Albanese et al. [24] docu-mented that weight gain during specific periods of life is associated with cognitive capacities at 53 years, although this association was attenuated by socioeconomic pos-ition and childhood cognitive capacities. Because our analyses use cognitive function and adiposity measures from a later assessment, comparisons are difficult to make. Albanese et al. [24] also reported results stratified by sex, as significant sex × BMI interactions were identi-fied. In our sample, we found no evidence of effect modification by sex. Our results are broadly consistent with those obtained in the Whitehall II study by Sabia et al. [7], where a dose–response relationship was identified between longer exposure to obesity and lower cognitive function at 60 years old. Similarly, we also provide infor-mation on the importance of patterns of WC in addition to BMI for cognition, as well as on the different impact of rapid weight gain at different age of adult life on later cognition. Previous studies exploring the relationship be-tween indices of central adiposity and cognitive function are based on samples of older adults (65+) [6, 33], were cross-sectional [2,34–36] or had small sample sizes [37]. We are the first to report the influence of cumulative ex-posure to elevated WC and of rapid changes of WC dur-ing adulthood on different cognitive outcomes, and to
show that patterns of WC in adulthood could provide additional information in predicting late midlife cogni-tive functions than patterns of BMI.
In cross-sectional and longitudinal analyses, adjust-ment for PWV or cIMT had little effect on the rela-tionship between adult patterns of BMI or WC and verbal memory test performance. The influence of cardiovascular factors on the association between whole body and abdominal obesity with cognitive function has been previously explored, albeit with conflicting results [2, 38, 39]. In these studies, cardio-vascular risk factors were measured only at a single point, and no measures of subclinical CVD were available. As cIMT and PWV are recognised markers of end-organ damage and reflect the lifetime burden of cardiovascular risk factor exposure, the minimal attenu-ation of the associattenu-ation between patterns of WC and BMI with memory function after adjustment for PWV and cIMT suggests that obesity and vascular factors might affect cognitive function by different mechanisms and should be treated early and concomitantly to reduce the risk of cognitive impairment. This is supported by results of recent clinical trials, wherein multidomain interven-tions have been indicated as those likely to represent the most effective strategies to improve cognitive function in overweight populations [40].
Table 4Relationship between cognitive tests at age 60–64 years and residual changes in BMI between three time periods: BMI36–43= 36–43 years, BMI43–53= 43–53 years, and BMI53–60 to 64= 53–60 to 64 years
MODEL 1 MODEL 2 MODEL 3
β(95% CI) p β(95% CI) p β(95% CI) p
VMT
BMI36–43 −0.216 (−0.629 to 0.198) 0.306 −0.161 (−0.553 to 0.231) 0.421 −0.199 (−0.632 to 0.234) 0.367
BMI43–53 0.065 (−0.390 to 0.520) 0.780 0.068 (−0.378 to 0.514) 0.763 0.098 (−0.393 to 0.590) 0.694
BMI53–60 to 64 −0.524 (−0.923 to−0.124) 0.010 −0.515 (−0.915 to−0.115) 0.012 −0.380 (−0.839 to 0.078) 0.104
LSSTa
BMI36–43 −0.023 (−0.044 to−0.002) 0.029 −0.022 (−0.044 to−0.002) 0.035 −0.024 (−0.047 to−0.002) 0.034
BMI43–53 −0.012 (−0.033 to 0.010) 0.280 −0.011 (−0.033 to 0.010) 0.305 −0.008 (−0.031 to 0.014) 0.462
BMI53–60 to 64 0.005 (−0.019 to 0.030) 0.680 0.005 (−0.020 to 0.029) 0.704 0.013 (−0.016 to 0.043) 0.367
S-RT
BMI36–43 2.116 (−1.973 to 6.206) 0.310 2.205 (−1.903 to 6.312) 0.290 3.701 (−0.836 to 8.238) 0.110
BMI43–53 1.638 (−2.437 to 5.714) 0.430 1.775 (−2.377 to 5.928) 0.402 2.387 (−2.079 to 6.853) 0.294
BMI53–60 to 64 0.698 (−3.119 to 4.514) 0.720 1.142 (−2.672 to 4.955) 0.557 1.859 (−2.514 to 6.233) 0.404
C-RT
BMI36–43 −1.610 (−7.038 to 3.818) 0.561 −1.433 (−6.968 to 4.101) 0.611 −0.798 (−6.749 to 5.152) 0.792
BMI43–53 2.581 (−3.305 to 8.468) 0.389 3.145 (−2.879 to 9.170) 0.306 3.021 (−3.570 to 9.612) 0.368
BMI53–60 to 64 2.146 (−3.157 to 7.449) 0.427 2.716 (−2.537 to 7.969) 0.310 4.230 (−1.835 to 10.295) 0.171
Linear regression models were used to assess associations between variables. Significant associations (p< 0.05) are highlighted in bold
a
Indicates log transformed dependent variables. MODEL 1 adjusted for sex, education and childhood cognition; MODEL 2 = MODEL 1 + adjustments for socioeconomic position at age 53, systolic blood pressure and heart rate at age 60–64; MODEL 3 (fully adjusted) = MODEL 2 + adjustments for total cholesterol, smoking, diabetes, diabetes duration and levels of physical activity. In each model, inverse probability weighting was implemented to account for dropout due to death
Our study has several strengths. The NSHD is the longest-running longitudinal study in the UK, with mul-tiple measures of height, weight and WC available at dif-ferent ages. It includes individuals without cognitive impairment and is generally representative of the British-born population of similar age. The availability of multiple vascular and cognitive measures enabled ex-ploration of the association between different vascular phenotypes and a wide range of cognitive domains in late mid-life, with appropriate adjustment for environ-mental and behavioural factors.
Nevertheless, the study also has limitations. First, we examined associations in an observational study and therefore cannot reliably assign causality. Second, the outcome of our analysis was cognitive function and more studies are necessary to test the relevance of our findings against the risk of dementia. Third, attrition is unavoidable in long-running studies such as NSHD, but previous analyses have shown that the samples at 53 and
60–64 years remained broadly representative of the British-born population of that age. Finally, the results in relation to the groups who achieve a stable weight re-duction should be interpreted with caution, as only a limited number of participants had sustained weight loss/re-gain during follow-up.
Conclusion
Increasing cumulative exposure to elevated BMI and WC in adulthood is associated with lower memory function at 60–64 years, and a rapid gain of WC across the third and fourth decades is associated with a global reduction of cognitive capacities in later life. Cardiovascular risk factors and vascular phenotypes are unlikely to account for these associations. Our findings suggest that lifelong prevention of whole body and abdominal obesity, particularly in early midlife, might represent the most effective strategy to prevent the burden of cognitive decline attributable to obesity in the general population.
Additional file
Additional file 1:Additional Methods and Results (including additional Tables and Figures). (DOC 688 kb)
Abbreviations
BMI:Body Mass Index; CVD: Cardiovascular Disease; cIMT: common carotid artery Intima-Media Thickness; C-RT: Choice Reaction Time Test; LSST: Letter Search Speed Test; MRC: Medical Research Council; NSHD: National Survey of Health and Development; PWV: Pulse Wave Velocity; S-RT: Simple Reaction Time Test; VMT: Verbal Memory Test; WC: Waist Circumference
Acknowledgements
The authors are grateful to National Survey of Health and Development (NSHD) participants who took part in this latest data collection for their continuing support. We thank members of the NSHD scientific and data collection team at the following centres: MRC Unit for Lifelong Health and Ageing; MRC Lifecourse Epidemiology Unit, University of Southampton; MRC Human Nutrition Research, Cambridge; Wellcome Trust (WT) Clinical Research Facility (CRF) Manchester and the Department of Clinical Radiology at the Central Manchester University Hospitals NHS Foundation Trust; WT CRF and Medical Physics at the Western General Hospital in Edinburgh; WT CRF and the Department of Nuclear Medicine at University Hospital Birmingham; WT CRF and the Department of Nuclear Medicine at University College London Hospital; the CRF and the Department of Medical Physics at the University Hospital of Wales; the CRF and Twin Research Unit at St Thomas’Hospital London.
Funding
The UK Medical Research Council provides core funding for the MRC National Survey of Health and Development and supports RH and MR (grant numbers MC_UU_12019/1, MC_UU_12019/2 and MC_UU_12019/3). WJ is supported by a UK Medical Research Council (MRC) New Investigator Research Grant (MR/P023347/1), and acknowledges support from the National Institute for Health Research (NIHR) Leicester Biomedical Research Centre, which is a partnership between University Hospitals of Leicester NHS Trust, Loughborough University, and the University of Leicester. JD and SM are supported by the British Heart Foundation.
Availability of data and materials
NSHD data are made available to bona fide researchers who submit data requests to mrclha.swiftinfo@ucl.ac.uk; see also the full policy documents at
http://www.nshd.mrc.ac.uk/data.aspx.https://doi.org/10.5522/NSHD/Q101;
https://doi.org/10.5522/NSHD/Q102;https://doi.org/10.5522/NSHD/S102A.
Authors’contributions
SM, JD and RH planned the study. PW, MR, RH, JD, AH and AW collected data. SM, GG, WJ and TK analysed the data. SM wrote the manuscript. JD, RH, MR, AH, PW, AW, WJ, MC and GG reviewed/edited the manuscript. SM, MR, JD, RH and AH contributed to the discussion and reviewed/edited the manuscript. All authors read and approved the final manuscript.
Ethics approval and consent to participate
All participants provided written informed consent, and the study received ethical approval from the Central Manchester Research Ethics Committee (07/H1008/245) and the Scottish A Research Ethics Committee (08/MRE00/12).
Table 5Relationship between cognitive tests at age 60–64 years and residual changes in waist circumference between three time periods: Waist36–43= 36–43 years, Waist43–53= 43–53 years, and Waist53–60 to 64= 53–60 to 64 years
MODEL 1 MODEL 2 MODEL 3
β(95% CI) P β(95% CI) P β(95% CI) P
VMT
WC36–43 −0.500 (−0.930 to−0.071) 0.022 −0.447 (−0.875,−0.019) 0.041 −0.501 (−0.972 to−0.030) 0.037
WC43–53 −0.160 (−0.562 to 0.241) 0.434 −0.127 (−0.525 to 0.270) 0.530 −0.090 (−0.511 to 0.330) 0.672
WC53–60 to 64 −0.488 (−0.863 to−0.113) 0.011 −0.444 (−0.822 to−0.067) 0.021 −0.358 (−0.766 to 0.049) 0.085
LSSTa
WC36–43 −0.026 (−0.051 to−0.002) 0.035 −0.025 (−0.050,−0.001) 0.045 −0.027 (−0.055 to 0.001) 0.058
WC43–53 −0.001 (−0.026 to 0.024) 0.932 0.0003 (−0.025 to 0.025) 0.983 0.001 (−0.026 to 0.029) 0.916
WC53–60 to 64 0.012 (−0.016 to 0.040) 0.395 0.013 (−0.015 to 0.041) 0.372 0.018 (−0.014 to 0.051) 0.273
S-RT
WC36–43 4.011 (0.420 to 7.602) 0.029 4.140 (0.473 to 7.806) 0.027 4.435 (0.386 to 8.486) 0.032
WC43–53 1.604 (−2.445 to 5.654) 0.437 1.718 (−2.408 to 5.844) 0.414 2.466 (−2.002 to 6.936) 0.279
WC53–60 to 64 1.453 (−2.357 to 5.263) 0.454 1.753 (−2.125 to 5.631) 0.375 2.196 (−2.120 to 6.512) 0.318
C-RT
WC36–43 5.471 (.356 to 10.588) 0.036 0.787 (0.599 to 10.976) 0.029 60.086 (0.389 to 11.783) 0.036
WC43–53 5.024 (−0.390 to 10.439) 0.069 5.530 (0.095 to 10.965) 0.046 50.251 (−0.752 to 11.254) 0.086
WC53–60 to 64 1.670 (−3.389 to 6.728) 0.517 1.940 (−3.090 to 6.971) 0.449 30.589 (−1.963 to 9.141) 0.205
Linear regression models were used to assess associations between variables
VMTverbal memory test,LSSTletter search speed test,C-RTchoice reaction time test,S-RTsimple reaction time test Significant associations (p< 0.05) are highlighted in bold
a
Indicates log transformed dependent variables
MODEL 1 adjusted for sex, education and childhood cognition; MODEL 2 = MODEL 1 + adjustments for socioeconomic position at age 53, systolic blood pressure and heart rate at age 60–64; MODEL 3 (fully adjusted) = MODEL 2 + adjustments for total cholesterol, smoking, diabetes, diabetes duration and levels of physical activity. In each model, inverse probability weighting was implemented to account for dropout due to death
Consent for publication
This manuscript does not contain details, images, or videos relating to an individual person, and thus does not require written informed consent for the publication of these details.
Competing interests
The authors declare that they have no competing interests.
Publisher’s Note
Springer Nature remains neutral with regard to jurisdictional claims in published maps and institutional affiliations.
Author details
1National Centre for Cardiovascular Prevention and Outcomes, Institute of
Cardiovascular Science, University College London, 1 St Martin le Grande, London EC1A 4NP, UK.2Department of Clinical and Experimental Medicine, University of Pisa, Pisa, Italy.3First Department of Cardiology|, Hippokration Hospital, University of Athens, Athens, Greece.4School of Sport, Exercise and Health Sciences, Loughborough University, Loughborough, Leicestershire, UK. 5
MRC Unit for Lifelong Health and Ageing at UCL, Institute of Epidemiology and Health Care, UCL, London, UK.6Division of Population Health Sciences and Education, St George’s University of London, London, UK.
7Cardiometabolic Phenotyping Group, Institute of Cardiovascular Science,
UCL, London, UK.
Received: 16 December 2017 Accepted: 23 April 2018
References
1. Beydoun MA, Beydoun HA, Wang Y. Obesity and central obesity as risk factors for incident dementia and its subtypes: a systematic review and meta-analysis. Obesity reviews: an official journal of the International Association for the Study of Obesity. 2008;9(3):204–18.
2. Dore GA, Elias MF, Robbins MA, Budge MM, Elias PK. Relation between central adiposity and cognitive function in the Maine-Syracuse Study: attenuation by physical activity. Ann Behav Med. 2008;35(3):341–50. 3. Gustafson D, Rothenberg E, Blennow K, Steen B, Skoog I. An 18-year
follow-up of overweight and risk of Alzheimer disease. Arch Intern Med. 2003; 163(13):1524–8.
4. Gustafson DR, Backman K, Waern M, Ostling S, Guo X, Zandi P, Mielke MM, Bengtsson C, Skoog I. Adiposity indicators and dementia over 32 years in Sweden. Neurology. 2009;73(19):1559–66.
5. Qizilbash N, Gregson J, Johnson ME, Pearce N, Douglas I, Wing K, Evans SJ, Pocock SJ. BMI and risk of dementia in two million people over two decades: a retrospective cohort study. Lancet Diabetes Endocrinol. 2015;3(6):431–6. 6. Rodriguez-Fernandez JM, Danies E, Martinez-Ortega J, Chen WC. Cognitive
decline, body mass index, and waist circumference in community-dwelling elderly participants. J Geriatr Psychiatry Neurol. 2017;30(2):67–76. 7. Sabia S, Kivimaki M, Shipley MJ, Marmot MG, Singh-Manoux A. Body mass
index over the adult life course and cognition in late midlife: the Whitehall II Cohort Study. Am J Clin Nutr. 2009;89(2):601–7.
8. Marioni RE, Yang J, Dykiert D, Mottus R, Campbell A, Group CCW, Davies G, Hayward C, Porteous DJ, Visscher PM, et al. Assessing the genetic overlap between BMI and cognitive function. Mol Psychiatry. 2016;21(10):1477–82. 9. Laurent S, Cockcroft J, Van Bortel L, Boutouyrie P, Giannattasio C, Hayoz D,
Pannier B, Vlachopoulos C, Wilkinson I, Struijker-Boudier H, et al. Expert consensus document on arterial stiffness: methodological issues and clinical applications. Eur Heart J. 2006;27(21):2588–605.
10. O'Leary DH, Bots ML. Imaging of atherosclerosis: carotid intima-media thickness. Eur Heart J. 2010;31(14):1682–9.
11. Charakida M, Khan T, Johnson W, Finer N, Woodside J, Whincup PH, Sattar N, Kuh D, Hardy R, Deanfield J. Lifelong patterns of BMI and cardiovascular phenotype in individuals aged 60-64 years in the 1946 British birth cohort study: an epidemiological study. Lancet Diabetes Endocrinol. 2014;2(8):648–54. 12. Safar ME, Czernichow S, Blacher J. Obesity, arterial stiffness, and
cardiovascular risk. J Am Soc Nephrol. 2006;17(4 Suppl 2):S109–11. 13. Recio-Rodriguez JI, Gomez-Marcos MA, Patino-Alonso MC, Agudo-Conde C,
Rodriguez-Sanchez E, Garcia-Ortiz L. Vasorisk g: Abdominal obesity vs general obesity for identifying arterial stiffness, subclinical atherosclerosis and wave reflection in healthy, diabetics and hypertensive. BMC Cardiovasc Disord. 2012;12:3.
14. Zebekakis PE, Nawrot T, Thijs L, Balkestein EJ, van der Heijden-Spek J, Van Bortel LM, Struijker-Boudier HA, Safar ME, Staessen JA. Obesity is associated with increased arterial stiffness from adolescence until old age. J Hypertens. 2005;23(10):1839–46.
15. Buratti L, Balucani C, Viticchi G, Falsetti L, Altamura C, Avitabile E, Provinciali L, Vernieri F, Silvestrini M. Cognitive deterioration in bilateral asymptomatic severe carotid stenosis. Stroke. 2014;45(7):2072–7.
16. Frazier DT, Seider T, Bettcher BM, Mack WJ, Jastrzab L, Chao L, Weiner MW, DeCarli C, Reed BR, Mungas D, et al. The role of carotid intima-media thickness in predicting longitudinal cognitive function in an older adult cohort. Cerebrovasc Dis. 2014;38(6):441–7.
17. Masley SC, Masley LV, Gualtieri CT. Cardiovascular biomarkers and carotid IMT scores as predictors of cognitive function. J Am Coll Nutr. 2014;33(1):63–9. 18. Mitchell GF, van Buchem MA, Sigurdsson S, Gotal JD, Jonsdottir MK,
Kjartansson O, Garcia M, Aspelund T, Harris TB, Gudnason V, et al. Arterial stiffness, pressure and flow pulsatility and brain structure and function: the Age, Gene/Environment Susceptibility–Reykjavik study. Brain. 2011;134(Pt 11):3398–407.
19. Rogne SO, Solbu MD, Arntzen KA, Herder M, Mathiesen EB, Schirmer H. Albuminuria and carotid atherosclerosis as predictors of cognitive function in a general population. Eur Neurol. 2013;70(5–6):340–8.
20. Scuteri A, Wang H. Pulse wave velocity as a marker of cognitive impairment in the elderly. J Alzheimers Dis. 2014;42(Suppl 4):S401–10.
21. Hughes TM, Kuller LH, Barinas-Mitchell EJ, Mackey RH, McDade EM, Klunk WE, Aizenstein HJ, Cohen AD, Snitz BE, Mathis CA, et al. Pulse wave velocity is associated with beta-amyloid deposition in the brains of very elderly adults. Neurology. 2013;81(19):1711–8.
22. Hughes TM, Kuller LH, Barinas-Mitchell EJ, McDade EM, Klunk WE, Cohen AD, Mathis CA, Dekosky ST, Price JC, Lopez OL. Arterial stiffness and beta-amyloid progression in nondemented elderly adults. JAMA Neurol. 2014;71(5):562–8. 23. Shetty P. Celebrating 65 years of the NSHD cohort. Lancet. 2011;377(9768):802. 24. Albanese E, Hardy R, Wills A, Kuh D, Guralnik J, Richards M. No association
between gain in body mass index across the life course and midlife cognitive function and cognitive reserve–the 1946 British Birth Cohort study. Alzheimers Dement. 2012;8(6):470–82.
25. Kuh D, Pierce M, Adams J, Deanfield J, Ekelund U, Friberg P, Ghosh AK, Harwood N, Hughes A, Macfarlane PW, et al. Cohort profile: updating the cohort profile for the MRC National Survey of Health and Development: a new clinic-based data collection for ageing research. Int J Epidemiol. 2011;40(1):e1–9.
26. Wadsworth M, Kuh D, Richards M, Hardy R. Cohort Profile: The 1946 National Birth Cohort (MRC National Survey of Health and Development). Int J Epidemiol. 2006;35(1):49–54.
27. Department of Nutrition for Health and Development WHO: Waist Circumference and Waist–Hip Ratio: Report of a WHO Expert Consultation. Geneva: World Health Organization 2008.http://apps.who.int/iris/bitstream/ handle/10665/44583/9789241501491_eng.pdf?sequence=1.
28. Stein JH, Korcarz CE, Hurst RT, Lonn E, Kendall CB, Mohler ER, Najjar SS, Rembold CM, Post WS, American Society of Echocardiography Carotid Intima-Media Thickness Task Force. Use of carotid ultrasound to identify subclinical vascular disease and evaluate cardiovascular disease risk: a consensus statement from the American Society of Echocardiography Carotid Intima-Media Thickness Task Force. Endorsed by the Society for Vascular Medicine. J Am Soc Echocardiogr. 2008;21(2):93–111. quiz 189–190 29. Weber T, Ammer M, Rammer M, Adji A, O'Rourke MF, Wassertheurer S,
Rosenkranz S, Eber B. Noninvasive determination of carotid-femoral pulse wave velocity depends critically on assessment of travel distance: a comparison with invasive measurement. J Hypertens. 2009;27(8):1624–30. 30. Stafford M, Black S, Shah I, Hardy R, Pierce M, Richards M, Wong A, Kuh D. Using
a birth cohort to study ageing: representativeness and response rates in the National Survey of Health and Development. Eur J Ageing. 2013;10(2):145–57. 31. Fitzpatrick AL, Kuller LH, Lopez OL, Diehr P, O'Meara ES, Longstreth WT Jr,
Luchsinger JA. Midlife and late-life obesity and the risk of dementia: cardiovascular health study. Arch Neurol. 2009;66(3):336–42. 32. Kivipelto M, Ngandu T, Fratiglioni L, Viitanen M, Kareholt I, Winblad B,
Helkala EL, Tuomilehto J, Soininen H, Nissinen A. Obesity and vascular risk factors at midlife and the risk of dementia and Alzheimer disease. Arch Neurol. 2005;62(10):1556–60.
34. Jagust W, Harvey D, Mungas D, Haan M. Central obesity and the aging brain. Arch Neurol. 2005;62(10):1545–8.
35. Kerwin DR, Zhang Y, Kotchen JM, Espeland MA, Van Horn L, McTigue KM, Robinson JG, Powell L, Kooperberg C, Coker LH, et al. The cross-sectional relationship between body mass index, waist-hip ratio, and cognitive performance in postmenopausal women enrolled in the Women's Health Initiative. J Am Geriatr Soc. 2010;58(8):1427–32.
36. Nourhashemi F, Andrieu S, Gillette-Guyonnet S, Reynish E, Albarede JL, Grandjean H, Vellas B. Is there a relationship between fat-free soft tissue mass and low cognitive function? Results from a study of 7,105 women. J Am Geriatr Soc. 2002;50(11):1796–801.
37. Yoon DH, Choi SH, Yu JH, Ha JH, Ryu SH, Park DH. The relationship between visceral adiposity and cognitive performance in older adults. Age Ageing. 2012;41(4):456–61.
38. Cournot M, Marquie JC, Ansiau D, Martinaud C, Fonds H, Ferrieres J, Ruidavets JB. Relation between body mass index and cognitive function in healthy middle-aged men and women. Neurology. 2006;67(7):1208–14. 39. Wolf PA, Beiser A, Elias MF, Au R, Vasan RS, Seshadri S. Relation of obesity to
cognitive function: importance of central obesity and synergistic influence of concomitant hypertension. The Framingham Heart Study. Curr Alzheimer Res. 2007;4(2):111–6.