The University of San Francisco
USF Scholarship: a digital repository @ Gleeson Library |
Geschke Center
Master's Projects and Capstones Theses, Dissertations, Capstones and Projects
Spring 5-16-2014
Utility Right of Way Management: Potential for
Expanded Integrated Vegetation Managment in
California
Kayla Paschal
University of San Francisco, kmpaschal@dons.usfca.edu
Follow this and additional works at:https://repository.usfca.edu/capstone Part of theNatural Resources Management and Policy Commons
This Project/Capstone is brought to you for free and open access by the Theses, Dissertations, Capstones and Projects at USF Scholarship: a digital repository @ Gleeson Library | Geschke Center. It has been accepted for inclusion in Master's Projects and Capstones by an authorized administrator of USF Scholarship: a digital repository @ Gleeson Library | Geschke Center. For more information, please contactrepository@usfca.edu. Recommended Citation
Paschal, Kayla, "Utility Right of Way Management: Potential for Expanded Integrated Vegetation Managment in California" (2014).
Master's Projects and Capstones. 21.
Utility Right of Way Management:
Potential for Expanded Integrated Vegetation Management in California
Kayla Paschal MSEM Program Master’s Project
Table of Contents:
Abstract Acronyms Introduction Overview
Chapter 1. Utility Right of Ways and Vegetation Management 1.1 Transmission and Distribution Systems
1.2 Need for Vegetation Management in Utility Right of Ways 1.3 History of Vegetation Management
1.4 Issues Arising from Insufficient Right of Way Management 1.4.1 2003 Blackout
1.4.2 Fires in California
Chapter 2. Vegetation Management Regulation 2.1 Regulatory Agencies
2.2 Regulatory Requirements and Statutes 2.3 ANSI Standards
2.4 Penalties and Non-Compliance
Chapter 3. Vegetation Management in California 3.1 Annual Cost and Budget Information 3.2 Reliability Indexes and Scores 3.2.1 PG&E
3.2.2 Southern California Edison 3.2.3 San Diego Gas and Electric Chapter 4. Examples of IVM
4.1 Nation Grid HCP for Operations and Maintenance Activities Chapter 5. Methodology
Chapter 6. Potential Benefits of Improved IVM in California 6.1 Focus Areas
6.2 HCP Connection
6.3 Improved Compliance and Access to Facilities 6.4 Cost Information
Abstract:
Utility companies have the challenge of meeting vegetation clearance requirements
within their right of ways and complying with various environmental laws and company goals.
Vegetation management programs at the major utility companies cost millions of dollars a year.
Reducing cost and increasing compliance are goals of right of way managers at utilities across
the country. This paper looks at the possibility of increasing the utilization of integrated
vegetation management on California’s utility right of ways. This paper will examine the current
vegetation management strategy of California’s major utility companies and determine whether a
more comprehensive integrated vegetation management program could be adopted. Examples of
the utilization of integrated vegetation management and research at other utilities were examined
for reference. The research found that a comprehensive integrated vegetation management
program can reduce costs and increase compliance for California’s utilities. In addition,
integrated vegetation management programs can offer unique opportunities to meet company
environmental goals and obligations. These findings lead to several policy recommendations for
California utility companies and regulators.
Acronyms:
FERC: Federal Energy Regulatory Commission
NERC: North American Electrical Reliability Corporation CPUC: California Public Utilities Commission
EEI: Edison Electrical Institute ESA: Endangered Species Act
PG&E: Pacific Gas and Electric Company SDG&E: San Diego Gas and Electric SCE: Southern California Edison
ANSI: American National Standards Institute EPA: Environmental Protection Agency HCP: Habitat Conservation Plan
IVM: Integrated Vegetation Management
TVMP: Transmission Vegetation Management Plan CEQA: California Environmental Quality Act USFWS: United States Fish and Wildlife Service ROW: Right of Way
kV: kilovolt
HOA: Homeowner’s Association CEC: California Energy Commission PRC: Public Resource Code
GO: General Order
SAIFI: System Average Interruption Frequency SAIDI: System Average Interruption Duration
MAIFI: Momentary Average Interruption Frequency Index KBB: Karner Blue Butterfly
ITP: Incidental Take Permit
NYSDEC: New York State Department of Environmental Conservation GRI: Global Reporting Initiative
Introduction:
This paper will focus on integrated vegetation management of utility rights of way in California.
The paper will discuss the vegetation management programs of the three largest utility
companies in California. There will be a discussion of costs and benefits of the current practices
and a discussion of methods to improve the management strategies. There will also be a
discussion of integrated vegetation management case studies and examples of successful use of
integrated vegetation management by other utility companies in the United States. Finally, the
paper will conclude with policy recommendations for California’s utilities.
Overview:
Gas and Electric utilities are responsible for managing thousands of miles of utility lines
throughout the state of California. The gas and electric facilities are generally located within
utility held easements, also known as the right of way (PSC, 2013). Easements allow utility
companies to locate their facilities and also manage the land within the facilities as needed. The
type of land management typically discussed that pertains to utility companies is vegetation
management. Vegetation management involves the survey, trimming, and removal of
incompatible vegetation within the right of way. Over the last 50 years, the strategies of
vegetation management have changed substantially. Manual, repeat removals have been replaced
by the selective use of herbicides and integrated vegetation management (Haugen, 2013). As the
vegetation strategies have evolved, so have the regulations surrounding management of right of
ways. Regulations that were once only self-reporting are now mandatory with considerable
penalties for non-compliance (NERC, 2009).
Integrated vegetation management is an ecosystem based approach to utility right of way
vegetation management. The focus of integrated vegetation management is on converting
incompatible vegetation structures, such as trees or other fast growing vegetation to stable and
low growing herbaceous plant communities (EPA, 2012). This vegetation conversion provides
the company with some assurances around vegetation related compliance, and offers cost savings
in the long-term (Finley Engineering, 2010). Integrated vegetation management is also the
American National Standards Institute (ANSI) recognized approach to utility vegetation
In addition to the compliance and cost benefits integrated vegetation management
provides to the utility company, research has also shown that implementation of IVM offers
measurable benefits to native plant and animal species. Studies of plant diversity within utility
right of ways managed with integrated vegetation management have shown that these right of
ways have greater diversity than those that were managed with other methods (Yahner, 2008).
Studies have also found that integrated vegetation management has a positive effect on
pollinators, specifically butterflies (Forrester, 2005).
The beneficial effects of integrated vegetation management on plant and animal
communities can transfer to long-term resource management strategies for the utility company
and resource agencies. Large scale resource permits, such as Habitat Conservation Plans (HCP)
can incorporate integrated vegetation management, leading to streamlined permitting and
enhanced compliance (Chazen Engineering, 2012). These vegetation management and permitting
strategies can also be applied to recently reclaimed right of ways, such as gas transmission right
of ways.
This paper will focus on an evaluation of the current vegetation management strategies of
the three largest utility companies in California a discussion of how these strategies compare
with the requirements of integrated vegetation management. The companies’ vegetation
management programs will be evaluated and discussed in detail. Federal and state vegetation
related regulations will be examined and their enforcement and non-compliance implications
discussed. The companies’ electrical reliability as well as compliance with federal and state
regulations will be reviewed. Case studies of applied integrated vegetation management will be
reviewed and successful attributes will be considered for integration into California’s utilities.
The paper will conclude with policy recommendations for regulators as well as recommendations
that utilities can implement in their current vegetation management programs.
Chapter 1. Utility Right of Ways
Right of ways are easements held by utility companies on which the facilities are located
(Public Service Commission, 2013). The focus of this paper is on transmission right of ways for
both gas and electric facilities. Transmission lines run for miles and can cross state lines, so a
facilities. Easements are a common method. Utility easements are typically a pre-defined, narrow
(typically around 100’ wide) strip running through a privately held parcel (Public Service
Commission, 2013). The property owner maintains ownership of the easement, but has access
and use limitations imposed on them by the utility company (Public Service Commission, 2013).
Typical land use restrictions include no planting of trees (specifically tall growing varieties)
within the easement and no installation of permanent facilities (buildings, concrete pads, etc.)
within the easement (PG&E, 2014). The purpose of these restrictions is to allow the utility easy
access to their facilities and to maintain the integrity of those facilities. As a result of the San
Bruno gas pipeline incident, in recent years in California, there has been a renewed effort to
enforce existing land rights within utility rights of ways. This effort will be discussed in more
depth in a following section. The utility company pays a one-time fee to the property owner for
the easement. The utility company draws up the easement document and agrees on a fee with the
property owner (Public Service Commission, 2013). Once the document has been signed, the
property owner maintains ownership of the land, and continues to pay property taxes on it, but
the utility has the land rights needed in order to install and maintain its facilities (PSC, 2013).
Language can be added to the easement document to include adjacent land rights (the company
may use land surrounding the easement for staging or laydown), ingress and egress (the company
has the right to access their easement through the private property), and other rights such as a
right to install gates or remove vegetation. If the easement is obtained for electrical facilities, the
utility may not use the easement for gas projects and vice versa.
Another method of property ownership for utility companies is to purchase the land
outright; this is referred to as owning land “in fee”. Owning the property outright allows the
utility to locate their facilities as well as assume control over all aspects of the lands management
(PSC, 2011- confirm). Facilities can utilize this land for mitigation or restoration, as discussed
more in depth in case studies chapter. Ownership of land in which facilities are located would
require the utility company to pay property taxes on the land and would typically cost more than
obtaining an easement. A utility company must balance the costs and benefits when determining
a land rights/land management strategy.
1.1 Transmission and Distribution Systems
Electrical transmission lines are the power lines that transfer electricity from its
generation point (power plant) to a substation for local distribution (Public Service Commission,
2013). Transmission lines can be interconnected and run between state lines and are known as
the transmission grid. Common transmission voltages are 60, 230, and 500 kV. The transmission
voltages are reduced down to distribution voltages within the substations through transformers
(Public Service Commission, 2013). Distribution power lines are the power lines that are used to
deliver electricity to residential customers (PSC, 2013). Distribution voltages are typically 12 or
21 kV (PG&E, 2014). From the distribution lines electricity is once again reduced in voltage
through transformers and run into houses. Utility companies maintain easements for all of their
facilities and must maintain them in such a way as to ensure safe and reliable electricity. Because
of their high voltages the regulatory agencies require that transmission facilities have large
easement clearances (NERC, 2009). The regulatory requirements for clearance will be discussed
in detail in a later chapter.
Gas pipelines are also separated into transmission and distribution networks.
Transmission gas lines are large diameter pipes that run at high pressures (PG&E, 2014).
Transmission lines are used to bring natural gas from out of state sources and move large
quantities of gas long distances between urban hubs. Unlike electric transmission facilities there
are few laws that require or regulate clearances around transmission pipelines. Similarly to
electric facilities, distribution gas lines are used to deliver gas from transmission pressures and
volumes, down to pressures and volumes that can be run into residences. The distribution system
consists of pipes that are smaller in diameter and hold a smaller volume of natural gas. The
distribution network runs throughout cities and towns and delivers gas for home use.
1.2 Need for Vegetation Management within the Utility Right of Way
Utilities have always had an interest in maintaining vegetation within their right of ways.
Conflicts arise between vegetation and high voltage lines when vegetation in left to take over the
right of way. Trees and other vegetation that can reach the power lines can lead to outages,
circuit, this could cause many homes to lose power. Direct contact is not always needed to cause
an issue, if vegetation gets too close to the power line arcing can sometimes occur. Arcing is
when electrical current is able to jump a gap (FERC, 2013). The electricity normally runs
smoothly through the power line, but if an object gets too close to that wire, the electricity can
jump off the wire and into the tree, person, etc. to ground. The potential for arcing helps to
inform the minimum clearance distances around energized conductors. The higher the voltage
the further electricity can jump in the event of arcing. For example, the arc flash boundary for
distribution voltages (12 kV) is less than one foot, while for 500kV (voltage of interstate
transmission) the boundary is nearly 10 feet (ArcAdvisor, 2014).
1.3 History of Vegetation Management
Prior to the revised standards issued by NERC in 2009, vegetation management
requirements in the United States were primarily voluntary. The FAC-003-1 existed, but was
primarily a best practices or recommendation document (FERC, 2009). On the state level,
clearance requirements were established with the CPUC’s adoption of General Order 95,
regulating the operation and maintenance of electric transmission and distribution lines in
California (State of California, 2012). This General Order was first published in 1941 and
adapted into law in 1942. Over the years there have been several updates to the rule. The most
recently update coming in 2012.
Early vegetation management within the utility right of way focused on manually
clearing any fast growing tree species by manually removing it, typically with axes, mowers, or
saws (Money, 2013). This removal would often lead to re-sprouting and additional growth within
a few years. There were no mandatory survey requirements, so right of ways may not have been
inspected annually. Conducting routine manual removals is not the most cost effective method
for managing vegetation (Finley Engineering, 2010). In the 1950’s utility companies began to
introduce herbicide into their vegetation management strategy. These early herbicide
applications were indiscriminate and killed the majority of vegetation within the right of way.
Herbicide was applied by high volume delivery methods such as trucks (Money, 2013). The
science behind the effects of some herbicides was not well known, and high concentrations of the
example, early herbicide applications were in the range of 100 gallons per acre. Today vegetation
managers can use approximately 15 gallons per acre to achieve the same goals (Money 2013).
Herbicide application is also conducted selectively using fine grain application devices, like
backpacks with hoses and nozzles. The herbicide application is targeted only on certain
re-sprouting species (Money, 2013).
1.4 Issues Arising from Insufficient Vegetation Management
The following chapter will discuss the potential issues that can arise due to insufficient
vegetation management within the utility right of way. Vegetation within the utility right of way
can lead to power outages and safety issues for the utility company as well as significant fines.
1.4.1 2003 Northeast Blackout
The most well-known vegetation related electrical outage is the 2003 blackout in the
northeastern United States and Canada. On August 14, 2003 a 230kV line in Ohio was sagging
under the heat of the day. It brushed against a tree limb and caused a short circuit in the line
(Scientific American, 2008). The utility company, FirstEnergy Corporation had an alarm system
to alert operators of such an outage, but it failed. After the first line went down, other
transmission lines were forced to carry the added electrical burden, in order to meet customer
demand. FirstEnergy Corporation operators were trying to get the first line back on-line when
three additional lines sagged and made vegetation contact, resulting in additional line outages.
By 4 PM, the system was too overloaded and shut down, leading to cascading power failures
between Ohio and northeastern Canada (Scientific American, 2008). Over 50 million people lost
power for up to two days and cost $6 billion in lost revenue and repairs (Scientific America,
2008). There were 11 deaths stemming from the loss of power and this was the largest blackout
in history. FirstEnergy Corporation was not fined as a result of this outage; the vegetation
standards were not mandatory at the time (FERC, 2004).
As a result of the blackout, FERC and NERC conducted a comprehensive study of the
utility, as well as the vegetation management and outage response plans of utilities across the
and with more oversight from FERC. They also mandated operator qualifications for those in
positions of outage response (FERC, 2009).
The blackout triggered a heightened sense of awareness around vegetation management
for utility operators. After the blackout, regulators were also being more vigilant about auditing
and ensuring that utilities were in compliance with the standard, and that other interconnection
regions were not in similar danger (FERC, 2004). After the roll-out of FAC-002-1 FERC began
levying fines on utilities that were out of compliance and causing outages. The largest fine to
date was $25 million. This was levied on a Florida Utility Company (Carr, 2013). This outage
was not vegetation related, but did impact system reliability and is indicative of the regulators
renewed focus on compliance.
1.4.2 Fires in California
In addition to causing outages, vegetation can also result in fires, which can damage land
and property. If arcing or direct contact between vegetation and electricity occur parts of the tree
or plant can fall to the ground and cause wildfires. Cal Fire estimates that 1 to 3% of wildfires in
California are the result of vegetation conflicts with power lines (Mitchell, 2009). The potential
for fire can be especially worrisome during years of drought. Trees become stressed when there
is not enough water and can become susceptible to disease and insect infestation. Combined, this
can lead to widespread tree decline and death. Dead and dying trees can then drop branches on,
or fall into electrical facilities, leading to downed wires, broken equipment, and fire. Electric
transmission lines run through very remote forested areas of the state. If a fire were to start it
could cause significant damage before it is discovered and addressed (Mitchell, 2009).
One of the most notorious wildfire cases in recent California history is the Trauner Fire.
The fire began August 7, 1994 in the town of Rough and Ready; located in the Sierra Mountains
in Nevada County. The fire burned 500 acres and consumed 12 homes and 22 structures,
including a historic schoolhouse (Doyle, 1997). It was determined that the fire began when an
oak branch made contact with 21kV distribution power lines. PG&E is the utility provider in this
area and was guilty of inadequately maintaining vegetation clearances around power lines. The
company was sued and found guilty of 739 counts of negligence for failing to trim vegetation
While this may be the most well-known case of vegetation caused wildfires, PG&E has also
settled or been found guilty in 4 other fires throughout northern California. These fires all
occurred during the 1990’s and totaled 127,500 acres of damage (Doyle, 1997).
In 2007 Southern California Edison utility lines were involved in a devastating wildfire.
The Grass Valley Fire started when a tree fell into power lines and caused a surge of electricity
to super heat metal components and spark the fire. The fire was located in San Bernardino
County and destroyed 174 homes, damaged 25, and burned a total of 1,247 acres (Barr, 2011).
The fire destroyed parts of National Forest land. The utility was sued by the United States Forest
Service as well as citizens and the HOA of the community that was impacted. SoCal Edison
settled the federal lawsuit by agreeing to pay $9.6 million in damages to the USFS. The utility
also had to contend with approximately 175 plaintiffs seeking retribution for damage to the
community including economic losses and other damages. In December 2012 confidential
settlements were reached with homeowners impacted by the fire. SoCal Edison did not admit
liability in the settlement (Barr, 2012).
The propensity for California forests to burn, coupled with the number of electric power
lines in the state, is a potentially dangerous combination. As discussed above there are numerous
examples of high profile fire cases in northern and southern California caused by tree/power line
conflicts. Comprehensive vegetation management is required to ensure that trees and other
vegetation are safely outside of the right of and way in order to avoid future fires.
Summary:
Insufficient management of vegetation within the utility right of way can lead to a
number of issues. There is a history of vegetation caused fires throughout California that have
caused millions of dollars of damage and resulted in large fines for the utility company. In
addition, vegetation is known to cause power outages by growing into or falling on electric lines.
The largest power outage in history occurred in 2003 and was caused by vegetation. It is because
of these dangers that utility companies must develop vegetation management programs that can
guarantee vegetation clearances over time. This is an opportunity for companies to evaluate or
implement integrated vegetation management plans.
Utility vegetation management programs are regulated at the state and federal level. The
utility companies are required to comply with multiple regulations that specify vegetation
clearances and program requirements. The following section will describe the regulators and
laws utility companies are subject to.
2.1 Regulatory Agencies:
The electrical transmission lines in California are overseen and regulated by multiple
organizations at the state and federal level. The North American Electrical Reliability
Corporation (NERC), Federal Energy Regulatory Commission (FERC), California Public
Utilities Commission (CPUC), and California Energy Commission (CEC) are all involved in the
oversight of; as well as setting the regulations that utility companies must comply with. In
addition to the federal and state regulations utility companies may set individual operating
procedures around vegetation and utility management.
The North American Electrical Reliability Corporation (NERC) is tasked with setting the
clearance requirements for vegetation growing near electrical transmission facilities as well as
defining what the vegetation management plans must consist of (FERC, 2013). NERC was
founded in 1968 following the Federal Power Commissions investigation of the 1965 blackout in
New York City and Canada. NERC brought together 12 regional electrical organizations
throughout the country. NERC is a non-profit organization which is responsible for
communicating between the Federal government and utility companies (NERC, 2012). They
review the grid demands and the utilities ability to meet them. NERC is responsible for
developing the vegetation clearance requirements (called standards) for electric transmissions
lines (NERC, 2012). NERC does not develop the requirements for vegetation clearances around
distribution lines. Distribution clearance standards and developed by the state’s regulatory
agency (FERC, 2013). This is discussed more in depth in the section on the California Public
Utilities Commission.
The California Energy Commission (CEC) is responsible for planning and developing
California’s energy policy. They are also responsible for ensuring adequate energy safety and
supply in the state of California (CEC 2014). The CEC was created through the legislature in
State Energy Resources Conservation and Development Commission (former name for the CEC)
(CEC, 2014). The CEC is run by a chairperson and 4 commissioners, all appointed by the
governor, with 5 year overlapping appointments. There are seven major divisions within the
commission covering the areas of transportation, energy supply, administration, siting and
environmental protection, efficiency, renewables, and research and development (CEC, 2014).
The energy supply and siting and environmental protection divisions are the two areas of the
commission most directly associated with utility right of way management. The CEC has
commissioned a number of studies from the Electric Power Research Institute (EPRI) and other
organizations to evaluate issues associated with transmission line planning and siting (CEC,
2014).
The Federal Energy Regulatory Commission (FERC) has a hand in regulating and
overseeing all energy lines of business in the United States (electric, gas, oil, etc.). They are
responsible for the safety and reliability of both electric and gas transmission systems (FERC,
2013). FERC also reviews large transmission projects and licenses hydroelectric projects and
facilities in the United States. FERC is responsible with reviewing and approving all new
hydroelectric facilities in the US (Greenfield, 2010). Since FERC is primarily interested in
system integrity and electrical reliability; they do have an interest in utility right of way
vegetation management. FERC identifies tree/power line contact as the leading cause of power
outages in the United States (FERC, 2013). FERC partners with NERC on studies focused on
increasing electrical reliability in the United States (Greenfield, 2010). FERC must review and
approve the utility standards that NERC develops and rolls out to utility companies. Utility
standards cover aspects of right of way management such as vegetation management and
clearances around transmission utility lines.
FERC is headed by 5 presidentially appointed commissioners. FERC may not have more
than 3 commissioners belonging to the same political party, in an attempt to maintain their
organization as independent from political influence (Greenfield, 2010). As a federal entity,
FERC is funded by the United States, and must request a budget each fiscal year. There are three
main divisions (called functions); the Administrative, Regulatory, and Litigation functions.
The predecessor to FERC was the Federal Power Commission. This group was formed in
1930 and its primary function was the coordination and development of hydroelectric facilities
regulatory body and was appointed commissioners by the president. FERC decisions are
reviewed by federal courts, not presidents or congress (Greenfield, 2010). In 1938 the Federal
Power Commission was given oversight of gas facilities through the passage of the Natural Gas
Act (Greenfield, 2010). In 1977 Congress passed the Department Of Energy Energy
Organization Act which brought the FPC under the DOE branch in the government (Greenfield,
2010). At this time, the organization was also renamed FERC (Greenfield, 2010). Over the years,
FERC’s regulatory responsibilities have changed. The most recent act, the Energy Policy Act of
2005, expanded FERC’s responsibilities around the transmission and sale of natural gas
(Greenfield, 2010). FERC’s creation and evolution over time demonstrates that electric (and gas)
transmission in the United States has and continues to be a priority.
The California Public Utilities Commission (CPUC) is the state government body that
provides oversight of all utilities in California (gas, electric, and water). The CPUC is led by a
group of commissioners, appointed by the governor of California (CPUC, 2014).
One of the responsibilities of the CPUC is developing the vegetation clearance
requirements for distribution electric lines in California. As mentioned above, NERC develops
the standards for clearance related to transmission, but not distribution electric lines.
The CPUC is also responsible for establishing the rates of electric and gas for customers
in California. In order to do this, the CPUC must review and evaluate the costs the utility
companies will incur, and what they plan to spend on various programs each year. Every three
years utility companies must submit a General Rate Case (GRC) to the CPUC. The General Rate
Case is a document which discusses the cost of various programs at the utility (CPUC, 2014). It
discusses the costs associated with operations and maintenance, new development and facilities,
as well as other programs (CPUC, 2014). Within the operations and maintenance section the
utility is required to discuss its vegetation management plan and costs. The GRC is reviewed
thoroughly by the CPUC and can be denied or modified if the CPUC feels it is excessive or
unnecessary. This reporting is incentive for utilities to have efficient vegetation management
strategies and organizations within the company. Within the GRC a utility company is able to
2.2 Regulatory Requirements and Statutes
The utility standard for electric transmission vegetation management in the United States
is FAC-003-2 (Vegetation Management Standard). The Final Rule, Order 777 was issued in
March 2013 and utilities are required to be in compliance with the new standard on July 1, 2014
(FERC, 2013). This most recent ruling is a revision to version 1 of FAC-003-1. FAC-003-1 was
produced in the 2000’s and was the utility standard (NERC, 2006). This standard outlined
transmission vegetation management plan requirements for utilities and line clearance standards
based on the voltage and risk of power lines. The FAC-003-2 keeps much of the language of its
predecessor, but it incorporates required timelines and reporting measures (FERC, 2013). These
updates were added to the FAC-003-2 as a result of the 2003 blackout and subsequent research
on reliability and utility practices conducted by NERC and FERC (FERC, 2009). Figure 1. At the
end of this chapter provides an overview of the various regulators and laws.
The FAC-003-2 standard is for power lines over 100kVand transmission lines that are in
the interconnection corridors (FERC, 2013). The standard establishes requirements around
vegetation inspection, clearances, record keeping, funding, and other components of a
comprehensive vegetation management plan (FERC, 2013). The original standard called for the
transmission owner to decide and document the level of on the ground vegetation inspection. The
updated version requires a physical inspection of vegetation in the utility corridor a minimum of
once per year. The standard also requires the transmission owner to document the clearances
they are achieving. The clearances must at a minimum be the level required in order to avoid
flashover. The standards are established in 516-2003 Guide for Maintenance Methods on
Energized Lines (FERC, 2013). Leaving the transmission owner to define their own clearance
allows for the utility to comply with NERC requirements, as well as local requirements, or
company policy (FERC, 2013). In addition to the technical requirements of the standard the
transmission owner must develop a yearly vegetation management plant to be made available to
regulators. The plan must include information on the methods of treatment (herbicide use,
mowing, etc.) as well as planned workload for the year. They must address the timeline required
for property owner notifications as well as length of time required to obtain environmental
permits. The documentation of an integrated vegetation management plan would be found within
requires quarterly reporting to the transmission owners governing body of any vegetation caused
outages on electric transmission lines (FERC, 2013).
In addition to the program requirements set out in the standard, it also establishes levels
of non-compliance, or violation of the standard. Compliance with the standard is overseen by
NERC (Greenfield, 2010). NERC is required to conduct field audits a minimum of once every
five years, or more as warranted. Additional audits would be warranted if a utility is reporting
vegetation caused outages. Violations to the code must be reported to NERC and FERC. There
are fines associated with violations of the standard (FERC, 2013). These fines are levied by
FERC after investigating the incident. The levels of non-compliance range from 1 to 4; level 1
fines are for violations that are the least impactful of system reliability (administrative type
fines). Level 4 fines involve documented vegetation related outages or egregious violations (4 or
more) of the utility standard (FERC, 2009). The fines range from tens of thousands of dollars up
to a million dollars, depending on the severity and timeline of the violation (FERC, 2013). These
fines represent a material threat to the utility companies’ bottom line, so compliance is a priority
of the vegetation management plan and the company.
At the state level, California utilities must comply with General Order 95 Rule 35 as well
as Public Resource Code 4293 and PRC 4292 (PG&E, 2013). These standards are established by
the California Public Utilities Commission and pertain the vegetation clearances. General Order
35 mandates that California utilities maintain clearances established by the CPUC for power
lines (CPUC, 2012). The distance requirements are established in part by flashover potential, but
also dependent on where they are located. For example vegetation growing around wires that
cross railroad tracks is afforded a clearance of greater than 30 feet, whereas clearance of wires
around non-walkable surfaces is only 8 feet (CPUC, 2012). Public Resource Code 4293 requires
that owner operators of distribution and transmission lines maintain the following clearances:
2400 voles – 72,000 volts 4 feet. 72,000- less than 110,000 volts 6 feet. Any line over 110,000
volts 10 feet (PG&E, 2014). These clearances must be maintained at all times including when
temperatures are high and the lines sag. They must also provide clearance in the event that trees
are water logged or carrying a snow load. Public Resource Code 4292 regulates fire break and
clearance requirements (PG&E, 2014). At the ground level around poles, all flammable materials
(duff, grasses, any vegetation that can spread fire), must be cleared. Between ground level and 8
limbs and living vegetation must be removed. From 8 feet to the height of the conductor
(typically around 35 feet off the ground) all dead, dying, or diseased limbs or trees must be
removed (PG&E, 2014). As with the FERC and NERC federal requirements, California state
requirements are very precise and measurable. The state regulations take into account the ground
cover and area of the power lines, in addition to flashover potential.
2.3 ANSI Standards
ANSI (American National Standards Institute) develops and publishes work standards
and guidelines for work activities across almost every business sector. The American National
Standards Institute is a 501 (c) 3 non-profit organization with the goal of increasing the
competitiveness of US businesses across the world through the standardization of business
practices (ANSI, 2014). The ANSI standards are not mandatory or regulatory standards. They are
established by the institute as best management practices based on input and consultation with
multiple professional organizations. They are recognized as the trade standard, but are in no way
enforceable and carry no penalties for non-compliance. ANSI A300 is the approved standard that
deals with vegetation management around utilities (ANSI, 2014). This standard lays out the best
management practices for managing vegetation around utilities and is comprised of 9 sections
(ANSI, 2014). The A300 standard is broken down into parts 1 through 9 and addresses pruning,
soils, support systems, lightening protection, management, planting, integrated vegetation
management, root management, and tree risk management. ANSI A300 standards were written
by the Tree Care Industry Association (Tree Care Industry Association 2013).
ANSI A300 Section 7 addresses Integrated Vegetation Management. This section
describes the creation and implementation of an integrated vegetation management program at a
utility (Tree Care Industry Association, 2013). The standard addresses site selection of right of
ways that could potentially benefit from integrated vegetation management as well as a
discussion of control methods. In integrated vegetation management, there are 3 primary control
methods: cultural, biological, and chemical (Tree Care Industry Association, 2013). Cultural
control methods involve the introduction (or re-introduction) of native plant species as well as
more appropriate vegetation communities to outcompete the undesired vegetation within the
predators to combat unwanted vegetation. The biological controls can be implemented to control
the fast growing vegetation, or used to combat non-native invasive plants that may have
overtaken the right of way after initial over story clearing (ex. Scotch or French broom). Finally,
chemical control involves the utilization of herbicides to meet vegetation goals. Generally, only
EPA approved herbicides are used according to direction (Oregon DOT, 2011). The herbicide is
a transitional tool, and typically selectively applied on a small scale, through the use of a
backpack and nozzle. Selective application is defined as applying the lowest level, non-residual
herbicide only to plants with potential for stump or re-sprouting, or noxious weeds (Money,
2013)
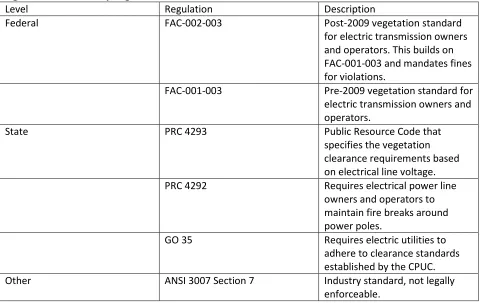
Figure 1. Electric Utility Regulations
Level Regulation Description
Federal FAC-002-003 Post-2009 vegetation standard
for electric transmission owners and operators. This builds on FAC-001-003 and mandates fines for violations.
FAC-001-003 Pre-2009 vegetation standard for
electric transmission owners and operators.
State PRC 4293 Public Resource Code that
specifies the vegetation clearance requirements based on electrical line voltage.
PRC 4292 Requires electrical power line
owners and operators to maintain fire breaks around power poles.
GO 35 Requires electric utilities to
adhere to clearance standards established by the CPUC.
Other ANSI 3007 Section 7 Industry standard, not legally
2.4 Penalties and Non-Compliance
As discussed above, violations of FAC-003-2 present a material threat to a company’s
business. The fines assessed are determined by NERC, and approved by FERC regulators and
incorporate the violations severity level, as well as the violation risk factor (Greenfield, 2010).
Violation severity level is a measure of how severely the requirement was violated. Violation
risk factor is a measure of the amount of risk the violation presents to the utility corridor.
Between the roll-out of the new utility reliability standard in 2009, and 2013, utilities have paid
more than $150 million in fines. According to the standard maximum penalties could amount to
one million dollars a day per violation (for violations with both high violation risk factors and
high violation severity levels) (FERC 2013). In 2009 Duke Energy was forced to pay
approximately 2 million to settle a vegetation non-compliance issue which led to a flashover
caused outage (Bracewell, 2009). Also in 2009, Baltimore Gas and Electric Company was fined
$180,000 for violation of their Transmission Vegetation Management Plan (TVMP) (Bracewell,
2009). Finally, MidAmerican Energy Company was forced to pay over $100,000 in fines and
penalties for allowing a tree to grow within the right of way and causing an outage (Bracewell,
2009). These penalties were levied under the FAC-003-1 standard (Bracewell, 2009). With the
adoption of FAC-003-2 standard, penalty amounts and frequency of penalties are likely to
increase.
The CPUC also levies fines against utility companies for violations of PRC 4292, 4293,
as well as GO 95 Rule 35. Individual violations to these codes and rules are evaluated by the
CPUC and a commission determines the fines to the company (CPUC, 2014). The company may
also be mandated to pay restitution to the state of California. For example, in 1999 PG&E was
fined $6 million to be paid to the state and was required to use $22.7 million of shareholders
money to fund various vegetation program upgrades and inspection protocols (CPUC, 2012).
In conclusion, there are regulations placed on utilities by both the federal and state
governments to manage vegetation within the utility right of way and around electric facilities.
The regulations are meant to ensure system reliability and safety. The American National
Standards Institute has developed a standard; A300 regarding best management practices for
utility vegetation management. This standard is not a regulation and offers no compliance
authority to impose fines on companies that violate regulations. These fines can range from
several thousand dollars up to one million dollars a day per violation. This represents a material
threat to the company and compliance must be taken seriously, or there could be financial
impacts.
The updated and mandatory vegetation management standard, along with the potential for
million dollars per day fines, represents a challenge for utility companies. The size of the
potential fines represents a material threat to the company and a major outage could be a public
relations disaster for the utility. This requires the utility to have a thorough understanding of the
plant communities through which the power lines run and to develop and comprehensive,
predictable vegetation management plan. In the wake of 2003 blackout there is an opportunity
for a more widespread application of integrated vegetation management as a way of mitigating
the threat of vegetation caused outages.
Utility companies do not have the same strict regulations regarding clearances in their gas
line right of ways. The utility is required to protect any above ground portions of the gas line
from overhead threats. The gas pipeline utility must be able to access all of their pipeline right of
ways in order to conduct surveys and routine as well as emergency activities (PG&E, 2014).
While there may not be clearance requirements, if a utility is unable to quickly deal with an
emergency situation, repercussions are likely from federal and state regulators.
Chapter 3. Vegetation Management Strategies of the Major Utilities in California
The three largest gas and electric utility providers in CA are Pacific Gas and Electric
Company (9.4 million customers), San Diego Gas and Electric (3.6 million customers), and
Southern California Edison (14 million customers). Collectively these three companies provide
service to over 27 million Californians. While not in direct competition with each other, due to
their unique service areas, the companies still have an incentive to keep the electricity reliable
and the prices low.
Pacific Gas and Electric Company, San Diego Gas and Electric, and Southern California
Edison state that they are currently utilizing integrated vegetation management around their
electric rights of way. The budget information for these programs is discussed more in depth in
these utilities are cycle or treatment based. They plan and budget to cut or treat a large amount of
vegetation on an annual basis. This would indicate that the rights of ways are not actually being
converted to a more compatible vegetation structure as would be seen with an integrated
vegetation management plan. Instead, the utility companies are continually dealing with
incompatible vegetation.
PG&E provided the most information regarding their vegetation program and will be
discussed in the following paragraphs. The goal of PG&E’s vegetation management program is
to convert all rights of ways to low growing vegetation through the combined use of IVM,
mechanical removals, and herbicide (PG&E, 2014). Following the initial clearing of a right of
way (as done for installation of new facilities), the right of way is monitored for sprouting and
regrowth, and treated appropriately with herbicide (PG&E, 2014). When tree trimming is
required, PG&E attempts to get large clearances that will maintain compliance for multiple
years, in order to increase efficiency (PG&E, 2014). PG&E’s distribution vegetation
management is based on an annual cycle of inspection and treatment (PG&E, 2014). PG&E did
not provide any additional information regarding its approach to IVM. There were no examples
of successful (or unsuccessful) use of the strategy on its right of way, or areas that would be
targeted for IVM.
PG&E was also the only utility researched to discuss vegetation management within its
gas line right of ways. PG&E is currently in the process of clearing gas line right of ways of
incompatible vegetation and structures (PG&E, 2014). This is a new effort that would be
considered to be similar to the initial clearing required for installation of a new facility. PG&E
also provides a contracted tree root study. The tree root study indicates that when tree roots
interact with pipelines there is a high occurrence of pipeline coating damage (PG&E, 2014). This
potential for damage requires the company to manage trees within the gas line right of way and
helps to explain the new push to clear gas line right of ways.
3.1 Annual Costs and Budget information
Pacific Gas and Electric Company spent approximately $180 million on vegetation
management programs in 2012 (PG&E 2013). SDG&E spends about $21 million on vegetation
California Edison spends a similar amount each year on vegetation management of an inventory
of approximately 1.4 million trees within their service territory (Southern California Edison,
2013). The difference in budgets can be linked to the relative size of the utilities territory.
PG&E’s service territory is 70,000 square miles primarily around northern California. The
vegetation in this part of the state consists of many tall growing tree species. Southern California
Edison’s service territory is about 40,000 square miles and is located in the south and eastern
portion of the state. Much of this land is desert with little need for tree removal. San Diego Gas
and Electric operates a 4,100 square mile territory on the southern coast of California. Each of
these utilities is required to conduct an annual complete inspection of their lines per the NERC
requirements (FAC-003-1). They must then conduct treatments as needed. These utility
companies all have a number of public outreach policies and strategies to educate and involve
the public in vegetation management (PG&E, 2014, SDG&E, 2014, SCE, 2014).
Fully integrated vegetation management programs have an initial higher cost, but show
reduced costs in the long term (Caroll, 2010). Reduced costs stem from avoided maintenance and
emergency response needs (Caroll, 2010). A study conducted by the Caroll Electric Cooperative
in 2010 found the cooperative could save $50-70 million over 30 years by continuing to
implement integrated vegetation management. This represents a 4-6 times savings over
mechanical vegetation management as is consistent with the industry estimated savings (Caroll,
2010). The Caroll Cooperative’s vegetation management requirements are similar to the
vegetation requirements of California’s utilities. The Caroll Cooperative manages the floor and
walls of utility right of ways for vegetation encroachment (Caroll, 2010). The findings of this
study can be used to inform vegetation management decision making in California.
An integrated vegetation management program ultimately has the goal of reducing the
number or amount of incompatible vegetation within the right of way. This is where the cost
savings of IVM are found. A reduction in the number of trees that require treatment (whether
manual treatment or application of herbicide) ultimately reduces the cost of management.
Research on integrated vegetation management has focused primarily on measuring density and
species type of vegetation within a right of way following various treatment types. These studies
examine test plots within the right of way over many years (Yahner, 2005).
Research by Yahner in the 2000’s was focused on measuring tree and vegetation
then treated with either manual treatments only (mowing or use of chainsaws), or manual
removal with an herbicide treatment. Tree control was found to be excellent in the plots that
utilized both mowing and herbicide treatments (Yahner, 2005). The control of trees in the
manual removal only plots was found to be poor (Yahner, 2005). Yahner completed a second
inventory 5 years after the treatment and found that incompatible vegetation had increased at a
higher rate in the non-herbicide plots (manual treatment only) than in the combination of
treatments plots (Yahner, 2005). A reduction of tree inventory means fewer treatments and a
reduction in costs to the utility company. This is an example of the cost savings that can be found
within the adoption of an IVM program.
The Electric Power Research Institute in cooperation with the Empire State Electric
Energy Research Corporation (ESEERCO) conducted research to determine the cost per acre of
various vegetation treatment methods. The study looked at hand cutting, mowing, cutting and
herbicide treatment (cut stump), dormant basal herbicide treatment, summer basal herbicide
treatment, selective ground foliar treatment, and aerial treatment (EPRI, 2000). The research
found that on a per acre basis, regardless of stem density (density ranged from 1,000 stems per
acre to 4,500 stems per acre), hand cutting was the least expensive method of management.
Dormant basal herbicide treatment was the most expensive per acre method regardless of density
(EPRI, 2000). In terms of effectiveness, it was found that all herbicide treatments resulted in a
target vegetation reduction of over 70% (EPRI, 2000). For hand cutting, the reduction in stems
was less than 10%, and the reduction for the cut stump strategy was 55% (EPRI, 2000). Manual
removal was found to be not effective in reducing the number of stems within the right of way
(EPRI, 2000).
The primary benefit of integrated vegetation management to a utility company is cost
savings. As discussed above, the utility companies in California spend millions of dollars per
year on vegetation management. A reduction of costs for operation and maintenance activities
would benefit the company’s shareholders and could potentially free up money for other
programs. The Yahner and EPRI research found that combinations of treatment methods are the
most effective at reducing stem count. Reducing stem counts in the right of ways saves utility
companies money through the reduced need for treatments. Integrated Vegetation Management
In addition to cost savings, the utility company can achieve other benefits from integrated
vegetation management. Integrated vegetation management has ecological benefits (as shown in
the National Grid case study) which a utility company could benefit from. One of the core values
of PG&E is to protect the environment (PG&E, 2014). As discussed, Integrated Vegetation
Management can create habitat for native and endangered species and is less impactful on the
environment. These are both examples of protecting the environment that PG&E would be able
to report out to shareholders and the public. All three utility companies produce an annual
sustainability report that is released to shareholders and the public. The ability to report
environmental benefits from integrated vegetation management to shareholders and the public
provides a non-monetary benefit to the utility company. The table below summarizes the benefits
of integrated vegetation management.
Table 2. Costs and Benefits of Integrated Vegetation Management
Method Benefits Costs
Integrated Vegetation
Management
-Habitat creation
-Reduced outages
-Ecosystem management
-Meets corporate sustainability
goals
Initial costs high (depending
on status of right of way).
Long term cost savings (4-6
times less than traditional
management).
Mechanical management -Less expensive initially
-requires less management and
oversight
4-6 times more expensive over
30 years (Caroll, 2010).
3.2 Reliability Indexes
Utility companies are required per California Independent System Operator (CA ISO)
requirements to maintain a log of all power outages. The CA ISO sets standards for reliability
that the utility companies are measured against. The CPUC requires that utility companies
submit three different scores. The SAIDI (System Average Interruption Duration Index)
measures the number of minutes of sustained outage per customer per year. The SAIFI (System
The MAIFI (Momentary Average Interruption Frequency Index) measures the number of
momentary outages per person per year (CPUC, 2014). Each of these outage measures provides
important information to the public regarding the utilities reliability. As discussed above,
vegetation issues are the number one cause of power outages in the country. While not all
outages can be attributed to vegetation, these reliability scores can be used as an indication of the
utilities success with its vegetation management programs.
3.2.1 PG&E Reliability Scores
PG&E provides the last 10 years of outage data in its 2013 reliability report (PG&E,
204). The outage occurrences measures by each of the reporting indexes have all declined over
time (PG&E, 2014). PG&E also describes the top 10 largest outages of the past year. The report
indicates that the largest outages were all weather related and were caused by significant
precipitation or unusually strong winds (PG&E, 2014). This is a good sign for the company’s
vegetation management program. No major outages were directly vegetation related. The CPUC
defines a major outage as non-earthquake weather related outage that affects between 10% and
40% of customers (CPUC, 2014). Overall, PG&E has been able to demonstrate a significant
reduction in SAIDI and SAIFI events (PG&E, 2014). When data is reviewed on a regional or
divisional basis, PG&E has made the most advances in the Sierra and North Coast regions
(PG&E, 2014). These regions encompass heavily forested and remote areas of the territory
(PG&E, 2014). It can be assumed that with the access issues (caused by remote power line
locations), and the majority land cover type being forest, that PG&E would historically have had
issue managing vegetation in these divisions. This large (greater than 60%) reduction in the
frequency and duration of outages shows an investment in reliability programs by the utility.
Reliability work includes updating and maintaining infrastructure as well as operations and
maintenance activities such as vegetation management.
3.2.2 Southern California Edison Reliability Scores
Southern California Edison data shows that over the past 10 years, the number of SAIDI
have reduced slightly (32 and 0.08%, respectively) (Southern California Edison, 2014). Southern
California Edison’s analysis of the causes of major events reveals that the company suffered
many outages due to wildfire (Southern California Edison, 2014). This is to be expected, as the
utility maintains power lines within the southern California mountains, which are subject to
varying intensities of fires every year. The utility summarizes the cause of the top 10 major
SAIDI events by year. For 2013, of the top 10 major SAIDI events of the past, the utility
discloses that 4 of them were somehow caused by vegetation (Southern California Edison, 2014).
In 2011, 7 of the top 10 major events were contributed to vegetation. The vegetation caused
outages were more prevalent in recent years (2010-2013); historically the major SAIDI outages
were attributed to weather events and wildfire (Southern California Edison, 2014). The utility
does note that they have had significant issues with bar beetle damaged and declined trees in
recent years (Southern California Edison, 2014). Following wildfires, bark beetles can move in
and further impact the distressed trees. This will often lead to mass die of pine and fir stands
(Southern California Edison, 2014).
3.2.3 San Diego Gas and Electric Reliability Scores
San Diego Gas and Electric has shown a downward trend in SAIFI, SAIDI, and MAIFI
events over the past 10 years (San Diego Gas and Electric, 2014). The MAIFI events have been
reduced by more than half (0.614 to 0.211), SAIFI events dropped almost 17%, and MAIFI
events decreased by almost 20% (San Diego Gas and Electric, 2014). During 2013, SDG&E
reported that 2 of its largest outages were tree related. The causes of the top 10 outages over the
past 10 years indicate that very few SDG&E outages are tree related. There are several years in
which vegetation is not identified as a cause (San Diego Gas and Electric, 2014).
The outage data for PG&E and SDG&E indicated a downward trend in both number and
frequency of outages as well as their duration. This is beneficial to the company and utility
customer and is the trend which regulators would like to see continue. Vegetation is the leading
cause of electrical outages in the United States (FERC, 2013). Given that PG&E and SDG&E
have been able to reduce their outages we can assume that their vegetation management
programs have been fairly successful. Looking at the data for PG&E, the two divisions that were
Coast divisions. Improved vegetation management, or a more focused vegetation management
program, in these areas no doubt helped the company improve their reliability. While a much
smaller company, SDG&E was also able to make gains in their reliability scores. This company
manages utility lines in wildfire prone areas and through heavily forested terrain (San Diego Gas
and Electric, 2014). Their improved reliability scores indicted that they have also been able to
find ways to deal with tree and vegetation issues, including impacts from bark beetle infestations.
Southern California Edison has not shown downward trends in the frequency and duration of
their outages over the past 10 years. The frequency as well as duration of outages has increased.
As discussed in their 2013 reliability report, Southern California Edison has had to deal with the
impacts of large bark beetle infestations as the result of significant wildfires over the past 10
years. While it is not distinguished in the reliability report, we can assume that Southern
California Edison is having issues managing edge, or corridor trees that are failing into the lines
and leading to outages. Dead and dying vegetation also present a management challenge to
utility right of way managers.
Summary:
Overall, utility companies in California have been able to improve their reliability scores
over the past 10 years. Electrical reliability and outages are monitored by state and federal
regulators and fines can be assessed for issues. Reliability scores can be used as an indication of
the success of a company’s vegetation management program, as vegetation is the number one
cause of outages. Thus, over the past 10 years, vegetation management plans at the largest
utilities in California have improved. The following chapter will look at examples of benefits
besides improved reliability that can be achieved through Integrated Vegetation Management.
Chapter 4. Examples of Applied IVM
Utilities across the United States have begun to implement integrated vegetation
management. The strategy of IVM can be utilized in the effort to preserve habitat for rare and
endangered species (Chazen, 2012). By selectively managing the vegetation structure, land
managers can create conditions that are suitable for rare plants, insects, as well as vertebrate
suitable conditions for rare and native plant species and can help to create the foundation for
stable ecosystems (Beran, 2005).
In addition to creating new habitat, IVM can help in the creation and protection of
wildlife corridors (Bodin, 2011). The utility corridors run throughout the countryside and can
connect isolated islands of wild areas to one another. Due to the increase of land development
throughout what were once open wild lands, small sections of undeveloped land can become
what are known as islands. These areas contain favorable habitat for species, but are completely
disconnected from other suitable areas of habitat. This can bottleneck populations and
compromise their long-term survivability. Being able to connect these wild areas would allow
previously isolated breeding populations to interact and increase genetic diversity, as well as
create many acres of additional habitat. This could help increase the numbers of threatened and
endangered species.
Right of way corridors can also be managed as edge or early successional habitat. Early
successional habitat is the first regrowth after a catastrophic environmental event such as fire,
micro burst, tornado, etc. (Bullock, 2006). Early successional habitat can serve as important
foraging and grazing habitat for a number of bird species (including raptors). Utility right of
ways offer a relatively undeveloped stretch of edge habitat (Bullock, 2006).
The following section will discuss an example of integrated vegetation management
within a utility corridor in New York. This study looked at the effect integrated vegetation
management had on rare plant communities and pollinators. This study helped to inform
vegetation managers and utility operators, as well as regulatory agencies and can be used as a
basis to revise or update utility vegetation management best management practices and
regulations.
4.1 National Grid’s HCP for Operations and Maintenance Activities
National Grid is an electric and gas utility providing service throughout New York State
and the northeastern US. The company owns and operates several thousand miles of transmission
utility corridor in upstate New York between Glens Falls and Oneida (Chazen, 2012). This area
is part of the historic range of the Karner blue butterfly and the frosted elfin butterfly. The
listed endangered species are protected from take through human activities. Take is defined in
Section 3(18) of the Federal Endangered Species Act (FESA) as “harass, harm, pursue, hunt,
shoot, wound, kill, trap, capture, or collect, or to attempt to engage in any such conduct."
(NYSDEC, 2010). The New York State endangered species regulations define take very
similarly as the “pursuing, shooting, hunting, killing, capturing, trapping, snaring and netting of
any species listed as endangered or threatened in this Part, and all lesser acts such as disturbing,
harrying or worrying” (NYSDEC, 2010). The frosted elfin butterfly is not federally listed, but is
a New York State threatened species. Threatened species are those that are federally threatened
or native to New York State and are in jeopardy of becoming endangered in the foreseeable
future (Conserve Wildlife Foundation, 2014). New York State threatened species are offered the
same protections as endangered species (NYSDEC, 2010). The protection status of these two
species and the requirements of vegetation management on utility right of ways are in conflict.
Nation Grid is not able to successfully complete vegetation management without potential for
take of the Karner blue butterfly and frosted elfin (Chazen, 2012).
The New York State and Federal Endangered Species Acts do allow for some limited
take of both of these species through the issuance of Incidental Take Permits (ITP). Incidental
Take Permits are issued by the United States Fish and Wildlife Service (USFWS) for FESA and
by the New York State Department of Environmental Conservation (NYSDEC) at the state level
(Chazen, 2012). The ITP requires an applicant to prepare a comprehensive environmental
document (biological assessment) which describes the project, its impacts (temporary and
permanent) to suitable habitat, potential avoidance and minimization measures, and proposed
mitigation. ITP’s can be granted on a project specific basis or can be granted on a larger scale
with the preparation of a Habitat Conservation Plan (HCP) (Chazen, 2012).
As a method of dealing with the conflict between operations and maintenance gas and
electric activities, such as vegetation management and the two special status butterflies, National
Grid developed a Habitat Conservation Plan (HCP), which provided take coverage for both of
the butterflies (Chazen, 2012). The HCP covers routine operations and maintenance activities
within the utility right of way for both gas and electric operations. The permit is valid for 50
years (Chazen, 2012).
Through eight years of baseline surveys completed prior to the issuance of the HCP,