R E S E A R C H A R T I C L E
Open Access
Creating a literature database of low-calorie
sweeteners and health studies: evidence
mapping
Ding Ding Wang
1, Marissa Shams-White
1, Oliver John M. Bright
1, J. Scott Parrott
2and Mei Chung
1*Abstract
Background:Evidence mapping is an emerging tool used to systematically identify, organize and summarize the
quantity and focus of scientific evidence on a broad topic, but there are currently no methodological standards. Using the topic of low-calorie sweeteners (LCS) and selected health outcomes, we describe the process of creating an evidence-map database and demonstrate several example descriptive analyses using this database.
Methods:The process of creating an evidence-map database is described in detail. The steps include: developing a comprehensive literature search strategy, establishing study eligibility criteria and a systematic study selection process, extracting data, developing outcome groups with input from expert stakeholders and tabulating data using descriptive analyses. The database was uploaded onto SRDR™(Systematic Review Data Repository), an open public data repository.
Results:Our final LCS evidence-map database included 225 studies, of which 208 were interventional studies and 17 were cohort studies. An example bubble plot was produced to display the evidence-map data and visualize research gaps according to four parameters: comparison types, population baseline health status, outcome groups, and study sample size. This plot indicated a lack of studies assessing appetite and dietary intake related outcomes using LCS with a sugar intake comparison in people with diabetes.
Conclusion:Evidence mapping is an important tool for the contextualization of in-depth systematic reviews within broader literature and identifies gaps in the evidence base, which can be used to inform future research. An open evidence-map database has the potential to promote knowledge translation from nutrition science to policy.
Keywords:Evidence map, Evidence-based methodology, Low-calorie sweeteners, Artificial sweeteners, High intensity sweeteners
Background
Evidence mapping is an emerging tool to systematically and comprehensively identify, organize and summarize the distribution of scientific evidence on a broad topic [1, 2]. It can be thought of as a first step in conducting a broad systematic review, or organizing several related systematic reviews of published literature. However, unlike a systematic review, evidence mapping does not require a risk-of-bias appraisal of the included studies or detailed extraction and synthesis of the studies’ findings [1, 3]. Instead, it descriptively summarizes the
characteristics of existing literature, typically in tabular forms, known as evidence (gap) maps [4]. These de-scriptive analyses can clarify where there is sufficient evidence to inform policy development, as well as identify research-dense areas where systematic reviews can be pursued [1, 3–7]. Conversely, evidence maps can also clarify areas where there is missing or inad-equate evidence, known as research gaps [8]. These gaps can inform researchers and policy makers where strategic research prioritization is needed for future, focused studies [1–6, 8–10]. Aside from these utilities, there are other versions of evidence mapping with dif-ferent focuses. For example, a scoping map or scoping review emphasizes capturing the entire scope of the * Correspondence:[email protected]
1Department of Public Health and Community Medicine, Tufts University
School of Medicine, Boston, MA, USA
Full list of author information is available at the end of the article
evidence and tends to include ongoing research [7]. The use of evidence mapping to present characteristics of relevant studies as well as research gaps can poten-tially provide a cost-effective methodology to facilitate evidence-based decision-making [2, 3, 6, 11].
There are currently no methodological standards for evidence mapping [12]. As described earlier, discrepan-cies exist between the terminology and methods used within evidence mapping. Various terms, including evi-dence map, scoping review and systematic map, are widely used within evidence mapping, yet there are some differences between them [7]. Nonetheless, the following key steps are generally followed in all types of evidence mapping: 1) Identifying a broad research area of interest and defining the key variables and framework for descriptive analysis; 2) Developing a thorough, clear and reproducible literature search strategy; 3) Establishing the a priori inclusion and exclusion criteria; and 4) Sys-tematically extracting, coding, sorting and reporting the findings in a tabular evidence map. It is preferable to consult with key stakeholders to guide these steps and to validate the findings [2, 4, 13].
In this paper, we describe the process and methodology of creating an evidence map database, using the topic of low-calorie sweeteners (LCS) and selected health out-comes of interest as a worked example. We also demon-strate several example descriptive analyses by using data in the LCS evidence map to help identify potential gaps and future research directions.
Methods
Seven steps were used to construct a LCS evidence-map database: 1) Identify the Scope of the Evidence Map; 2) Define the Roles and Responsibilities of Different Parties: Stakeholder Panel and Research Team; 3) Develop a Comprehensive Search Strategy; 4) Establish Study Eligi-bility Criteria and a Systematic Study Selection Process; 5) Carry Out Abstract Screening and Selection; 6) Carry Out Data Extraction; and 7) Classify Outcome Categor-ies. Details are described as follows.
Identify the scope of the evidence map
The initial scope of work was developed by the sponsor of this project in a request-for- proposals. The following five areas of research regarding the potential health effects of LCS were all considered and included: 1) energy sensing by the brain; 2) gut hormones that may influence energy homeostasis; 3) satiety and preference for taste; 4) eating behavior; and 5) body weight and composition. It is important to note that, aside from their initial feedback on our funded research proposal, the sponsor was not involved in the later refinement of the work scope or the process of creating the
evidence-map database other than providing a list of selective citations for cross-referencing purposes.
Establish roles and responsibilities of different parties: stakeholder panel and research team
A diverse stakeholder panel was recruited across eight areas of expertise: one physician, two dietitians, three policymakers, a research funder, academic researchers from five different fields, two representatives from the food industry, one journalist and one lay person. The panel served as a steering committee to guide the research team through the process of building the LCS evidence-map database. Specifically, the stakeholder panel helped refine the search strategy, finalize study eligibility criteria and define outcome groups for evidence map analysis and charting. Data screening, collection and analyses were per-formed by the research team. The research team included a methodologist with expertise in conducting and leading systematic reviews and meta-analyses, two team members with graduate-level epidemiology training and a research coordinator.
Develop a comprehensive search strategy
The research team collected key search terms from pre-vious reviews and systematic reviews on relevant topics to formulate the initial search strategy [14–16]. The search strategy was developed using both keywords and the National Library of Medicine’s Medical Subject Headings (MeSH). Duplicated citations were removed in MEDLINE® and Endnote®. The search was also cross-referenced with published systematic reviews to make sure all of the relevant articles were included. Publica-tion citaPublica-tions were exported from electronic search interfaces and stored in a Microsoft Excel spreadsheet. The relevance of the publications was determined based on pre-determined inclusion and exclusion criteria using a two-step screening process: 1) title and abstract screening and 2) full-text article screening, which is described later in detail. The initial literature search and abstract screening were conducted by the research team. After the screening was completed, the panel provided input and suggested additional key terms to refine the search strategy. The research team then carried out this supplemental search, retrieved the citations and screened this additional round of abstracts. Included abstracts from both screening rounds were then merged into the same pool for full-text screening. The final search strategy of the LCS evidence map is described in Additional file 1: Table S1.
Establish study eligibility criteria and a systematic study selection process
panel collected via webinars and online surveys. After 2 iterations, the stakeholders and research team decided that for studies to be included, they needed to be: 1) ran-domized or non-ranran-domized, controlled, clinical trials or prospective cohort study designs, which are considered the strongest study designs for causal inferences; 2) in-vestigating orally administered, FDA-approved LCS or LCS that are generally recognized as safe (GRAS); 3) reporting at least one health outcome within the five cat-egories in our scope of work; 4) an English publication; and 5) human subjects research. Articles with study pop-ulations including adults, children, adolescents, pregnant women and infants greater than 6 months old were included, whereas studies in cancer patients and cancer outcomes were excluded because the project scope includes only FDA-approved LCS that have passed FDA’s toxicological safety assessment as food additives, which in-cludes assessment for cancer risks. A search of systematic reviews and meta-analyses was also conducted in addition to the main search for reference-mining purposes.
Carry out abstract screening and study selection
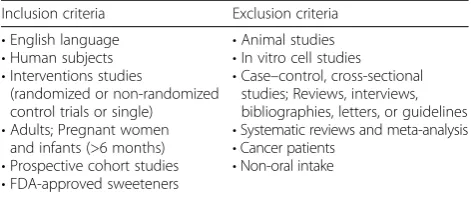
The titles, abstracts and keywords of all identified articles were screened using Abstrackr™, an open source, web-based, citation screening tool [17]. The research team screened study abstracts using inclusion and exclusion cri-teria and assigned a decision (“yes”, “maybe” or “no”) to each abstract. Two rounds of pilot tests for a total of 1000 abstracts were screened by all reviewers to calibrate screening accuracy between reviewers. Discrepancies of the pilot abstracts were discussed among reviewers until complete agreement was reached and team members fully understood the selection criteria. The remainder of the abstracts (n= 11,830) were single-screened due to the large number of abstracts and budgetary constraints. Ab-stracts with a“yes”or“maybe”label were both included in step 1 of the evidence map and the full-text articles of these abstracts were retrieved for full-text screening. Cita-tions with a “no” label were saved for record. Because of the single screening process, it is possible that a few abstracts were mistakenly rejected during this screening phase. In an effort to ensure all key studies were included, all included citations were cross-referenced with the refer-ence list of relevant systematic reviews and meta-analyses. In step 2 (full-text screening), we followed the predefined study eligibility criteria (Table 1) and recorded the reasons for rejection of each rejected article. About 5 % (n= 571) of the original citations were screened in for full-text re-view. Each full-text article was screened by one reviewer, and the screening decision of the first reviewer was then confirmed or disputed by a second reviewer. Discrepan-cies were resolved through consensus among all research team members.
Carry out data extraction
The research team extracted data on a customized extraction form shared via Google Drive to facilitate collab-oration among research team members and allow for sim-ultaneous data entry. The minimal data to collect for an evidence-map database are the information related to the PI(E)COS (Population, Intervention/Exposure, Comparator, Outcome and Study design). The extraction form for the LCS evidence-map database was designed to collect the fol-lowing data from each study: study design characteristics (study design, study duration), study population character-istics (baseline health status, age, sample size, anthropomet-rics), study interventions/exposures and comparisons (type of LCS, comparison or control group, number of people analyzed, form of administration), outcome information (all outcomes or endpoints of interest), the aim or hypoth-esis of the study and funding source of the study. The ex-traction form was designed and finalized by the research team lead, who has expertise in evidence-based research and methods. The evidence-map database was uploaded onto SRDR™, an open public data repository, and a data-base codebook is included in the supplemental material (Additional file 2) [18].
Classifications of outcome categories
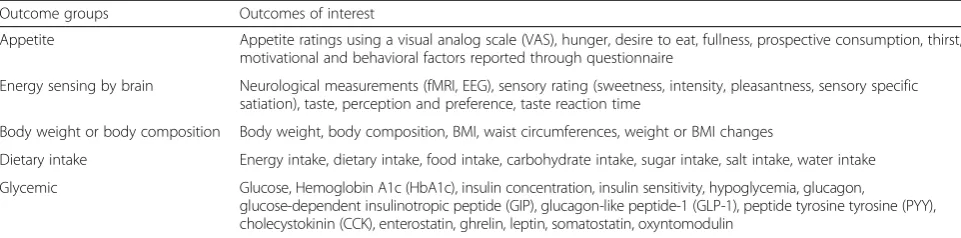
One of the most important features of an evidence map is the cataloging of the large number and variety of out-comes reported in the published literature. This step typically occurs after data extraction since the scope of an evidence-map database is large. Thus, it is often diffi-cult to pre-define all outcome categories of interest. The research team worked with the stakeholder panel to classify outcomes into clinically and biologically mean-ingful outcome categories that could be used in evidence-map analyses. The research team recorded out-comes reported in each publication and took the first at-tempt in identifying clinically and biologically relevant groups. Standardized coding was then developed for each outcome category. Feedback was sought from the stakeholder panel, and the outcome categories and cod-ing were modified based on the final consensus of the stakeholder panel. Table 2 shows the final list of out-comes for each outcome category that are reported in Table 1Study eligibility criteria
Inclusion criteria Exclusion criteria
•English language
•Human subjects
•Interventions studies
(randomized or non-randomized control trials or single)
•Adults; Pregnant women and infants (>6 months)
•Prospective cohort studies
•FDA-approved sweeteners
•Animal studies
•In vitro cell studies
•Case–control, cross-sectional studies; Reviews, interviews, bibliographies, letters, or guidelines
•Systematic reviews and meta-analysis
•Cancer patients
the studies included in the LCS evidence-map database. Specifically, outcomes related to appetite or satiety rat-ings such as hunger score and desire to eat were often rated by a visual analog scale (VAS) and were classified under the ‘Appetite’ category. Outcomes focused on neurological measurements and sensing signals by the brain were classified under the‘Energy Sensing’category. Body weight, body composition and changes in weight-related outcomes were classified under the‘Body Weight or Composition’category. The ‘Dietary Intake’category included outcomes such as energy intake, dietary intake, food intake and carbohydrate intake, and finally the‘ Gly-cemic’ category included glucose, insulin and gastric hormones. Our stakeholder panel did not identify add-itional outcomes that were not reported in the literature. Both outcome categories and full outcome lists were in-cluded in the evidence-map database, which can be used in future analyses with current or new outcome category coding.
Results
The following sections demonstrate several example descriptive analyses by using data in the LCS evidence map to help identify potential gaps and future research directions. Using data stored in the evidence-map data-base, descriptive analyses can be performed to describe study design and population characteristics. All analyses and charting were performed using Stata 2013 (Stata Statistical Software: Release 13. College Station, TX: StataCorp LP) and Microsoft Excel.
Summarize study and sample characteristics
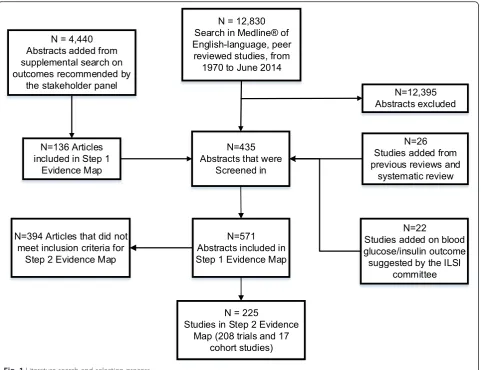
The original search on MEDLINE® from inception to June 2014 yielded 12,830 citations. The supplemental search including terms recommended by the stakeholder panel yielded 4440 additional citations. In total, 17,270 relevant citations were screened. After title and abstract screening, 571 articles were included in full-text screen-ing. Our final LCS evidence-map database included 225 studies, of which 208 were interventional studies and 17 were cohort studies. The literature search and study selection process are summarized in Fig. 1.
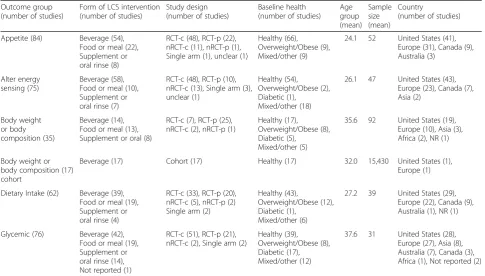
Among the 208 included intervention studies, 183 (88 %) were done in adults, 51 % of the study popula-tions were male and 140 (68 %) of the studies included only healthy subjects with no known diseases. The mean sample size was 48 subjects (range: 2–732 subjects) and the mean BMI across studies was 25.6 kg/m2 (range: 16.1–42.3 kg/m2). The mean age was 31 years old (range: 8–73 years old). Fifty-seven percent of the trials were randomized cross-over trials and 28 % were ran-domized parallel controlled trials. Eleven percent of the trials were non-randomized crossover or parallel trials. More than half of the trials (60.1 %) were acute studies, defined as less than 1 day in study duration. Among the 17 cohort studies, the BMI (mean of the means) was 23.6 kg/m2(range: 16.2–27.4 kg/m2). There were 6 stud-ies conducted on children and 11 on adults. The mean age was 32 years old (range: 2–84 years old) with an average sample size of 15,430 subjects (164–31,940 sub-jects) (Table 3). Of the 17 cohort studies included, all were conducted in the United States and reported body weight and dietary intake outcomes. We did not identify any cohort studies that investigated appetite, glycemic or brain energy sensing outcomes. There were nine studies that used a food frequency questionnaire, five studies that used 24-h recalls or food diaries and three studies that used a specific beverage questionnaire. As for LCS intervention/exposure, eight studies reported it as LCS beverage intake, two as saccharin intake, and seven as unspecified, artificially-sweetened, carbonated drink in-take, diet drink or diet soda intake.
Summarize by types of outcomes
Studies in the evidence-map database can be summarized using the outcome categories described earlier. Among the 208 intervention studies identified, 84 studies reported appetite-related outcomes, 75 studies reported energy sensing-related outcomes, 35 studies reported body weight or body composition outcomes, 62 studies reported diet-ary intake-related outcomes and 76 studies reported gly-cemic outcomes. All 17 cohort studies reported body weight or body composition outcomes. Table 4 displays the type of LCS intervention or exposure, baseline health Table 2Outcomes of interest by outcome groups in the LCS evidence-map database
Outcome groups Outcomes of interest
Appetite Appetite ratings using a visual analog scale (VAS), hunger, desire to eat, fullness, prospective consumption, thirst, motivational and behavioral factors reported through questionnaire
Energy sensing by brain Neurological measurements (fMRI, EEG), sensory rating (sweetness, intensity, pleasantness, sensory specific satiation), taste, perception and preference, taste reaction time
Body weight or body composition Body weight, body composition, BMI, waist circumferences, weight or BMI changes
Dietary intake Energy intake, dietary intake, food intake, carbohydrate intake, sugar intake, salt intake, water intake
Glycemic Glucose, Hemoglobin A1c (HbA1c), insulin concentration, insulin sensitivity, hypoglycemia, glucagon,
status of the study population, age of the study popula-tion, sample size and trial country by outcome category in the 208 intervention and 17 cohort studies. Briefly, the majority of the studies were conducted in the United States and in Europe using LCS in a beverage intervention among healthy, young adults.
Summarize publication patterns
A cumulative frequency chart of the number of publica-tions by outcome categories was produced to show the cumulative publication growth over time. As shown in Fig. 2, there is an increasing trend in the number of pub-lications reporting energy sensing and appetite-related outcomes from 1980 to 1995, and again from 2008 to 2014. The increasing interest of glycemic outcomes slo-wed down at 1991 and again spiked up at 2003. Up until 2014, there were larger cumulative numbers of publica-tions reporting energy sensing, appetite and glycemic outcomes compared to energy intake and body weight or body composition outcomes (Fig. 2).
Using a bubble plot to identify research gaps
A scatter plot is often used to identify relationships or pat-terns. A bubble plot is a variation of a weighted scatter plot, which was used here for the purpose of identifying research gaps. A bubble plot can graphically present mul-tiple categorical data on study characteristics in a single, two-dimension chart by displaying the evidence-map data according to specific, special locations defined by the x-axis and y-x-axis, as well as according to the color, shape or size of bubbles. In the construction of the bubble plot using data in the LCS evidence-map database, the unit of the analyses was the individual study. One study could be included multiple times in an analysis because each study could report multiple outcomes of interest.
visualization of each bubble (so that not all bubbles overlaid with each other). The sample size of each study is shown as the weight of the bubble. Therefore, a larger bubble represents a larger study sample size. In the first example, bubble plot data points are grouped and plot-ted by study duration and outcome categories. This ex-ample bubble plot shows that the majority of LCS studies are acute (<1 day in duration) and short-term (1 to 30 days in duration) studies for all outcome categor-ies, except for body weight or body composition out-comes. A majority of the studies report body weight or body composition outcomes with duration greater than 1 month (Fig. 3).
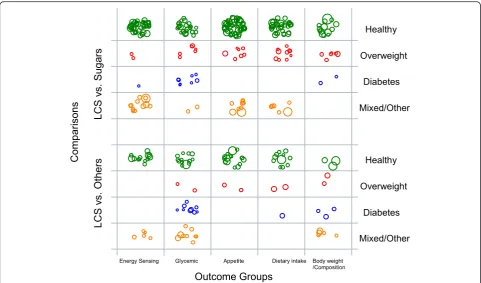
In the second example, bubble plot data points are grouped and plotted according to population health sta-tus and outcome categories. The plot is further stratified by two types of intervention and comparison designs: 1) LCS versus sugars (or vice versa) or 2) LCS versus other non-sugar comparisons (or vice versa) (Fig. 4). This ex-ample bubble plot shows that there are more studies in generally healthy populations compared to other popula-tion types across all outcome categories. The empty grids on the plot show that there is a lack of studies assessing appetite and dietary intake outcomes using a LCS intervention with a sugar intake comparison in people with diabetes. Most studies in people with
Table 4Study features of published LCS intervention studies (n= 208) and cohort studies (n= 17) by health outcome groups
Outcome group (number of studies)
Form of LCS intervention (number of studies)
Study design (number of studies)
Baseline health (number of studies)
Age group (mean) Sample size (mean) Country
(number of studies)
Appetite (84) Beverage (54), Food or meal (22), Supplement or oral rinse (8)
RCT-c (48), RCT-p (22), nRCT-c (11), nRCT-p (1), Single arm (1), unclear (1)
Healthy (66), Overweight/Obese (9), Mixed/other (9)
24.1 52 United States (41), Europe (31), Canada (9), Australia (3)
Alter energy sensing (75)
Beverage (58), Food or meal (10), Supplement or oral rinse (7)
RCT-c (48), RCT-p (10), nRCT-c (13), Single arm (3), unclear (1)
Healthy (54), Overweight/Obese (2), Diabetic (1),
Mixed/other (18)
26.1 47 United States (43), Europe (23), Canada (7), Asia (2)
Body weight or body composition (35)
Beverage (14), Food or meal (13), Supplement or oral (8)
RCT-c (7), RCT-p (25), nRCT-c (2), nRCT-p (1)
Healthy (17), Overweight/Obese (8), Diabetic (5),
Mixed/other (5)
35.6 92 United States (19), Europe (10), Asia (3), Africa (2), NR (1)
Body weight or body composition (17) cohort
Beverage (17) Cohort (17) Healthy (17) 32.0 15,430 United States (1), Europe (1)
Dietary Intake (62) Beverage (39), Food or meal (19), Supplement or oral rinse (4)
RCT-c (33), RCT-p (20), nRCT-c (5), nRCT-p (2) Single arm (2)
Healthy (43),
Overweight/Obese (12), Diabetic (1),
Mixed/other (6)
27.2 39 United States (29), Europe (22), Canada (9), Australia (1), NR (1)
Glycemic (76) Beverage (42), Food or meal (19), Supplement or oral rinse (14), Not reported (1)
RCT-c (51), RCT-p (21), nRCT-c (2), Single arm (2)
Healthy (39), Overweight/Obese (8), Diabetic (17), Mixed/other (12)
37.6 31 United States (28), Europe (27), Asia (8), Australia (7), Canada (3), Africa (1), Not reported (2)
NRNot reported,RCT-cRandomized controlled trial-crossover design,RCT-pRandomized controlled trial-parallel design,nRCT-cNon-randomized controlled trial-crossover design,nRCT-pNon-randomized controlled trial-parallel design
Table 3Summary of study design and population characteristics of the intervention in the evidence map
Intervention studies (n= 208)
Study design N(%) Population N(%)
RCT-c 119 (57.7) Adults 183 (88 %)
RCT-p 58 (27.9) Children 14 (7 %)
nRCT-c 21 (10.1) Adolescents 2 (1 %)
nRCT-p 2 (1.0) Mixed 6 (3 %)
Single arm 6 (2.9) Unsure 2 (1 %)
Unclear 1 (0.5) Baseline health N(%)
Length N(%) Healthy 140 (68 %)
< 1 day 124 (60.1) Overweight/ Obese
19 (9 %)
2 day-1 month 37 (17.8) Diabetic 17 (8 %)
1–6 months 30 (14.4) Mixed 14 (7 %)
6 months–1 year 1 (0.5) Other 17 (8 %)
> 1 year 7 (3.3) Age, Mean (Range) 31 (8–73)
Not reported 8 (3.8) BMI, Mean (Range) 25.6 (16.1–42.3)
Sample size, Mean (range)
48 (2–732) % Male 51 % (0–100 %)
Fig. 3Example bubble plot of LCS studies by intervention duration and outcome categories. Legends: Each bubble represents one single study. Bubble size corresponds to study sample size
diabetes reported body weight or body composition and glycemic outcomes. Among trials comparing LCS to sugar, there are a limited number of studies that investigated brain energy sensing outcomes in people who are over-weight or who have diabetes.
It is important to note that the research gaps identi-fied by the bubble plots do not necessarily equate to re-search needs. Besides the quantity and quality of the existing studies, the importance, desirability, feasibility, and potential impact of research gaps need to be con-sidered to determine the research needs. For example, while a research gap exists regarding LCS vs. sugar in-takes in diabetic populations, experts in this area would need to determine if there is a further need, given that individuals with diabetes need to limit their added sugars intake. The LCS evidence map database and ana-lyses presented here were an integral component of a Future Research Needs (FRN) assessment project. The stakeholder panel in this project was assembled to pro-vide input for the FRN project according to a frame-work for stakeholder engagement in patient-centered outcome research to identify research needs in the broad field of LCS and potential health-related out-comes [22].
Discussion
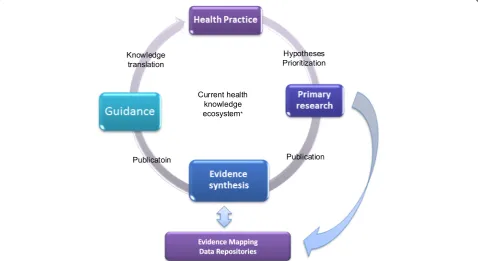
increasing with the steadily upward trends in the number of scientific publications every year. Thus, establishing multiple, open evidence-map databases for nutrition re-search sets the much needed foundations for evidence-based nutrition guidelines or policy development. Open evidence-map databases increase transparency and can fa-cilitate future updates. Evidence-map databases can be used to query what has been done based on a specific re-search question of interest in a broad area. Study charac-teristics can be summarized using the data in the evidence-map database to inform future study designs or to identify areas in need of more research with input from stake-holders. Conversely, evidence mapping can also help iden-tify areas rich in studies, for which systematic reviews and meta-analyses can be conducted. Such systematic reviews and meta-analyses may be used in evaluating the science for public nutrition policy recommendations (e.g., Dietary Guidelines for Americans). By using a systematically collected and organized knowledge base, Research funders, researchers and practitioners can easily query and analyze the evidence-map databases to acquire information neces-sary for decision-making, such as directions for future research and the basis for evidence synthesis in a fraction of the time needed to conduct comprehensive literature re-views. Subsequently the process of knowledge translation from scientific findings into health practice or policy rec-ommendations can be substantially shortened (Fig. 5).
Our LCS evidence-map database has several limita-tions. Due to limited resources, only the Medline® data-base was searched; thus the evidence-map datadata-base cannot be the sole source of data when used as the basis for a systematic review. We encourage future evidence map projects to include databases such as EMBASE, Cochrane, Scopus and other databases deemed appropri-ate to the research question. With more databases searched, it is expected that the number of abstracts and full-text articles to be screened will rise substantially. Hence, it is important to evaluate the project feasibility by looking at the number of search hits at the beginning of the project. Regardless of the comprehensive search strategy, it is likely we missed studies that did not include key LCS or outcome terms in the abstract or keywords. Our effort in addressing this limitation included cross-referencing studies cited from published LCS systematic reviews with our database, as well as conducting several supplemental searches to include additional key search terms. Furthermore, it is important to note again that evidence maps do not include quality (risk of bias) appraisal of the included studies. Thus, there can be a high volume of poor quality research and more research is still needed despite this high volume. There is a growing interest in engaging stakeholders in evidence synthesis processes for the potential benefits of improving relevant, enhancing quality, and increasing
dissemination and uptake of evidence-based findings [21]. In this project, the iterative nature for defining outcomes of interest with input from the stakeholders inevitably cre-ated some subjectivity and uncertainties in the compre-hensiveness of the search strategies because not all search terms were pre-defined according to the standards for conducting a systematic review. However, we could also argue that the stakeholders’ input helped strengthen a claim of comprehensiveness in capturing all important re-search areas of interest. Initially 12,830 citations were identified for further review, while using additional terms from the stakeholder panel, another 4400 citations were identified. This represents 34 % additional citations. Thus, the iterative and collaborative nature of the process is not a limitation, but rather strength for providing new dimen-sions to the subject. Future work should identify concrete criteria for evaluating the effectiveness of different methods, timing, and intensity of stakeholder engagement.
Conclusion
Evidence mapping is a replicable evidence-based approach to identify, collect and evaluate the characteristics of pub-lished studies. The methodology is systematic and requires less time and effort than a systematic review to achieve an understanding and distribution of evidence. Evidence mapping can also be used to identify both research gaps, as well as areas of opportunity for systematic reviews. An open evidence-map database has the potential to promote knowledge translation from nutrition science to policy. To achieve this ultimate goal, continuous updating, data qual-ity control and validation would be required.
Additional files
Additional file 1: Table S1.LCS search strategy and supplemental search strategy. Supplemental material. Low-calorie sweetener database manual and codebook. (DOCX 75 kb)
Additional file 2:LCS Database Manual and Codebook. (DOCX 56 kb)
Abbreviation
LCS:low-calorie-sweeteners.
Competing interests
The authors have no competing interests.
Authors’contributions
DW and MC drafted the manuscript. MC designed and conceptualized this project, obtained funding, and provided administrative support. DW conducted the data analysis. MSW, OB and DW collected and extracted study data. OB coordinated the stakeholder engagement. MC, JPS, MSW and OB critically commented and revised the manuscript. JPS is one of the stakeholder panel members. All authors read and approved the final version of the manuscript.
Acknowledgement
We thank our stakeholder panel for their tremendous contribution toward this project. Panel members include: Sara Bleich, Andrew Bremer, Marion Franz, John Foreyt, Guy Johnson, Beth Manning, Rick Mattes, Allison Sylvetsky Meni, Scott Parrott, Xavier Pi-Sunyer, Babara Schneeman, Joanne Spahn, Dan
Steffen, and Paula Ziegler. This study was supported by the International Life Sciences Institutes (ILSI) North America.
Author details
1Department of Public Health and Community Medicine, Tufts University
School of Medicine, Boston, MA, USA.2Department of Interdisciplinary Studies, Rutgers University School of Health Related Professions, Newark, NJ, USA.
Received: 3 September 2015 Accepted: 21 December 2015
References
1. Althuis MD, Weed DL. Evidence mapping: methodologic foundations and application to intervention and observational research on sugar-sweetened beverages and health outcomes. Am J Clin Nutr. 2013;98(3):755–68. doi:10.3945/ajcn.113.058917.
2. Hetrick SE, Parker AG, Callahan P, Purcell R. Evidence mapping: illustrating an emerging methodology to improve evidence-based practice in youth mental health. J Eval Clin Pract. 2010;16(6):1025–30. doi:10.1111/j.1365-2753. 2008.01112.x.
3. Dahabreh IJ, Hadar N, Chung M. Emerging magnetic resonance imaging technologies for musculoskeletal imaging under loading stress: scope of the literature. Ann Intern Med. 2011;155(9):616–24. doi:10.7326/0003-4819-155-9-201111010-00009.
4. Sniltsveit BVM, Bhavsar A, Gaarder M. Evidence gap maps–a tool for promoting evidence-informed policy and prioritizing future research. The World Bank 2013. 5. 3Ie. International Initiative for Impact Evaluation. Evidence Gap Maps. 2015. http://www.3ieimpact.org/en/evaluation/evidence-gap-maps/. Accessed 8 Aug 2015.
6. Bragge P, Clavisi O, Turner T, Tavender E, Collie A, Gruen RL. The Global Evidence Mapping Initiative: scoping research in broad topic areas. BMC Med Res Methodol. 2011;11:92. doi:10.1186/1471-2288-11-92. 7. Grant MJ, Booth A. A typology of reviews: an analysis of 14 review types
and associated methodologies. Health Inf Libr J. 2009;26(2):91–108. doi:10. 1111/j.1471-1842.2009.00848.x.
8. Chapman E, Reveiz L, Chambliss A, Sangalang S, Bonfill X. Cochrane systematic reviews are useful to map research gaps for decreasing maternal mortality. J Clin Epidemiol. 2013;66(1):105–12. doi:10.1016/j.jclinepi.2012.09.005. 9. Hempel S, Taylor SL, Marshall NJ, Miake-Lye IM, Beroes JM, Shanman R, et al.
VA evidence-based synthesis program reports. Evidence map of mindfulness. Washington (DC): Department of Veterans Affairs (US); 2014. 10. Hempel S, Taylor SL, Solloway MR, Miake-Lye IM, Beroes JM, Shanman R,
et al. VA evidence-based synthesis program reports. Evidence map of Tai Chi. Washington (DC): Department of Veterans Affairs (US); 2014.
11. Arksey H, O’Malley L. Scoping studies: towards a methodological framework. Int J Soc Res Methodol. 2005;8:19–32.
12. Schmucker C, Motschall E, Antes G, Meerpohl JJ. Methods of evidence mapping. A systematic review. Bundesgesundheitsblatt, Gesundheitsforschung, Gesundheitsschutz. 2013;56(10):1390–7. doi:10.1007/s00103-013-1818-y. 13. Daudt HM, van Mossel C, Scott SJ. Enhancing the scoping study methodology:
a large, inter-professional team’s experience with Arksey and O’Malley’s framework. BMC Med Res Methodol. 2013;13:48. doi:10.1186/1471-2288-13-48. 14. Swithers SE. Artificial sweeteners produce the counterintuitive effect of
inducing metabolic derangements. Trends Endocrinol Metab. 2013;24(9): 431–41. doi:10.1016/j.tem.2013.05.005.
15. Miller PE, Perez V. Low-calorie sweeteners and body weight and composition: a meta-analysis of randomized controlled trials and prospective cohort studies. Am J Clin Nutr. 2014;100(3):765–77. doi:10.3945/ajcn.113.082826.
16. Gibson SD, Hill J, Raben AB, Tuorila H, Widstrom E. Consensus statement on benefits of low-calorie sweeteners. Nutr Bull. 2014;39(4):386–9.
17. Wallace BC, Small K, Brodley CE, Lau J, Trikalinos TA. Deploying an interactive machine learning system in an evidence-based practice center: abstrackr. In: Proc of the ACM International Health Informatics Symposium (IHI). 2012. p. 819–24.
18. Wang DD, Shams-White M, Bright OJ, Chung M. Low calorie-sweeteners and health. 2015. http://srdr.ahrq.gov/projects/588. Accessed Aug 25 2015. 19. McKeown N, Chung M, Livingston K, Sawicki C, Wang DD, Brown C. Dietary
20. Chung M, Berger S, Wang DD, Brown C, Ma J, Sackey J. Sugars and health– evidence map. 2014. http://srdr.ahrq.gov/projects/136. Accessed Aug 25 2015.
21. Cottrell E, Whitlock E, Kato E, Uhl S, Belinson S, Chang C, et al. Defining the benefits of stakeholder engagement in systematic reviews. Rockville (MD): AHRQ Methods for Effective Health Care; 2014.
22. Carey TS, Sanders GD, Viswanathan M, Trikalinos TA, Kato E, Chang S. Framework for considering study designs for future research needs. Rockville (MD). 2012.
• We accept pre-submission inquiries
• Our selector tool helps you to find the most relevant journal
• We provide round the clock customer support
• Convenient online submission
• Thorough peer review
• Inclusion in PubMed and all major indexing services
• Maximum visibility for your research
Submit your manuscript at www.biomedcentral.com/submit