R E S E A R C H
Open Access
Gender difference in handgrip strength of
Italian children aged 9 to 10 years
Tiziana Montalcini
1*, Yvelise Ferro
2, Maria Antonietta Salvati
1, Stefano Romeo
2,4, Roberto Miniero
3and Arturo Pujia
2Abstract
Background:Handgrip strength is an index of nutritional status which correlates to morbidity and mortality in young. It differs in adults and adolescents between gender. However, it is no clear whether a difference exists also in children aged 9 to 10 years, and which are the factors influencing it. Furthermore, data of Handgrip strength of Italian schoolchildren are lacking. Aim of this study was to provide Handgrip strength value from a sample of healthy Italian schoolchildren aged 9 to 10 years and to determine which factors affect grip strength at this age. Methods:We enrolled 137 children (boysn=66; girlsn= 71) who underwent a body mass index and Handgrip strength measurement. Handgrip strength was assessed by an hydraulic hand dynamometer.
Results:The mean handgrip strength value was 13.8 ± 4.0 for girls and 15.2 ± 3.0 kg for boys (p= 0.04) thus, we found a significant difference between gender. We have not found a significant differences in anthropometric parameters between gender. In the univariate analysis Handgrip strength was associated with age, BMI, height, weight and gender (p< 0.001 for age,p< 0.001 for BMI,p< 0.001 for height,p< 0.001 for weight andp< 0.04 for gender). The Multivariate linear regression analysis showed that age, BMI and gender were all correlated to grip force. Conclusion:We found a significant difference in grip strength between healthy Italian schoolchildren aged 9 to 10 years. This parameter seems to be primarily influenced by gender. Our investigation is important since currently data regarding the reference values of HGS for Italian children are lacking.
Keyword:Handgrip strength, Dynamometer, Nutrition, Children, Early phase of puberty
Background
Physical fitness has been identified as a predictor of morbidity [1–3] and mortality [4] in the young.
In particular, muscular fitness has been proven to be associated with insulin sensitivity in both children and adolescents [5] which, in turn, is linked to the future risk of type 2 diabetes mellitus (T2DM) in adulthood [6]. The role of a good muscular fitness has been also well recognised in the prevention of several chronic disease [7]. In this regard, Handgrip Strength (HGS) is an index of muscular fitness, also commonly used in both adults and youths as a marker of nutritional status [8]. In fact, an association between some micronutrient deficiencies, which are common in European young people [9], and HGS has been found [10]. Furthermore, this parameter correlates to several disease and clinical complications
[11–14] and can predict mortality in both adults and youths [4, 15, 16].
Currently, there are different investigations proposing reference values for HGS [4, 17–20], and some of which have been performed exclusively in young Europeans [18–20]. Unfortunately, there is insufficient of data for European schoolchildren aged 9 to 10 years, especially Italian [18, 19]. Nevertheless the IDEFICS study was per-formed in European children, including those from Italy, HGS was provided only for girls and boys at age 9 [18]. The ELENA study examined HGS in a large cohort of young people from several European countries, but they were aged over 12 years [19]. Other investigations pro-vided the HGS value of only Spanish [20, 21] or Estonian children [22] aged 9 to 10 years. Reference values are ne-cessary to identify children with malnutrition or at risk of other clinical complications and to plan appropriate therapeutic interventions.
* Correspondence:tmontalcini@unicz.it
1Nutrition Unit, Department of Experimental and Clinical Medicine, University
Magna Grecia, Catanzaro 88100, Italy
Full list of author information is available at the end of the article
Furthermore, it has been suggested that several an-thropometric and body composition variables could have a role in influencing HGS, but the most important is currently unclear. Some authors highlighted the influ-ence of body height on HGS in the early stage of pu-berty, especially in boys. [23, 24] A parallel increase of HGS has been also demonstrated with age [18, 20], that seems largely dependent on the increase in body mass index (BMI) and, particularly, muscle mass [25]. How-ever, this could simply reflect the sexual dimorphism [26], due to the action of sex steroid hormones.
Consequently, since there is no data on the HGS for Italian schoolchildren aged 9 to 10 years, in this investi-gation we sought to measure HGS values in apparently healthy Italian children aged 9 to 10 years. Furthermore, in this study we investigated which factors, also includ-ing anthropometric factors, affect HGS at this age.
Methods
Two hundred Italian boys and girls volunteers from one primary public school were invited to participate in this observational study. Following agreement with the schools, anthropometric measurements and an HGS as-sessment were performed after parental consent ob-tained via letter which explained aims and procedures of the study. We planned to exclude those with clinical evi-dence of debilitating diseases and those practicing com-petitive sport.
Thus, parents were requested to inform the researchers of any clinical condition or illness affecting participants or, alternatively, to exclude their son from the study participa-tion. A total of 63 children refused to participate in the study without explanations from their parents; We there-fore enrolled 137 children (boys:n=66; girls:n= 71) who underwent an anthropometric assessment. The investiga-tion conforms to the principles outlined in the Declarainvestiga-tion of Helsinki. Written informed consent was obtained from each individual and patient’s legal surrogate. Since the study design (cross-sectional) it was not necessary to con-sult the local ethics committee.
Anthropometric measurements
All tests were performed in a dedicated room after a 12 h overnight fasting. Body weight was measured with the subjects lightly dressed, subtracting the weight of clothes. Body weight was measured with a calibrated scale and height measured with a wall-mounted stadi-ometer and were recorded to the nearest 0.1 kg and 1 mm respectively. BMI was calculated with the follow-ing equation: weight (kg)/height (m)2.
HGS measurement
The maximal HGS was measured by dieticians previ-ously trained in the technique. The HGSwas measured
using an hydraulic hand dynamometer (Hersteller/ manufactures; SAEHAN Corporation, Masan-Korea; Distributor Rehaforum Medical GmbH, Elmshorn-Germany) having less than 10 % variation in results for various grip positions. Subjects were seated, with their elbows flexed at 90° and supported at the time of the measurement. Children was instructed to squeeze the dynamometer as strong as possible by each hand, for three consecutive times and the highest value (maximal value in kilograms), was used for the analyses [27].
Statistical analysis
Data are reported as mean ± (SD). A t-test was per-formed to compare the means between gender.
The Pearson correlation was used to identify the vari-ables correlated to the HGS given that the continuous variables were normally distributed according to the Kolmogorov-Smirnov test (age, weight, height, BMI). The Multivariate linear regression analysis was used to test the association between HGS and the variables se-lected among all that, in the univariate analysis, corre-lated with HGS with a p< 0.1. To better understand which factors were associated to HGS, in a first model we included BMI as independent variables, while in a second model we replace BMI with weight and height. Significant differences were assumed to be present at p< 0.05 (two-tailed). All comparisons were performed using SPSS 20.0 for Windows (IBM Corporation, New York, NY, United States).
Results
The mean HGSvalue was 13.8 ± 4.0 for girls and 15.2 ± 3.0 kg for boys kg (p= 0.04). The characteristics of the population according to gender are shown in Table 1. None of them practiced activities affecting our assessment.
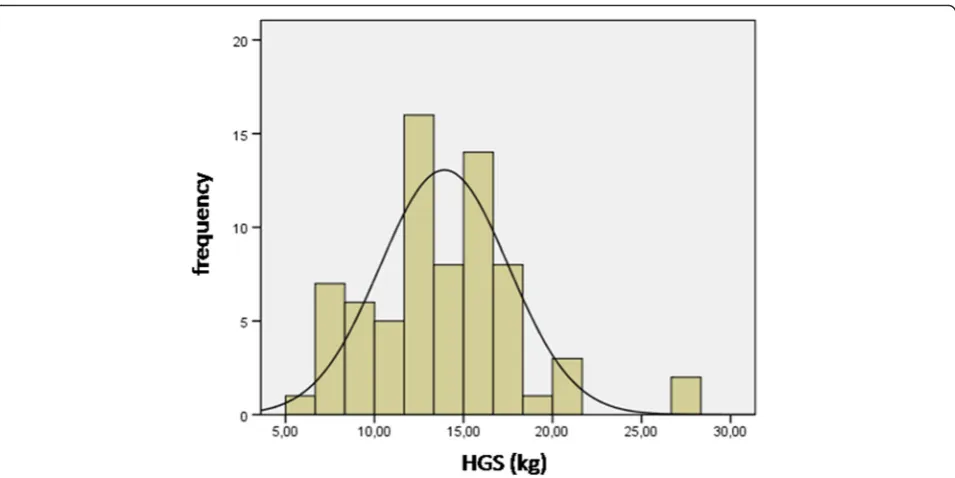
Figures 1 and 2 shown normal distribution of HGS for girls and boys, respectively.
Table 2 shows the factors associated with the HGS (p< 0.001 for age, p< 0.001 for BMI,p< 0.001 for height, p< 0.001 for weight and p< 0.04 for gender). The
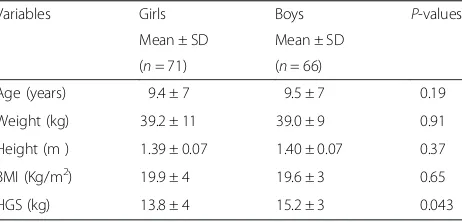
Table 1Anthropometric characteristics and handgrip strength value of the subjects
Variables Girls Boys P-values
Mean ± SD Mean ± SD (n= 71) (n= 66)
Age (years) 9.4 ± 7 9.5 ± 7 0.19
Weight (kg) 39.2 ± 11 39.0 ± 9 0.91
Height (m ) 1.39 ± 0.07 1.40 ± 0.07 0.37
BMI (Kg/m2) 19.9 ± 4 19.6 ± 3 0.65
HGS (kg) 13.8 ± 4 15.2 ± 3 0.043
Multivariate linear regression analysis (Table 3) showed that age, BMI and gender were all correlated to HGS (Model I:p< 0.001 for age,p< 0.001 for BMI andp< 0.04 for gender). When we replace BMI with weight and height, the association with gender disappeared (model II: p< 0.001 for age, p< 0.001 for height, p< 0.001 and for weight).
Discussion
In this investigation we provided the maximum HGS value of apparently healthy Italian schoolchildren girls and boys aged 9 to 10 years. Furthermore, as expected, we demonstrated a significant difference in HGS performance between gender (Table 1). We also found an association between HGS and age, gender and
Fig. 1Normal distribution of HGS for girls. Legend- HGS, handgrip strength; Kg, kilogram
anthropometric variables such as BMI, height and weight (Tables 2 and 3).
Our investigation is important since, currently, there is scarcity of data regarding the reference values for HGS in European children aged 9 to 10 years, especially Italian.
The availability of reference values assumes import-ance in a number of conditions. HGS is used as index of physical fitness in children [1–4]. Physical activity plays a key role in the normal growth during the first phase of life and for the psycho-social maturation of the young [28] and physical fitness is a predictor of morbidity [1– 3]. HGS is a nutritional status index [8, 10, 29, 30] and is useful for investigating patients with neuromuscular disease [31]. Moreover, HGS is a predictor of mortality in youth [4]. Therefore, the availability of normative data for HGS could help to identify those children needing special dietary or pharmacological treatments or those at high risk of clinical complications [11–14].
In line with other investigations, like EUROFIT [20] and CHMS [17], we measured the maximal HGS, while in the IDEFICS [18] and HELENA [19] studies the au-thors used the mean value between hands. However, both methods were found to be highly consistent with no statistically significant difference [27]. Our HGS values were similar to those of EUROFIT [20] and IDE-FICS [18]. On the contrary, as expected, our result was very different from those of CHMS, performed in Can-adian children with an HGS value between 24 and 27 kg in boys and between 21 and 24 in girls aged 8–10 years old [17]. This finding reinforces the importance of hav-ing a reference value for different populations.
An important finding of our investigation was the sig-nificantly greater maximal HGS in boys than in girls. In this regard, we found, in the whole population, an HGS value of 13.8 ± 4.0 in girls and 15.2 ± 3.0 kg in boys (Table 1). Our results were similar to those of the EUROFIT study, in which the maximal HGS was 14.1 ± 2 in girls and 15.7 ± 3 kg in boys at age 9 and 17.1 ± 3 in girls and 16 ± 3 kg in boys at age 10 [20]. Even in the CHMS, Helena and IDEFICS studies, a sex-dependent difference was found [17–19]. Nevertheless it has been demonstrated that sex- and age- dependent differences in HGS disappears when HGS is normalised for fat-free mass [25], the most import factor influencing HGS seems to be still gender or, specifically, sex hormones. In fact, fat-free mass, in turn, is linked to the sex hormones and is more represented in boys than in girls [25]. In this regard, it is well known that sexual dimorphism in body composition is largely due to the action of sex steroid hormones [26]. An important concept is that sex differ-ence in body composition is manifest from foetal life and, in children, a significant difference in estradiol and testosterone is evident before the external signs of pu-berty appear [32], probably leading to a difference in HGS. Interestingly, a specific sexually dimorphic re-sponse to maternal diet was observed in the placenta [33]. Placenta reacts differently to the same environment depending on the sex of the foetus [33, 34]. All together, these studies confirm the validity of our data and suggest a different response early in life between gender leading to a different body composition and HGS. According with this assumption, we did not find a significant differ-ence in anthropometric parameters (height, body mass and BMI) between genders (Table 1).
Previous investigations demonstrated that HGS is positively correlated with weight, height and body sur-face area [23, 35] and that, in the early phase of puberty, body height could be a key factor influencing HGS [24]. Our results are in line with these previous findings. In
Table 3Multivariate linear regression analysis-factors associated with HGS
Dependent variable B SE β p 95 % CI Tolerance VIF
HGS Upper limit Lower limit
Independent variables
Model I
Age 2.08 0.37 0.39 <0.001 1.34 2.82 0.98 1.01
BMI 0.35 0.06 0.39 <0.001 0.23 0.48 0.99 1.00
Gender 1.13 0.56 0.14 0.047 0.01 2.25 0.98 1.01
Model II
Age 1.13 0.39 0.21 <0.001 0.36 1.90 0.76 1.30
Height 15.16 4.77 0.29 <0.001 5.73 24.6 0.49 2.02
Weight 0.12 0.03 0.33 <0.001 0.06 0.18 0.60 1.64
Exclude variables in Model II: gender
BMIBody mass index,HGSHandgrip strength,VIFVariance inflation factor
Table 2Pearson’s correlations-factors correlated with HGS
Variables Age Weight Height BMI Gender
HGS r 0.41 0.55 0.59 0.39 0.17
p <0.001 <0.001 <0.001 <0.001 0.04
fact, when we included in the multivariable analysis, as independent variable body height and weight, in place of BMI, the gender factor disappeared (Table 3). However, the height of children is considered an index of their sexual maturity [36]. Thus, again, the most import factor influencing HGS could be gender.
Also the age-dependent increase in HGS, previously described [18, 20] can be attributed to hormonal changes over time [37], nevertheless in boys, growth hormone and testosterone have more effects on HGS than in girls [37].
Our study highlights the need to have a reference value for HGS useful to plan interventions aimed at im-proving fitness in children, especially in those with a low HGS. Components of prenatal, prepubertal and pubertal growth have long-term consequences for midlife HGS [38]. Early interventions that facilitate building muscle mass could also prevent morbidity and mortality in later life [39–41].
Unfortunately, measuring HGS is not commonly prac-ticed in pediatric population, despite the low cost and portability of the device, thus, our study suggests to im-plement the measure HGS.
We should mention some limitations of this study. First, our findings should be interpreted with caution, due to the place where they originated. However, this in-vestigation was carried out on representative samples of the Italians children potentially increasing knowledge on this issue from a geographical perspective. In addition, we did not performed the nutrient intake assessment or used any questionnaires evaluating performance status in this sample and a medical examination was not car-ried out. We sought to facilitates the participation of the children. However, parents were requested to inform the researchers of any clinical condition affecting partici-pants or, alternatively, to exclude their son from the study. It was possible that this fact affected data. How-ever, a total of 63 children excluded themselves from the study, probably on the basis of our exclusion criteria. Nevertheless data on the physical activity are lacking, in this study we excluded those practicing competitive sport but included those practicing a recreational sport, since it could be assuming a relevant influence on HGS only in the first [42]. Of course, other unmeasured con-founders could exist explaining the observed associa-tions. Finally, our study is limited by its small size. However, the statistical analysis is adequate. Our results were not purely random as established by a previous in-vestigation [20, 21] and were confirmed by multiple stat-istical analyses.
Conclusion
In this investigation, we found a significant difference in HGS between apparently healthy Italian schoolchildren
girls and boys aged 9 to 10 years. HGS seems to be pri-marily influenced by gender. Our investigation is import-ant since currently data regarding the reference values for HGS in Italian children at this age are lacking, thus we provided reference values.
Competing interest
There authors declare that they have no competing interest.
Authors’contributions
TM and AP were responsible for study design, data analysis, manuscript writers and approved the final version. MAS and YF performed enrollment, instrumental assessment, were responsible for integrity of data. RM and SR contributed to interpretation of the data and approved final version. All authors read and approved the final manuscript.
Acknowledgments
The authors gratefully acknowledge all participating children, their parents, teachers and the Headmaster Concetta Carrozza of the“Casalinuovo Comprehensive Institute”for their collaboration.
Funding
No funding.
Author details
1Nutrition Unit, Department of Experimental and Clinical Medicine, University
Magna Grecia, Catanzaro 88100, Italy.2Nutrition Unit, Department of Medical and Surgical Science, University Magna Grecia, Catanzaro 88100, Italy.
3
Pediatric Unit, Department of Medical and Surgical Science, University Magna Grecia, Catanzaro 88100, Italy.4Metabolic Disease Unit, Department of
Molecular and Clinical Medicine, University of Gothenburg, Gothenburg 40530, Sweden.
Received: 13 October 2015 Accepted: 12 February 2016
References
1. Ortega FB, Ruiz JR, Castillo MJ, Sjostrom M. Physical fitness in childhood and adolescence: a powerful marker of health. Int J Obes (Lond). 2008;32:1–11. 2. Vicente-Rodriguez G, Urzanqui A, Mesana MI, Ortega FB, Ruiz JR, Ezquerra J,
et al. Physical fitness effect on bone mass is mediated by the independent association between lean mass and bone mass through adolescence: a cross-sectional study. J Bone Miner Metab. 2008;26:288–94.
3. Artero EG, Ruiz JR, Ortega FB, Espana-Romero V, Vicente-Rodriguez G, Molnar D, et al. Muscular and cardiorespiratory fitness are independently associated with metabolic risk in adolescents: the HELENA study. Pediatr Diabetes. 2011;2:704–12.
4. Ortega FB, Silventoinen K, Tynelius P, Rasmussen F. Muscular strength in male adolescents and premature death: cohort study of one million participants. BMJ. 2012;345, e7279.
5. Benson AC, Torode ME, Singh MA. Muscular strength and cardiorespiratory fitness is associated with higher insulin sensitivity in children and adolescents. Int J Pediatr Obes. 2006;1:222–31.
6. Sabin MA, Magnussen CG, Juonala M, Shield JP, Kähönen M, Lehtimäki T, et al. Insulin and BMI as predictors of adult type 2 diabetes mellitus. Pediatrics. 2015;35:e144–51.
7. Wolfe RR. The underappreciated role of muscle in health and disease. Am J Clin Nutr. 2006;84:475–82.
8. Schlüssel MM, Anjos LA, Kac G. Hand grip strength test and its use in nutritional assessment. Rev Nutr. 2008;21:223–5.
9. Moreno LA, Gottrand F, Huybrechts I, Ruiz JR, González-Gross M, DeHenauw S, et al. Nutrition and lifestyle in european adolescents: the HELENA study. Adv Nutr. 2014;5:615S–23.
10. Valtueña J, Gracia-Marco L, Huybrechts I, Breidenassel C, Ferrari M, Gottrand F, et al. Cardiorespiratory fitness in males, and upper limbs muscular strength in females, are positively related with 25-hydroxyvitamin D plasma concentrations in European adolescents: the HELENA study. QJM. 2013;106: 809–21.
12. Snow-Harter C, Bouxsein M, Lewis B, Charette S, Weinstein P, Marcus R. Muscle strength as a predictor of bone mineral density in young women. J Bone Miner Res. 1990;5:589–95.
13. Lamprinoudi T, Mazza E, Ferro Y, Brogneri S, Foti D, Gulletta E, et al. The link between nutritional parameters and bone mineral density in women: results of a screening programme for osteoporosis. J Transl Med. 2014;12:46. doi:10.1186/1479-5876-12-46.
14. Webb AR, Newman LA, Taylor M, Keogh JB. Hand grip dynamometry as a predictor of postoperative complications reappraisal using age standardized grip strengths. JPEN. 1989;13:30–3.
15. Sasaki H, Kasagi F, Yamada M, Fujita S. Grip strength predicts cause-specific mortality in middle-aged and elderly persons. Am J Med. 2007;120:337–42. 16. Leong DP, Teo KK, Rangarajan S, Lopez-Jaramillo P, Avezum AJ, Orlandini A,
et al. Prospective Urban Rural Epidemiology (PURE) Study investigators. Prognostic value of grip strength: findings from the Prospective Urban Rural Epidemiology (PURE) study. Lancet. 2015;386:266–73.
17. Tremblay MS, Shields M, Laviolette M, Craig CL, Janssen I, Connor GS. Fitness of Canadian children and youth: results from the 2007–2009 Canadian Health Measures Survey. Health Rep. 2010;21:7–20.
18. De Miguel-Etayo P, Gracia-Marco L, Ortega FB, Intemann T, Foraita R, Lissner L, et al. Physical fitness reference standards in European children: the IDEFICS study. Int J Obes (Lond). 2014;38 Suppl 2:57–66.
19. Ortega FB, Artero EG, Ruiz JR, España-Romero V, Jiménez-Pavón D, Vicente-Rodriguez G. Physical fitness levels among European adolescents: the HELENA study. Br J Sports Med. 2011;45:20–9.
20. Gulías-González R, Sánchez-López M, Olivas-Bravo Á, Solera-Martínez M, Martínez-Vizcaíno V. Physical fitness in Spanish schoolchildren aged 6–12 years: reference values of the battery EUROFIT and associated cardiovascular risk. J Sch Health. 2014;84:625–35.
21. Castro-Pineiro J, Ortega FB, Keating XD, Gonzalez-Montesinos JL, Sjostrom M, Ruiz JR. Percentile values for aerobic performance running/walking field tests in children aged 6 to 17 years: influence of weight status. Nutr Hosp. 2011;26:572–8.
22. Semproli S, Brasili P, Toselli S, Ventrella AR, Jürimäe J, Jürimäe T. The influence of anthropometric characteristics to the handgrip and pinch strength in 6-10-year old children. Anthropol Anz. 2007;65:293–302. 23. Jürimäe T, Hurbo T, Jürimäe J. Relationship of handgrip strength with
anthropometric and body composition variables in prepubertal children. Homo. 2009;60:225–38.
24. Hogrel JY, Decostre V, Alberti C, Canal A, Ollivier G, Josserand E, et al. Stature is an essential predictor of muscle strength in children. BMC Musculoskelet Disord. 2012;13:176. doi:10.1186/1471-2474-13-176. 25. Sartorio A, Lafortuna CL, Pogliaghi S, Trecate L. The impact of gender, body
dimension and body composition on handgrip strength in healthy children. J Endocrinol Invest. 2002;431–5.
26. Loomba-Albrecht LA, Styne DM. Effect of puberty on body composition. Curr Opin Endocrinol Diabetes Obes. 2009;16:10-5.
27. Haidar SG, Kumar D, Bassi RS, Deshmukh SC. Average versus maximum grip strength: which is more consistent? J Hand Surg (Br). 2004;29:82–4. 28. Tomporowski PD, Lambourne K, Okumura MS. Physical activity interventions
and children’s mental function: an introduction and overview. Prev Med. 2011;52 Suppl 1:3–9.
29. Flood A, Chung A, Parker H, Kearns V, O’Sullivan TA. The use of hand grip strength as a predictor of nutrition status in hospital patients. Clin Nutr. 2014;33:106–14.
30. White JV, Guenter P, Jensen G, Malone A, Schofield M. Consensus statement: Academy of Nutrition and Dietetics and American Society for Parenteral and Enteral Nutrition: characteristics recommended for the identification and documentation of adult malnutrition (undernutrition). JPEN J Parenter Enteral Nutr. 2012;36:275–83.
31. Wiles CM, Karni Y, Nicklin J. Laboratory testing of muscle function in the management of neuromuscular disease. J Neurol Neurosurg Psychiatry. 1990;53:384–7.
32. Tarrade A, Rousseau-Ralliard D, Aubrière MC, Peynot N, Dahirel M, Bertrand-Michel J, et al. Sexual dimorphism of the feto-placental phenotype in response to a high fat and control maternal diets in a rabbit model. Plos One. 2013;8, e83458. doi:10.1371/journal.pone.0083458.
33. Garnett SP, Högler W, Blades B, Baur LA, Peat J, Lee J, et al. Relation between hormones and body composition, including bone, in prepubertal children. Am J Clin Nutr. 2004;80:966–72.
34. Chen PY, Ganguly A, Rubbi L, Orozco LD, Morselli M, Ashraf D, et al. Intrauterine calorie restriction affects placental DNA methylation and gene expression. Physiol Genomics. 2013;45:565–76.
35. Chatterjee S, Chowdhuri BJ. Comparison of grip strength and isometric endurance between the right and left hands of men and their relationship with age and other physical parameters. J Hum Ergol. 1991;20:41–5. 36. Tanner JM, Goldstein H, Whitehouse RH. Standards for children’s height at
ages 2–9 years allowing for heights of parents. Arch Dis Child. 1970;45:755–62. 37. Neu CM, Rauch F, Rittweger J, Manz F, Schoenau E. Influence of puberty on muscle development at the forearm. Am J Physiol Endocrinol Metab. 2002; 283:E103–7.
38. Kuh D, Hardy R, Butterworth S, Okell L, Wadsworth M, Cooper C, et al. Developmental origins of midlife grip strength: findings from a birth cohort study. J Gerontol A Biol Sci Med Sci. 2006;61:702–6.
39. Rudolph M, Kroll F, Beery M, Marinda E, Sobiecki JF, Douglas G, et al. A pilot study assessing the impact of a fortified supplementary food on the health and well-being of crèche children and adult TB patients in South Africa. PLoS One. 2013;8, e55544. doi:10.1371/journal.pone.0055544.
40. Kulkarni B, Hills AP, Byrne NM. Nutritional influences over the life course on lean body mass of individuals in developing countries. Nutr Rev. 2014;72: 190–204.
41. Battjes-Fries MC, Haveman-Nies A, Renes RJ, Meester HJ, van t’Veer P. Effect of the Dutch school-based education programme‘Taste Lessons’on behavioural determinants of taste acceptance and healthy eating: a quasi-experimental study. Public Health Nutr. 2015;18:2231.
42. Grants S, Haler T, Davies C, Aitcheson TC, Wilson J, Whittaker A. A comparison of the anthropometric, strength, endurance and flexibility characteristics of female elite and recreational climbers and non-climbers. J Sports Sci. 2001;19:499–500.
• We accept pre-submission inquiries
• Our selector tool helps you to find the most relevant journal
• We provide round the clock customer support
• Convenient online submission
• Thorough peer review
• Inclusion in PubMed and all major indexing services
• Maximum visibility for your research
Submit your manuscript at www.biomedcentral.com/submit