R E S E A R C H
Open Access
DAWN: a framework to identify autism genes
and subnetworks using gene expression and
genetics
Li Liu
1, Jing Lei
1, Stephan J Sanders
2,3, Arthur Jeremy Willsey
2,3, Yan Kou
4,5, Abdullah Ercument Cicek
6,
Lambertus Klei
7, Cong Lu
1, Xin He
6, Mingfeng Li
8,9, Rebecca A Muhle
3,8,10, Avi Ma’ayan
5, James P Noonan
3,8,
Nenad Šestan
8,9, Kathryn A McFadden
11, Matthew W State
2,3,9,12,13, Joseph D Buxbaum
4,14, Bernie Devlin
7and Kathryn Roeder
1,6*Abstract
Background: De novoloss-of-function (dnLoF) mutations are found twofold more often in autism spectrum disorder (ASD) probands than their unaffected siblings. Multiple independent dnLoF mutations in the same gene implicate the gene in risk and hence provide a systematic, albeit arduous, path forward for ASD genetics. It is likely that using additional non-genetic data will enhance the ability to identify ASD genes.
Methods: To accelerate the search for ASD genes, we developed a novel algorithm, DAWN, to model two kinds of data: rare variations from exome sequencing and gene co-expression in the mid-fetal prefrontal and
motor-somatosensory neocortex, a critical nexus for risk. The algorithm casts the ensemble data as a hidden Markov random field in which the graph structure is determined by gene co-expression and it combines these interrelationships with node-specific observations, namely gene identity, expression, genetic data and the estimated effect on risk.
Results: Using currently available genetic data and a specific developmental time period for gene co-expression, DAWN identified 127 genes that plausibly affect risk, and a set of likely ASD subnetworks. Validation experiments making use of published targeted resequencing results demonstrate its efficacy in reliably predicting ASD genes. DAWN also successfully predicts known ASD genes, not included in the genetic data used to create the model. Conclusions: Validation studies demonstrate that DAWN is effective in predicting ASD genes and subnetworks by leveraging genetic and gene expression data. The findings reported here implicate neurite extension and neuronal arborization as risks for ASD. Using DAWN on emerging ASD sequence data and gene expression data from other brain regions and tissues would likely identify novel ASD genes. DAWN can also be used for other complex disorders to identify genes and subnetworks in those disorders.
Keywords: Autism, Risk prediction, Gene discovery, Weighted gene co-expression network analysis, Network, Hidden Markov random field, Neurite extension, Neuronal arborization
*Correspondence: roeder@stat.cmu.edu
1Department of Statistics, Carnegie Mellon University, Pittsburgh, PA, USA 6Ray and Stephanie Lane Center for Computational Biology, Carnegie Mellon University, Pittsburgh, PA, USA
Full list of author information is available at the end of the article
Background
That genetic variation affects the risk for autism spec-trum disorders (ASDs) has been known for decades, yet only recently has the complexity of its architecture come into focus [1]. During the past few years a series of stud-ies has been published, some analyzing copy number variants [2,3], others rare sequence variants [4-9], and still others common variants [10,11], whose data can only be explained if many genes are involved in the risk for ASD. Our recent work estimates this number to be about 1,000 [1,9,12], a remarkably high fraction of the known genes in the genome. To date, analysis of 1,043 ASD trios has identified a handful of the genes involved in the ASD risk. Extrapolating from these data would require exome analysis of tens of thousands of families to identify even half of the risk genes, an infeasible short-term goal with regard to sample collection and funding. Therefore there is an urgent need to advance ASD gene discovery through the integration of complementary biologically relevant datasets.
The complexity of the ASD genetic architecture raises challenges, but we anticipate there will be a discover-able organization to these genes that will pave the way for deep insights into genetics and neurobiology. Support for this conjecture comes from recent analyses [13-15]. A recent paper [14] has laid the foundation for these insights in two ways: by identifying brain gene expression networks as meaningful for organization and interrela-tionships of ASD genes; and by identifying the region and developmental periods in which these genes tend to coa-lesce to confer risk of ASD, specifically the mid-fetal pre-frontal and motor-somatosensory neocortex (PFC-MSC). We reasoned that if this region were a critical nexus for the expression of ASD genes, it would be the perfect place to hunt for novel ASD genes. Thus we take the results from [14] further by integrating two key data sets, BrainSpan gene expression [16] and results from analysis of rare sequence variation [12], to identify genes and sub-networks in the mid-fetal PFC-MSC that likely underlie ASD risk.
To implicate genes in risk (predicted risk or rASD genes) we have developed an algorithm named DAWN (for Detecting Association With Networks, Figure 1). Building on the logic that ASD genes cluster within a co-expression network [14,15], the algorithm identifies ‘hot spots’ within this co-expression network at which multiple genes with evidence of ASD association from the exome data clus-ter together. For these hot spots DAWN uses the evidence from neighboring genes to reinforce the ASD signal, while in ‘cooler’ regions the absence of neighboring genes with evidence of ASD association downgrades the signal. By modeling these data, DAWN identified 127 rASD genes (Table 1), many of which are novel. By analyzing inde-pendently generated association data [17] for a subset
of these rASD genes we validated DAWN by demon-strating its ability to delineate which genes will yield new de novomutations and which will not. Importantly these results provide a framework for targeted resequenc-ing of new samples to demonstrate involvement in ASD risk definitively and for neurobiological assessment of gene and subnetwork function. Moreover, this approach could be applied to other gene expression data in rele-vant tissues to identify additional subnetworks of ASD risk genes.
Methods
Gene expression and co-expression
The data analyzed were produced as previously described [16] and based on the same quality control and quan-tile normalization. After total RNA was extracted from tissue samples, gene expression was assessed using the Affymetrix GeneChip Human Exon 1.0 ST Array platform (Platform GPL5175), yielding high-quality comprehensive data. The data were downloaded from the National Center for Biotechnology Information Gene Expression Omnibus (GEO accession number [GEO:GSE25219]). Expression data from the core probe set were used in co-expression analysis of most genes. For genesCHD8, FLG, FREM3, FRG2C,LMTK3,THSD7A,UBN2andZNF594, however, data from the extended probe set were utilized. We uti-lized measurements from PFC-MSC, analyzing 14,651 unique transcripts [16]. To investigate mid-fetal develop-ment we targeted post-conception weeks 10–24, which covers time periods 3–6 as defined previously [16]. In our analysis, we used two overlapping windows: peri-ods 3–5 conception weeks 10–19) and 4–6 (post-conception weeks 13–24) with 10 and 14 brains available, respectively.
Gene co-expression was measured by the Pearson cor-relation r between pairs of genes. To obtain the co-expression between a pair of genes X and Y, multiple observations of the joint expression ofXandYare essen-tial. These replicates were obtained in two ways, by mea-surements ofXandYfrom different regions of the same portion of the brain, and from the same region in different brains. For periods 3–5 and 4–6 there were 107 and 140 replicates of expression per gene, respectively (Additional file 1: Table S1).
Gene networks
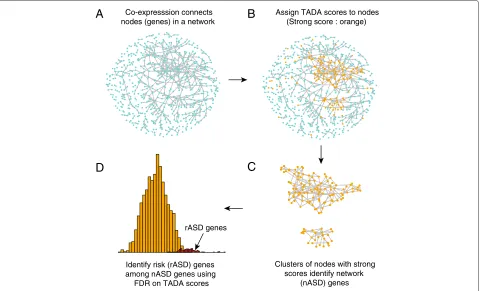
Co-expresssion connects nodes (genes) in a network
Assign TADA scores to nodes (Strong score : orange)
Clusters of nodes with strong scores identify network
(nASD) genes Identify risk (rASD) genes
among nASD genes using FDR on TADA scores
A
B
C
D
rASD genes
Figure 1The DAWN algorithm.(A)Each node in the network represents a gene and each edge represents pairs of genes with strong co-expression (absolute correlationr>0.7).(B)Orange nodes indicate genes with strong genetic scores from the TADA test.(C)Hot spots (i.e., clusters of strong scores) are classified as nASD genes in the screening stage of the algorithm; cool spots (i.e. strong scores in isolation) are not. (D)In the final cleaning step, the nASD list is further refined to reveal the rASD gene list. This step uses the TADA scores and features of the network to compute the false discovery rate of each gene. FDR, false discovery rate; nASD, network autism spectrum disorder; rASD, risk autism spectrum disorder; TADA, transmission andde novoassociation.
clustering was used to construct the dendrogram. Mod-ules were chosen using dynamic cutting of the branches of the resulting clustering tree. We set the minimum module size to 30 genes and the minimum height for merging modules at 0.15. Closely related modules can be merged using the adjacency of eigengenes (i.e., the first eigenvectors of the expression matrix for a module). To capture salient features of the gene co-expression net-work fully, modules were built independently for each time span (3–5 and 4–6), and within each period of devel-opment modules were chosen using two different choices of the power parameter (1 and 6); see Additional file 2: Figure S1, Additional file 3: Table S2 and Additional file 4: Table S3 for details. The first step of the DAWN algorithm (Figure 1) involves evaluating these four repre-sentations of the gene expression data. Multiple represen-tations are necessary because a single partition of genes into highly co-expressed modules fails to capture the full neighborhood of all genes; using multiple sets of mod-ules avoids missing signals from risk genes that are on the boundary between two modules. The goal here is for every
gene to have its nearest neighbors included in a common module for at least one partition of the genes.
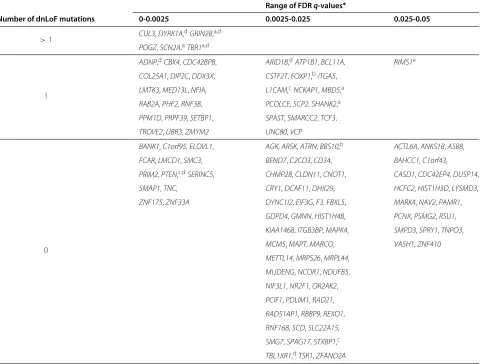
Table 1 List of genes predicted to affect risk for ASD (rASD genes)
Range of FDRq-values∗
Number of dnLoF mutations 0-0.0025 0.0025-0.025 0.025-0.05
>1 CUL3,DYRK1A,
dGRIN2B,a,d
POGZ,SCN2A,aTBR1a,d
1
ADNP,dCBX4,CDC42BPB, ARID1B,dATP1B1,BCL11A, RIMS1e
COL25A1,DIP2C,DDX3X, CSTF2T,FOXP1,bITGA5,
LMTK3,MED13L,NFIA, L1CAM,cNCKAP1,MBD5,a
RAB2A,PHF2,RNF38, PCOLCE,SCP2,SHANK2,a
PPM1D,PRPF39,SETBP1, SPAST,SMARCC2,TCF3,
TROVE2,UBR3,ZMYM2 UNC80,VCP
0
BANK1,C1orf95,ELOVL1, AGK,ARSK,ATRN,BBS10,b ACTL6A,ANKS1B,ASB8,
FCAR,LMCD1,SMC3, BEND7,C2CD3,CD34, BAHCC1,C1orf43,
PRIM2,PTEN,c,dSERINC5, CHMP2B,CLDN11,CNOT1, CASD1,CDC42EP4,DUSP14,
SMAP1,TNC, CRY1,DCAF11,DHX29, HCFC2,HIST1H3D,LYSMD3,
ZNF175,ZNF33A DYNC1I2,EIF3G,F3,FBXL5, MARK4,NAV2,PAMR1,
GDPD4,GMNN,HIST1H4B, PCNX,PSMG2,RSU1,
KIAA1468,ITGB3BP,MAPK4, SMPD3,SPRY1,TNPO3,
MCM5,MAPT,MARCO, VASH1,ZNF410
METTL14,MRPS26,MRPL44,
MUDENG,NCOR1,NDUFB5,
NIF3L1,NR2F1,OR2AK2,
PCIF1,PDLIM1,RAD21,
RAD51AP1,RBBP9,REXO1,
RNF168,SCD,SLC22A15,
SMG7,SPAG17,STXBP1,c
TBL1XR1,dTSR1,ZFAND2A
*ASD genes are displayed by range of False Discovery Rate (FDR) q-value; the 3 columns correspond to genes significant with a genome-wide correction at levels
.0025, .025, and .05, respectively. Genes with FDR < .05, but validation score less than .90 were not included.agene with strong prior support for affecting risk for ASD; bgene with modest prior support for affecting risk for ASD;csyndromic gene;dgene with ade novoloss-of-function mutation in the [17] study;eRIMS1 has onede novo loss-of-function mutation, netscore = 107 (95th percentile), and FDR of .077 exceeding the cutoff.
clusters must be greater than 0.7. For r = 0.8 only a small number of genes would be clustered, however, and therefore .75 was chosen as a compromise between these extremes.
Genetic data from whole-exome sequencing studies
Transmission and de novo association (TADA) scores [12] (Additional file 5: Table S4) were calculated from the following data: all reportedde novo mutations from 932 ASD families consisting of trios of affected offspring and two parents from four studies [4,6,8,9]; transmitted rare variants from 641 of these families from two stud-ies [4,9]; and case-control data from the ARRA Autism Sequencing Consortium, consisting of 935 ASD subjects and 870 controls [20]. In addition we included two de novo loss-of-function (dnLoF) mutations obtained from a set of 44 trios [5] and 56 trios [14]. For a complete list ofde novo variants utilized, see [14]. Each missense
mutation was classified into a category of damage to the protein based on its predicted effect on the coding sequence using PolyPhen2 [21]. Loss-of-function (LoF) and ‘probably damaging’ missense variants were analyzed by TADA, both of which showed enrichment in probands for these data. In addition to finding strong statistical sup-port for a few novel ASD risk genes [12], TADA found significant enrichment of genes with smallPvalues com-pared with random expectation, indicating there are more genes affecting risk for ASD yet to be discovered, even from these genetic data.
The TADA Pvalues were converted toZ-scores using the standard normal probability integral:
Z=−1(1−P)
theZ-score is standard normally distributed. When a gene is a risk gene, theZ-score approximately follows a normal distribution with meanμ > 0. AZ-score is associated with each node. For multi-gene nodes this is the minimum Pvalue of all genes in the node.
The DAWN algorithm
From a statistical perspective, DAWN is based on the ‘screen and clean’ principle [22]: first screen the data to find all potential signals (network ASD or nASD genes), and then using more stringent criteria, clean the list so that it includes only those signals that meet more tradi-tional criteria for significance (rASD genes). This basic strategy has been shown to increase power and yet control error rates in a similar high-dimensional setting [22].
Screening stage
DAWN relies on a hidden Markov random field (HMRF) to identify clusters of possible risk genes embedded in the entire expression network (Figure 1, Additional file 6: Figure S2 and Additional file 7: Text S1). The true state of each node (rASD risk or not) is hidden, but the TADA score associated with gene node can be observed. Clus-ters of nodes with high TADA scores suggests that these nodes are likely associated with risk. The HMRF network algorithm works as follows: (1) genes are organized into highly correlated modules based on gene expression using WGCNA, (2) the adjacency matrix defines a network including edges between genes with absolute correlation exceeding a fixed threshold, (3) this model examines the initial signals provided by the nodeZ-scores to determine if high scores tend to be clustered in the network and (4) the fitted model then infers the missing label for a node, namely whether it is related to ASD risk or not. This label is determined based on theZ-score of the node and whether or not the node has many neighbors with large Z-scores. By using a number of computational approxima-tions, including the iterative conditional mode, the model parameters can be estimated efficiently. Consequently we can estimate the probability a node is associated with ASD risk. For related literature, see [23,24]. We use a posterior probability of 0.5 to identify nodes potentially associated with risk and call the genes in these nodes network ASD (nASD) genes.
As described earlier, tightly clustered genes are col-lapsed into multi-gene nodes. The adjacency matrix entries for these nodes are defined based on the average linkage between nodes. Each multi-gene node is assigned a node score defined by the minimumPvalue of all genes within the cluster. Finally, the HMRF analysis follows as for single gene nodes. In this way, the HMRF algorithm can be applied to a much smaller set of nodes with an adja-cency matrix that is far less densely connected. Based on results from simulations and data analysis, it appears that
the HMRF approach is more powerful at detecting clus-ters of risk nodes when multi-gene nodes are incorporated into the algorithm.
Cleaning stage
After running the HMRF model, the goal at this step is to winnow the nASD list down to a smaller set of genes that are highly likely to affect risk on the basis of the genetic evidence using a false discovery rate (FDR) pro-cedure [25]. We call these probable risk (rASD) genes. To maximize power to discover rASD genes in subnetworks dense for genes affecting risk, we use a stratified analy-sis. Each large multi-gene node defines a stratum (more than ten genes), and we fit a Gaussian mixture model to the distribution of TADAZ-scores to estimate the frac-tion of risk genes present in the multi-gene node [26]. The larger this fraction is estimated to be, the larger the num-ber of genes determined to be rASD genes. Thus this FDR procedure garners power by exploiting the heterogeneity inherent across multi-gene nodes and modules, while still controlling the error rate. Then, for all remaining nASD genes, which includes small multi-gene nodes, the distri-bution of TADA test statistics is evaluated by fitting the mixture model to the entire set of statistics (Additional file 8: Figure S3). The model is described in detail in Additional file 7: Text S1.
The DAWN analysis is performed for power 1 and power 6 modules and for periods 3–5 and 4–6 PFC-MSC. Thus there are four representations of the gene expression network. To select a unique set of rASD genes we use the minimum FDR across four representations.
Permutation experiments
To evaluate DAWN we performed two permutation experiments. Each sought to illuminate DAWN’s perfor-mance by diluting the signal for association in two ways: (I) by separating smallPvalues from risk genes and (II) by moving risk genes from clusters of genes with smallP val-ues. All of the permutation experiments were performed at the node level. Hence single gene nodes and multi-gene nodes were treated interchangeably in what follows.
Experiment I: diluting signals
1. Randomly select a proportionl of nodes that have P values less than or equal to 0.1. The proportionl is set to be equal to 0.2, 0.4, 0.6, 0.8 or 1.
2. Randomly select the same number of nodes that have P values greater than 0.1. Permute the P values of selected nodes with the nodes selected in step 1. 3. Run the HMRF approach with the permuted data
and estimate the parameters of the model. Record the number of genes identified that have at least one dnLoF variant.
Experiment II: diluting the clustering of signals in the network
Replace Step 2 above with the following:
2. Randomly select the same number of nodes that have P values greater than 0.1. Permute the selected nodes (i.e., switch both theP value and the gene labels associated with the pair of nodes). With increasing dilution, this effectively removes the correlated nature of the signal.
Network score
To summarize gene i’s position within the network, a network score was calculated as:
Si=
j=i
|rij| ×zj
in which both variables are given hard thresholds (0 if cor-relation|rij| < 0.7 or ifZ-scorezj < 1.2). TheZ-score is
obtained from the TADAPvalue.
Connectivity
To evaluate the connectivity of the rASD gene list we performed a permutation test. All genes expressed in the brain that fell within a module and had exome data were identified: 10,223 genes matched these criteria including all 127 rASD genes. The genes were sorted by mutabil-ity (based on size and GC content). Random lists of 127 genes were sampled repeatedly, with the constraint that they be approximately equal in mutability to the orig-inal list. We compared the mean connectivity of each list of 127 to the true rASD list to obtain a P value for connectivity.
De novoprobability model
We estimated the probability that a true ASD gene has at least one dnLoF mutation in a sample of 2,500 trios by extrapolating from available trios. In a sample of 1,043 trios, 143de novoLoF mutations were observed, involving 130 unique genes, with 9 genes incurring multiple events and 121 incurring single events [14]. Extrapolating this process to 2,500 trios we expect about 342de novoLoF mutations, involving about 311 unique genes, with about 13 genes incurring multiple events and 298 incurring sin-gle events. Based on previous analysis, we anticipate about 50% of the single-mutation genes and most of the multi-mutation genes are true ASD genes [14]. Consequently, we predict approximately 162 (or slightly fewer) true ASD genes will have at least one de novo LoF mutation in a sample involving 2,500 trios. Assuming there at least 1,000 true ASD genes [12], each ASD gene,a priori, has approx-imately a 15–16% chance of having a dnLoF mutation in a sample of 2,500 trios.
Protein-protein interactions
A literature-based protein-protein interaction (PPI) net-work was constructed by combining interactions from the following databases: BioGRID [27], HPRD [28], MINT [29], IntAct [30], KEA [31], KEGG [32], SNAVI [33] and MIPS [34]. Only interactions from publications that reported ten or fewer interactions were retained. After combining the binary interactions from these databases by converting gene IDs to EntreZ Gene Symbols the biggest connected component was used for further anal-ysis. rASD genes were seeded in this network and Dijk-stra’s shortest path algorithm [35] was used to extract a subnetwork that connected the seed genes using a path length of three (one intermediate and two links) [36]. The natural clustering of the obtained subnetwork was created using the organic layout of the graphic soft-ware yEd [37]. The relative local clusters were manually identified.
Functional enrichment analysis with Enrichr
Seed rASD genes from the identified clusters of the PPI network, together with the intermediates from each clus-ter, were fed into the online gene enrichment analysis tool Enrichr [38]. Enrichr has 36 gene set libraries and per-forms gene set enrichment analyses using Fisher’s exact test (FET) with Benjamini Hochberg corrections [25]. We focused our enrichment analysis on functional annotation from gene set libraries created from the gene ontology (GO) [39] biological process (BP) tree, the gene ontol-ogy molecular function (MF) tree and the mouse genome information (MGI) molecular phenotype (MP) browser ontology tree [40]. Enrichr [38] and its accompanying databases are online [41].
Results and discussion
Discovering network and risk genes using DAWN
To search for clusters of possible risk genes embedded in the entire expression network, DAWN models the inter-relationships amongst nodes of a network, in terms of risk status, and combines such interrelationships with node-specific genetic signals for association (Figure 1). As part of this process, DAWN assigns nodes a posterior prob-ability of being part of an ASD subnetwork. Genes are defined as nASD genes if their posterior probability from the hidden Markov analysis crosses the threshold of 0.5. This results in 2,323 genes being classified as nASD genes (Additional file 5: Table S4).
Additional file 3: Table S2; and Additional file 8: Figure S3; Wilcoxon rank test,P<10−16).
Once genes are separated into the nASD and non-nASD groups (the screening step of the screen-and-clean algo-rithm), DAWN performed a further evaluation of the genetic data with the goal of finding the subset of nASD genes with compelling evidence for ASD risk (cleaning step). The cleaning step has two levels, an FDR procedure tailored to the network structure, the genetic score, and an evaluation of sensitivity of the FDR results to network structure. After performing the FDR procedure, 146 genes haveq≤0.05 (Additional file 5: Table S4).
To examine the robustness of these predictions to net-work structure, we performed a cross-validation experi-ment in which we iteratively removed a fraction of the genetic signals and re-evaluated the prediction of risk genes. For each iteration, we randomly removed the genetic signal from 10% of the rASD genes and then reran the DAWN algorithm to determine which of the remain-ing rASD genes were identified as predicted risk genes by the algorithm. A ‘validation score’, specifically the frac-tion of iterafrac-tions for which the gene is included in the updated list, showed that most of the rASD genes are robust to the set of genetic signals present (Additional file 5: Table S4), with 86% achieving a validation score of
90% or higher. However, for the other 14% of genes orig-inally predicted to affect risk, the results depended on a small number of neighboring genes and were sensitive to their removal. These genes were excluded from the final rASD list because their association was judged to be non-robust, leaving 127 genes that were predicted to affect risk (Table 1).
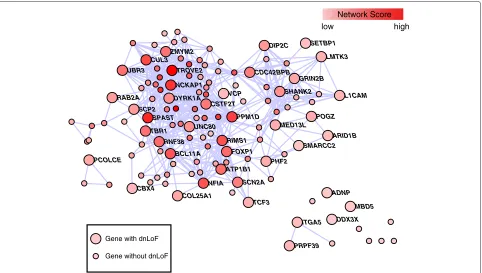
The rASD genes had striking co-expression (Figure 2), significantly different from a random set of brain-expressed genes with similar attributes (P < 0.000001; Methods). On the other hand, the network scores for the rASD list are not significantly greater than other nASD genes (Additional file 8: Figure S3), implying that inclusion in the rASD list requires a high network score coupled with at least a moderate level of genetic evidence for association (Additional file 9: Figure S4).
Evaluating how well DAWN works
To assess DAWN’s performance we focused on the num-ber of genes identified by the algorithm that have at least one dnLoF mutation in sequenced probands, since the 127 rASD genes are highly enriched for such mutations (Table 1) and over 50% of such genes are independently predicted to be ASD risk genes [9]. If DAWN were using both the network (gene expression) and association
Gene with dnLoF
ITGA5 ADNP
PRPF39
DDX3X MBD5 PHF2
MED13L
TCF3
GRIN2B
SHANK2 CDC42BPB
ARID1B L1CAM
SMARCC2 POGZ DIP2C SETBP1
LMTK3 CUL3
ZMYM2
RAB2A
SPAST DYRK1A SCP2
PPM1D VCP UBR3 TROVE2
NCKAP1
CSTF2T
RIMS1 FOXP1
CBX4
BCL11A RNF38
UNC80 TBR1
PCOLCE
ATP1B1
NFIA
COL25A1
SCN2A
Network Score high low
Gene without dnLoF
(exome) results effectively, we would expect that diluting either of these features would diminish its ability to detect these dnLoF genes. To evaluate this question we con-ducted two permutation experiments, either diluting the association by separating likely risk genes from their small P values or diluting the network by breaking up clusters of genes with small P values and randomly distributing them throughout the network (Methods). The degree of dilution varied from 0% to 100%.
For both dilution experiments, we found that the per-formance (i.e. the number of dnLoF genes identified) decreased in almost direct proportion to the degree of dilution (Additional file 10: Figure S5). This result demon-strates that DAWN is sensitive to both the ASD associ-ation signal (exome) and the locassoci-ation of a gene within the network (gene co-expression) in its selection of rASD genes (Figure 1, Additional file 6: Figure S2).
Conversely, DAWN does not require overwhelming prior evidence of association to identify rASD genes. To test this we considered six rASD genes that have multiple dnLoF mutations leading to a very low priorPvalue calcu-lated by TADA (Table 1). By downgrading these six genes to single dnLoF mutations, the recalculated TADAPvalue was increased by several orders of magnitude, as expected. Yet, on rerunning DAWN with these higherP values, all six of these genes were still predicted to affect risk, clearly indicating that they were pulled into the rASD gene sets based on the strength of their connections to neighboring genes with evidence of ASD risk.
DAWN does require genes to be connected in the adja-cency matrix. Yet expression modules can create artificial boundaries that separate some gene clusters. For this reason we used four different modular representations of the gene expression network in DAWN. When genes are selected as rASD genes, closer inspection reveals that they typically share a module with most (or all) of their top 20 nearest neighbors for all representations. Some genes, however, appear as rASD genes for only one representation and are often separated from several of their nearest neighbors for the other representations. The rASD gene SHANK2 provides a good example. In periods 4–6 PFC-MSC,SHANK2was in a module with four other rASD genes for one representation of the net-work data and was identified as an rASD gene; for the other representation, however, it was in a module with no other connecting rASD genes and was not detected. For this reason we believe it is essential to use multi-ple modular representations of the gene co-expression network.
Validation of rASD genes
Analysis of resequencing experiment
On average half of all dnLoF mutations in ASD probands correspond to true ASD genes [9], hence one way to
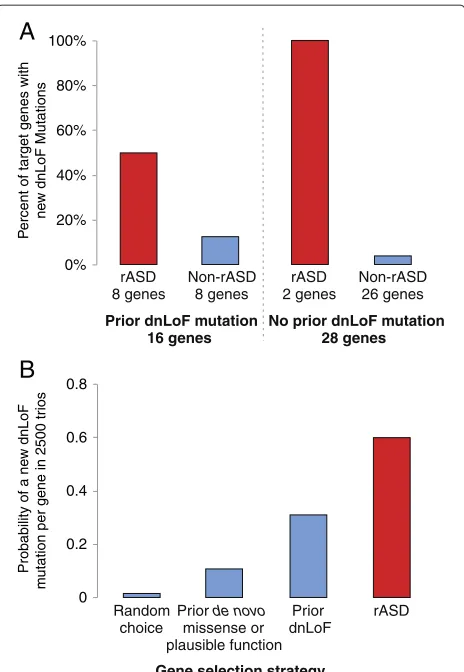
evaluate the rASD list is to compare it to a list of genes with dnLoF mutations identified based on sequencing of independent ASD families. Calculations based on empir-icalde novorates and a new set of 2,448 ASD trios show the chance of seeing a dnLoF mutation in a particular ASD gene is about 15%, although this varies depending on gene size and relative risk. Consequently, most true ASD genes will have no dnLoF mutations, even in this relatively large study, and thus direct validation of individual genes in the rASD list is infeasible. Nonetheless they can be evaluated as a group for enrichment of dnLoF mutations in addi-tional trios. Under this scenario a compelling experiment has already been performed, namely targeted sequencing of a sample of 2,448 trios with molecular inversion probe sequencing (MIPS) of 44 carefully selected ASD candidate genes (henceforth known as the MIPS experiment [17]). Ten of these 44 candidate genes are also on the rASD list, thus they can be evaluated to determine if they had an unusually high number of dnLoF mutations in the MIPS experiment.
In the MIPS experiment, eight genes incur at least one additional dnLoF event and six of these are on the
rASD list (ADNP, ARID1B, DYRK1A, PTEN, TBL1XR
and TBR1), demonstrating significant enrichment (P = 0.0007). Of the two genes incurring additional dnLoF but missing from the rASD list, CHD8 is an obvious ASD gene [17], but its expression levels were derived from a less reliable extended probe set, while the other ana-lyzed genes were present on the core probe set of the BrainSpan exon array data. CHD8’s expression is not tightly correlated with that from other genes, hence it is excluded from the nASD gene set. The other gene, CTNNB1, is an nASD gene, but it has a TADA P value of 0.36a prioriand hence DAWN does not predict it as a risk gene. Of the four rASD genes that did not sus-tain dnLoF mutations in this study, three are known ASD genes (CUL3,FOXP1andMBD5) and one is a syndromic gene for which ASD is sometimes a comorbid outcome (SETBP1).
0% 20% 40% 60% 80% 100%
rASD 8 genes
Non-rASD 8 genes
rASD 2 genes
Non-rASD 26 genes
Prior dnLoF mutation 16 genes
No prior dnLoF mutation 28 genes
A
B
0 0.2 0.4 0.6 0.8
Random choice
Prior de novo
missense or plausible function
Prior dnLoF
rASD
Gene selection strategy
P
ercent of target genes with ne
w dnLoF Mutations
Probability of a ne
w dnLoF
m
utation per gene in 2500 tr
ios
Figure 3Analysis of MIPS validation experiment.(A)First 44 genes with priorde novomutations were sequenced for 2,448 additional trios. These genes were cross-classified by whether or not they had a prior dnLoF mutation, and whether or not they were on the DAWN rASD list (yes: red, no: blue). For each category, the percentage of genes that had a dnLoF mutation in the new trios is depicted. (B)For a given gene, the probability of observing a dnLoF mutation in 2,500 probands varies. This probability is compared for four types of genes: a randomly chosen gene and three classifications of the genes from the MIPS experiment including: (i) all 44 genes, (ii) those 16 genes with a prior dnLoF mutation and (iii) those 10 genes on the rASD list. dnLoF,de novoloss of function; rASD, risk autism spectrum disorder.
From the results of the original experiment, we conclude that many of the 44 genes selected for the MIPS exper-iment are likely ASD genes because the rate of dnLoF mutations is more than would be expected even if all 44 were true ASD genes. Still DAWN appears to do markedly better (Figure 3B). We conjecture its better performance is largely due to identifying ASD genes with higher rela-tive risk, compared to the average ASD gene. Genes with a larger relative risk are more likely to have dnLoF muta-tionsa priori[12], an expectation also supported by the MIPS experiment.
Previously identified autism spectrum disorder genes and probable risk genes
Of the rASD genes nominated (Table 1), six have been implicated for ASD risk on the basis of multiple dnLoF events in exome sequencing studies (CUL3, DYRK1A, GRIN2B, POGZ,SCN2A and TBR1). Seven others have been identified as ASD genes on the basis of pub-lished research [42] (three syndromic: L1CAM, PTEN andSTXBP1; two with strong support from copy
num-ber and sequence studies: MBD5 and SHANK2; and
two with equivocal evidence: BBS10 and FOXP1). This demonstrates significant enrichment (FETP < 10−6) for nominal ASD genes in the rASD list.
Within the rASD set (Table 1) are 36 genes contain-ing a scontain-ingle dnLoF mutation known from prior exome sequencing studies [4-6,8,9,14], demonstrating significant enrichment (FET P < 10−16) compared to the full list of 116 such genes with quality expression data for the mid-fetal PFC-MSC. Moreover three more rASD genes were found to have a dnLoF mutation by the MIPS
exper-iment (TBL1XR1, ARID1B and ADNP). These results
are of note because of the expectation that roughly 50% of these genes are involved in risk [9] and DAWN does a better than expected job at identifying these 50%.
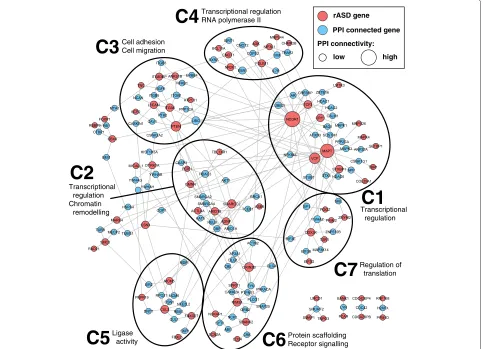
Functional coherence
Next we reasoned that if the rASD list were meaning-ful, it should be enriched for biologically meaningmeaning-ful, ASD-relevant processes. We focused on PPI networks, which are independent of the co-expression networks we analyzed but have the expectation that interacting genes will have correlated expression. In addition to forming a highly significant network of interacting genes (Additional file 12: Figure S6), the rASD genes in the PPI network fall into several natural clusters (Figure 4). Clusters C1, C2 and C4, accounting for a large proportion of the genes, share related functional categories. Specifically, these three clusters are involved in transcriptional regula-tion (see the GO BP and GO MF categories in Addiregula-tional file 13: Figure S7). Cluster C2 is additionally enriched for chromatin remodeling terms in GO BP, while cluster C4 is enriched for RNA polymerase II-related categories in GO MF. Additionally Cluster C7 relates to regulation of translation as seen in both GO BP and GO MF. Together these results show that dysregulation of gene expression and coordinated co-expression is a key risk factor for ASD and they further suggest dysregulation has an effect early in development. Dysregulation of coordinated gene expression is consistent with a wide range of ASD studies [43].
Transcriptional regulation Transcriptional regulation
RNA polymerase II
Cell adhesion Cell migration
Ligase
activity Protein scaffoldingReceptor signalling
Transcriptional regulation Chromatin remodelling
C3
C1
C4
C5
C6
C2
Regulation of translation
C7
rASD gene
PPI connected gene
PPI connectivity:
low high
Figure 4Clustering by enrichment and protein-protein interaction (PPI).The rASD genes are seeded into the PPI network presented in [6], represented by red nodes, with size proportional to the number of connections. The blue nodes are immediate intermediate proteins [36]. The network was clustered using organic clustering methods implemented in yEd [44] rASD, risk autism spectrum disorder.
for GO BP categories involved in cell adhesion and cell migration and for abnormalities in cell migration in MGI MP. This cluster shows strong enrichment for the KEGG category of focal adhesion (HSA04510). Cluster C5 is enriched for GO MF categories around ligase activity, including ubiquitin-protein ligase activity. This cluster shows a similar enrichment in KEGG, for ubiquitin-mediated proteolysis (HSA04120), previously implicated in neuronal function and ASD risk [47]. Cluster C6 is enriched for GO MF categories around protein scaffold-ing and receptor signalscaffold-ing. This cluster is also associated with several important MGI phenotypes, including lethal-ity and abnormalities in neuronal morphology, synaptic transmission and plasticity, and learning and memory.
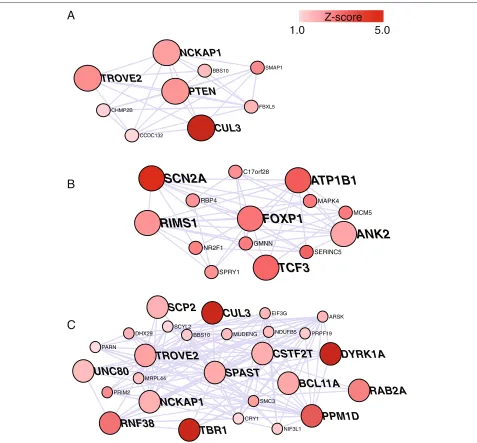
Subnetworks
The set of nASD genes, and especially the rASD genes, define subnetworks of co-expression, which can be used to focus further neurobiological research (Additional
file 5: Table S4). We highlight four subnetworks for illus-tration: one centered on PTEN (Figure 5A), which is a syndromic gene in which mutations are known to increase ASD risk; one centered on FOXP1 (Figure 5B), encod-ing forkhead box P1, for which there is some a priori evidence for involvement in ASD risk [48]; one centered on SPAST (Figure 5C), encoding spastin, which has no known involvement in ASD risk; and one centered on VRK1, encoding vaccinia related kinase 1, an nASD gene that has a very high network score and which did not pass the threshold for the rASD list (Additional file 14: Figure S8).
PARN
DHX29
TROVE2
SCP2
BBS10 SCYL2
BCL11A
NIF3L1 SMC3
RAB2A
PPM1D
CRY1
TBR1
RNF38
NCKAP1
SPAST
PRIM2
MRPL44
UNC80
NDUFB5
CSTF2T
CUL3
MUDENG
DYRK1A
ARSK
PRPF19 EIF3G
A
Z-score
1.0
5.0
B
C
BBS10
PTEN
CUL3
CCDC132
FBXL5
TROVE2
SMAP1
NCKAP1
CHMP2B
GMNN
TCF3
SERINC5 NR2F1SPRY1
RIMS1
ATP1B1
FOXP1
RBP4C17orf28
SCN2A
MAPK4
ANK2
MCM5Figure 5Gene subnetworks for thePTEN,FOXP1andSPASTgenes.Figure shows all rASD genes with absolute correlation of .7 or better with (A)PTEN,(B)FOXP1and(C)SPAST. Intensity of red color reflects the magnitude of theZ-score from the TADA statistic. Large nodes with labels depict genes that have at least one dnLoF mutation recorded in the current literature (exceptPTEN).ANK2,CUL3,DYRK1A,SCN2AandTBR1are genes with multiple dnLoF mutations.ANK2is included along with rASD genes because it has two dnLoF mutations.
for association comes from the tight co-expression of PTENwith other genes likely involved in risk (Figure 5A). While the complete neurobiological underpinnings of this tightly connected network are not obvious, proteins aris-ing from several of these genes are known to have a common function, neurite extension. For example the protein product ofNCKAP1 plays a role in the protein complex WAVE1, an actin scaffold protein complex that regulates neurite outgrowth [49]. The protein product of PTEN likely plays a role in neurite outgrowth by neg-atively regulating PI3K signaling and affecting neuronal
FOXP1 is a transcriptional regulator when it het-erodimerizes with FOXP2. Mutations in FOXP2 have been shown to impair language development, specifi-cally causing developmental apraxia of speech [53,54]. Until recentlyFOXP1was not known to affect language abilities or behavior, but recent reports [7,55,56] sug-gest disruptions of the gene could cause cognitive dys-function and ASD, sometimes with language impairment [48]. The evidence, however, is not conclusive. On the basis of the DAWN analyses, FOXP1 has q = 0.0083, strong evidence it plays a role in risk, especially when considered with other independent evidence (reviewed in [48]). Notably it is connected directly and with sub-stantial correlation (|r|>0.7) to five genes with at least one dnLoF event in ASD probands (Figure 5B), of which
two are known ASD risk genes, SCN2A and ANK2.
What role or roles these genes play to effect this coordi-nated expression is not obvious from the neurobiological literature.
Certain mutations inSPASTare known to cause heredi-tary spastic paraplegia. In some cases, mutations inSPAST (also known asSPG4) can affect cognitive function and result in developmental delay syndromes [57], as well as incompletely penetrant hereditary spastic paraplegia later in life. Its subnetwork is notable (Figure 5C):SPAST is directly connected with 12 genes having at least one dnLoF mutation and three of those genes are known ASD risk genes. The protein product, Spast, severs micro-tubules and disruption of this function appears to generate a risk for hereditary spastic paraplegia [58]. It also inter-acts with protrudin to induce axonal neurite outgrowth [59]. This function, together with its direct connections in the network to other genes involved in neurite extension (NCKAP1and CUL3), suggest at least a portion of this network could affect ASD risk through improper neurite development.SPASTand its subnetwork deserve further study for their role in the risk for ASD.
Finally, an interesting case isVRK1. Measured by the network score, it is the gene most connected to rASD genes (Additional file 14: Figure S8). VRK1 has diverse functions, arguably most fundamental is regulation of cell cycle. Moreover mutations inVRK1have been implicated in neuronal development and maintenance, including cog-nitive impairment [60]. There is essentially no genetic evidence for its involvement in ASD (TADAP = 0.572). Therefore, although it is an nASD gene with the highest network score and intriguing neuronal functions, it does not make the rASD list (q=0.81).
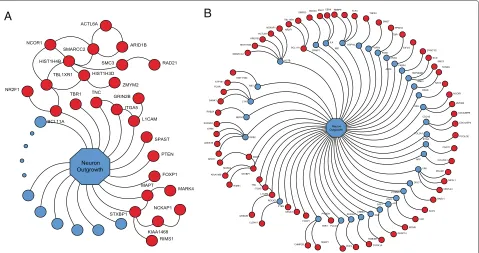
Functional interpretation of subnetworks
When looking at the genes comprising the two subnet-works given in Figures 5A,C, it is striking how many genes play some role in the regulation of neurite exten-sion and arborization. Indeed two other predicted risk
genes are known to affect this process at a basic level, namelyCDC42EP4andCDC42BPB, both interacting with CDC42(Figure 2), which plays a key role in neurite ini-tiation [61,62]. These genes are not highly correlated in the PFC-MSC, so they cannot occur in the same sub-network, although they are known to serve the same function.CDC42activates theWAVE1actin scaffold com-plex, includingNCKAP1(Figure 5A,C), initiating neurite outgrowth. Notably expression of CDC42BPB is highly correlated with expression of NAV2, a gene known to impact axonal outgrowth [63]. Being in a subnetwork cen-tered on NAV2, its expression is highly correlated with a substantial set of genes (Additional file 5: Table S4), many of which have some role in neurite extension and neuronal arborization, specifically ATRN, CDC42BPB, L1CAM,MARK4,SHANK2,MAPTandSTXBP1[64-68], although many play other roles in cellular maturation and function.
From this enumeration it appears as if a large frac-tion of predicted risk genes affect neurite extension and neuronal arborization. On the other hand, it could be that many genes play some role in this critical feature of neuronal development and the number identified here is no larger than we would expect by chance. We there-fore formally evaluate the conjecture that the rASD list is enriched with genes related to neurite outgrowth. For this evaluation we turn to unbiased and independent data, specifically functional annotation data from GO. We focus on the GO term for the ‘neuron projection development’ (GO:0031175), which is a biological process and also a synonym for ‘neuron outgrowth’. The list annotated with this term or one of its descendants in the GO hierar-chy contains 737 unique genes, including 10 out of 127
rASD genes (BCL11A,FOXP1, ITGA5, L1CAM,MAPT,
PTEN, SPAST,STXBP1, TBR1andTNC). Compared to random sets of 127 brain-expressed genes, the rASD list is significantly enriched (P=0.032, based on 1,000 draws).
A
B
Figure 6Predicted risk genes functionally related to neuron outgrowth.(A)Ten rASD genes are GO-identified for neuron outgrowth and 16 additional genes rASD genes are directly connected via the PPI network.(B)Note that 68 rASD genes are either GO-identified for neuron outgrowth or separated in the PPI network from genes annotated by neurite outgrowth by at most one step. PPI, protein-protein interaction; rASD, risk autism spectrum disorder.
DAWN’s limitations
Both genetic evidence and gene expression evidence are required for a risk gene to be identified by DAWN. In the screening stage, a gene can only make it onto the nASD list if it is tightly correlated with multiple genes with moder-ate genetic evidence for association. Thus a lone gene with a small TADAPvalue cannot make it onto the nASD list. Next in the cleaning stage the subset of the nASD genes that have genetic evidence for association are upgraded to the rASD list. This summary highlights two limitations of DAWN: (i) a risk gene cannot be discovered if there is not some genetic evidence for association and (ii) a risk gene cannot be detected if it does not appear in a network of other risk genes, based on the gene expression network in use. Both of these conditions can fail for a number of reasons, not all of them biologically interesting. For exam-ple, the quality of sequencing data could be poor due to low coverage, the power of the genetic test could be poor due to insufficient sample size or the wrong gene expres-sion data could be utilized, yielding an irrelevant network. Other possible limitations to DAWN are biological. For example it is possible that risk for ASD arises from dys-functional neuronal circuitry that spans distinct regions of the brain, such as from the hindbrain into deep layers of the PFC [70]. Indeed, different genes could contribute to a single circuit and be co-expressed at the circuit level, but not in the same tissue. If this were the case, then
co-expression information in a specific tissue for these genes is irrelevant and DAWN would fail to capture this aspect of ASD risk.
For these and other reasons, DAWN cannot possibly capture the bulk of ASD genes. Indeed, as noted in [14], it is unreasonable to predict that the mid-fetal PFC-MSC is the only nexus for ASD risk genes. Underscoring this observation, strikingly absent from the rASD set are some genes known to affect risk for ASD. For instance the
neurexins (NRXN1, NRXN2 and NRXN3) and
andNLGN1rank highly for their network scores. Notably the inter-correlations amongst neuroligin and neurexin gene expression are not large in these data (Additional file 16: Table S7), suggesting they have different roles in the development of the mid-fetal PFC-MSC.
We believe it is impossible to identify all risk genes in one analysis, regardless of the methods employed. To enhance power, one could parse the literature for evi-dence of a gene’s impact on risk and somehow include that evidence in the DAWN analysis. The downside to that approach is that it will be difficult and somewhat subjec-tive to score the evidence from studies that have different experimental designs and results. Specifically, the way the data are collected could affect the estimate of risk param-eters for specific genes; for example, syndromic genes, which affect multiple systems, could be over-represented in the literature, potentially exaggerating their importance for ASD risk.
Extensions to DAWN
On the other hand, there is unbiased information that is not yet built into the algorithm, such as chromatin modifi-cation, other features of gene regulation and other sources of information regarding association with disease. We are working on extensions of DAWN to accommodate these kinds of data. There is also potentially biased but valu-able information that should be evaluated for modeling. For example, we noted that a significant number of risk genes are involved in the regulation of neurite exten-sion or arborization. While it would be challenging, this kind of information would ideally be incorporated into an algorithm such as DAWN.
An additional concern for any meta-analytic approach like DAWN is data quality, both from gene expression and genome sequencing. Poor quality assessment of gene expression obscures the construction of gene networks. In addition, unless whole-exome or whole-genome sequenc-ing becomes very cost effective and highly representative of genomic content, there will always be genes with poor coverage from methods that target the entire exome or genome. We have assumed the missing information is ran-dom, with respect to risk for ASD, but it still reduces the ability to predict risk genes. Interestingly alternative methods that capture those missing exons would benefit from analyses such as DAWN. The results from DAWN, specifically the nASD genes and their network scores, when combined with information about coverage of the sequencing experiments, provides key information about which genes should be targeted with alternative sequenc-ing methods (e.g., [17]) because they are closely integrated with genes that affect risk.
In the very near future, studies will refine the data rel-evant to gene expression and to the genetics of ASD. The genetic data are expected to change dramatically
during the next few years [1]. Thus, we expect the rASD gene set and its associated subnetworks to be refined and expanded with these new data. To speed the gene dis-covery process, candidate gene validation studies can be applied to large samples of trios using the results from DAWN to guide in gene selection.
Synopsis of results
Using the DAWN algorithm to integrate gene co-expression and genetic data, we identified over a hundred genes with compelling evidence they affect risk for ASD (Table 1). Our analyses also identified subnetworks of genes likely to be involved in risk for ASD, and for the majority of genes included there is no strong evidence for risk from genetic results alone (Figures 2 and 4). Our analyses build directly on the results from [14] because we target the mid-fetal PFC-MSC, where a striking and highly significant co-expression of genes is implicated in ASD risk on the basis of de novo mutations. It is rea-sonable to predict that such strong prior information is essential for the success of methods such as DAWN. Simi-larly, refined co-expression networks obtained from larger samples and from RNAseq experiments should improve the performance of DAWN, while expression data from additional brain regions could yield additional findings [14].
but stochastically larger brain than expected [78], consis-tent with overgrowth and/or abnormal synaptic pruning.
Conclusions
DAWN offers a general approach to gene discovery, which can be applied to many complex disorders. The algorithm leverages genetic and gene expression data effectively to predict probable risk genes and subnetworks. Validation studies demonstrate that DAWN is successful in predict-ing the genes that will accumulate new dnLoF mutations better than any existing methods, underscoring the high likelihood that DAWN is finding true risk genes for ASD. The set of risk genes reported here provides further sup-port for the theory that neurite extension and neuronal arborization play a key role in risk for ASD. Currently DAWN’s findings are limited by the power of test statistics derived from available samples with exome sequencing. And yet this algorithm has already yielded a rich har-vest of potential risk genes. Emerging ASD sequencing data, based on larger sample sizes, will greatly improve the quality of genetic information going into the algo-rithm, which will further enhance the power of DAWN to identify subnetworks of risk genes.
Additional files
Additional file 1: Table S1.Summary of all available gene expression samples from [16].
Additional file 2: Figure S1.Network analysis of gene expression in the frontal cortex (PFC-MSC) and distribution of risk ASD (rASD) genes within modules for periods 3–5 and 4–6.(A)Dendrogram produced by hierarchical clustering of gene co-expression in periods 4–6 using WGCNA. Modules of co-expressed genes are delineated by color. In the second depiction of the dendrogram, rASD genes are highlighted with a color according to module membership; other genes are colored in gray. Counts are number of rASD genes per module. Most rASD genes fall in tight clusters within modules, and yet they fall in many distinct modules. (B)As above, but for periods 3–5.
Additional file 3: Table S2.Sets of overlapping gene modules formulated using four criteria: correlation at developmental periods 3–5 and 4–6, both with modules created using powers 1 and 6 to define the adjacency matrix in WGCNA. By varying the definition of adjacency slightly we capture more of the features of the gene clusters. *Median (1st, 3rd quantile).
Additional file 4: Table S3.Number of modules in periods 3–5 and periods 4–6 analysis. Ideally modules successfully split the genes into clustered subsets with strong correlations within a module and weak correlations across modules. Not surprisingly this is an imperfect process and modules create some artificial boundaries that separate genes with fairly strong levels of correlation. One method for module construction involves choosing a power that produces a scale-free topology; however, this choice yielded a large number of small modules that was unsuitable for the planned analysis. We chose powers 1 and 6 to span a range of plausible modules. Power 6 yielded smaller and more numerous modules than power 1 for both time periods; moreover, many of the power 6 modules were quite small and not suitable for the planned network analysis (Additional file 2: Figure S1). For power 6, many of these small modules could be successfully merged together based on the eigengenes. In contrast, power 1 produced larger modules and merging via eigengenes led to one very large module that was also not suitable for the network analysis (Additional file 2: Figure S1). To obtain a reasonable collection of mid-sized modules we use the unmerged modules for power 1 and the
merged modules for power 6. Notably, this choice produced a similar number of modules for each choice of power and many of these modules were of similar size.
Additional file 5: Table S4.Statistics for all genes analyzed in periods 3–5 and 4–6. The summary tab is a summary of results over all four modular representations (powers 1 and 6 for periods 3–5 and 4–6). For the rASD and nASD columns, a gene was labeled ‘yes’ if it was identified in any of the four module sets. min_FDR (network score) is the minimum (maximum) value over all four module sets. In the annotation column, 0, 1 or 2 represents a gene with 0, 1, or at least 2 identified dnLoF mutations, respectively. Tabs period4–6 and period3–5 provide similar information for each separate time period. The rASD_p4-6 and rASD_p3-5 tabs provide validation scores for rASD genes identified in the analysis of periods 4–6 and 3–5, respectively. The rASD_correlation tab gives the set of neighboring genes for all rASD genes (i.e., rASD genes with|r|>.7). Additional file 6: Figure S2.Identifying ASD genes and subnetworks by a network analysis of gene expression and association statistics. (A) Gene co-expression networks derive from pairwise correlations of gene expression. After sorting genes into modules by using WGCNA, some genes cluster into highly connected units, called supernodes, which are identified by cutting the hierarchical tree at .75. (B) Each node is represented by a Z-score derived from the TADAPvalue. Supernodes are represented by the score associated with the minimumPvalue of all genes in the node. An adjacency matrix connects nodes with absolute correlation greater than .7. (C) A hidden Markov random field model is used to model correlation of theZ-scores across the gene network. (D) The modeling process yields subnetworks with evidence for involvement in risk for ASD, and the entire set of genes involved in associated subnetworks are called network ASD genes (nASD). On the left, red balls indicate nodes with relatively largeZ-scores, prior to network analysis. On the right, red balls delineate nodes that are identified as nASD genes based on clustering of signal. Unconnected nodes tend to turn blue and tightly connected nodes turn red. The top module displays a tightly clustered signal; the bottom one is unclustered, and no nASD genes are identified. (E) A small module illustrates details. (F) To identify genes likely to affect risk for ASD (rASD), all nASD genes are examined further based on theirZ-scores. (G) For large supernodes, risk genes are determined based on clustering of signal in the Z-score within a supernode; for small supernodes and singleton nodes the delineation is determined purely byZ-score.
Additional file 7: Text S1.Detailed description of the DAWN algorithm. Additional file 8: Figure S3.Distribution of network scores across genes from the frontal cortex.(A)Box plots of network scores for genes divided into three categories: non-nASD genes, nASD genes (excluding rASD genes) and rASD genes. Results are displayed for periods 4–6 (yellow) and 3–5 (orange).(B)Correlation of network scores by time period for the set of nASD gene found in both time periods. The red dashed line is the diagonal liney=x.
Additional file 9: Figure S4.Distribution ofZ-scores based on TADAP values for all nASD genes. Genes that are also rASD genes are colored in red, and the remainder are colored dark cyan.
Additional file 10: Figure S5.Discovery rate of genes withde novoLoF mutations as the signal becomes more diluted. Two dilution experiments were performed:(A)weakening thePvalue signal and(B)weakening the correlation structure. The number ofde novogenes identified (#dnLoF) is plotted in blue, as a function of the dilution of the signal, ranging from 0 to 100%, and the HMRF parameterc, which measures the strength of clustering of signal in the networks, is plotted in orange. The standard error of the estimates is indicated with error bars.
Additional file 11: Table S5.Summary ofde novovariants identified for 44 selected genes for the MIPS experiment.
Additional file 12: Figure S6.PPI network of all rASD genes. The edge information was obtained using DAPPLE [79].
Additional file 13: Figure S7.Enrichment analysis using genes from the clusters shown in Figure 4 with the ChEA, Wikipathways, GO_biological Process, MGI_Mouse Phenotype and Human Gene Atlas gene-set libraries.
which has no signal of association in its TADA score, was not identified as an rASD gene.
Additional file 15: Table S6.The list of GO-identified rASD genes. Additional file 16: Table S7.Correlations amongst neurexin and neuroligin genes for periods 4–6 (top) and 3–5 (bottom).
Abbreviations
ASD: autism spectrum disorder; BP: biological process; DAWN: detecting association with networks; dnLoF:de novoloss of function; FDR: false discovery rate; FET: Fisher’s exact test; GO: gene ontology; LoF: loss of function; MF: molecular function; MGI: mouse genome information; MIPS: molecular inversion probe sequencing; MP: molecular phenotype; nASD: network autism spectrum disorder; PFC-MSC: prefrontal and motor-somatosensory neocortex; PPI: protein-protein interaction; rASD: risk autism spectrum disorder; TADA: transmission andde novoassociation; WGCNA: weighted correlation network analysis.
Competing interests
The authors declare that they have no competing interests.
Authors’ contributions
LL conceived of the analysis, developed and refined the DAWN statistical software, implemented the analysis, wrote the manuscript and produced graphics. JL conceived of the analysis and commented on the manuscript. SJS and AJW implemented the analysis, produced graphics, and revised and edited the manuscript. YK and AEC implemented the analysis and produced graphics. LK, CL and XH implemented the analysis. ML compiled and analyzed the data. RAM and AM revised and edited the manuscript. JPN, NS and MWS conceived the study, provided financial support and revised and edited the manuscript. KM and JB conceived the study and wrote the manuscript. BD and KR conceived of the analysis, provided financial support and wrote the manuscript. All authors read and approved the final manuscript.
Acknowledgments
This work was supported by National Institute of Mental Health grants MH057881, MH100233, a gift from the Overlook International Foundation, a grant from the Simons Foundation, and a grant from the Seaver Foundation. We thank the members of the Devlin and Roeder labs for thought-provoking discussion of the ideas presented here.
Author details
1Department of Statistics, Carnegie Mellon University, Pittsburgh, PA, USA. 2Department of Psychiatry, University of California, San Francisco, CA, USA. 3Department of Genetics, Yale School of Medicine, New Haven, CT, USA. 4Seaver Autism Center for Research and Treatment, Icahn School of Medicine
at Mount Sinai, New York, NY, USA.5Department of Pharmacology and Systems Therapeutics and Systems Biology Center New York, Icahn School of Medicine at Mount Sinai, New York, NY, USA.6Ray and Stephanie Lane Center for Computational Biology, Carnegie Mellon University, Pittsburgh, PA, USA. 7Department of Psychiatry, University of Pittsburgh School of Medicine,
Pittsburgh, PA, USA.8Kavli Institute for Neuroscience, Yale School of Medicine, New Haven, CT, USA.9Department of Neurobiology, Yale School of Medicine, New Haven, CT, USA.10Child Study Center, Yale School of Medicine, New Haven, CT, USA.11Department of Pathology, University of Pittsburgh School of Medicine, Pittsburgh, PA, USA.12Program on Neurogenetics, Yale School of Medicine, New Haven, CT, USA.13Department of Psychiatry, Yale School of Medicine, New Haven, CT, USA.14Departments of Psychiatry, Neuroscience, and Genetics and Genomic Sciences, Friedman Brain Institute and Mindisch Child Health and Development Institute, Icahn School of Medicine at Mount Sinai, New York, NY, USA.
Received: 24 November 2013 Accepted: 3 February 2014 Published: 6 March 2014
References
1. Buxbaum JD, Daly MJ, Devlin B, Lehner T, Roeder K, State MW, Barrett J, Bilder D, Boerwinkle E, Brudno M, Burbach P, Buxbaum JD, Camp N, Chahrour M, Cook EH, Coon H, Coppola G, Coulter M, Cutler D, Daly MJ, dePristo M, Devlin B, Eichler EE, Fromer M, Geschwind DH, Gibbs RA, Gill M, Goldberg AP, Haines JL, et al.:The autism sequencing consortium:
large-scale, high-throughput sequencing in autism spectrum disorders.Neuron2012,76(6):1052–1056.
2. Sanders SJ, Ercan-Sencicek AG, Hus V, Luo R, Murtha MT, Moreno-De-Luca D, Chu SH, Moreau MP, Gupta AR, Thomson SA, Mason CE, Bilguvar K, Celestino-Soper PB, Choi M, Crawford EL, Davis L, Wright NR, Dhodapkar RM, DiCola M, DiLullo NM, Fernandez TV, Fielding-Singh V, Fishman DO, Frahm S, Garagaloyan R, Goh GS, Kammela S, Klei L, Lowe JK, Lund SC, et al.:Multiple recurrentde novo, CNVs, including duplications of the 7q11.23 Williams syndrome region, are strongly associated with autism.Neuron2011,70(5):863–885.
3. Pinto D, Pagnamenta AT, Klei L, Anney R, Merico D, Regan R, Conroy J, Magalhaes TR, Correia C, Abrahams BS, Almeida J, Bacchelli E, Bader GD, Bailey AJ, Baird G, Battaglia A, Berney T, Bolshakova N, Bolte S, Bolton PF, Bourgeron T, Brennan S, Brian J, Bryson SE, Carson AR, Casallo G, Casey J, Chung BH, Cochrane L, et al.:Functional impact of global rare copy number variation in autism spectrum disorders.Nature2010, 466(7304):368–372.
4. Iossifov I, Ronemus M, Levy D, Wang Z, Hakker I, Rosenbaum J, Yamrom B, Lee YH, Narzisi G, Leotta A, Kendall J, Grabowska E, Ma B, Marks S, Rodgers L, Stepansky A, Troge J, Andrews P, Bekritsky M, Pradhan K, Ghiban E, Kramer M, Parla J, Demeter R, Fulton LL, Fulton RS, Magrini VJ, Ye K, Darnell JC, Darnell RB, et al.:De novogene disruptions in children on the autistic spectrum.Neuron2012,74(2):285–299.
5. Kong A, Frigge ML, Masson G, Besenbacher S, Sulem P, Magnusson G, Gudjonsson SA, Sigurdsson A, Jonasdottir A, Jonasdottir A, Wong WS, Sigurdsson G, Walters GB, Steinberg S, Helgason H, Thorleifsson G, Gudbjartsson DF, Helgason A, Magnusson OT, Thorsteinsdottir U, Stefansson K:Rate ofde novomutations and the importance of father’s age to disease risk.Nature2012,488(7412):471–475. 6. Neale BM, Kou Y, Liu L, Ma’ayan A, Samocha KE, Sabo A, Lin CF, Stevens C,
Wang LS, Makarov V, Polak P, Yoon S, Maguire J, Crawford EL, Campbell NG, Geller ET, Valladares O, Schafer C, Liu H, Zhao T, Cai G, Lihm J, Dannenfelser R, Jabado O, Peralta Z, Nagaswamy U, Muzny D, Reid JG, Newsham I, Wu Y, et al.:Patterns and rates of exonicde novo
mutations in autism spectrum disorders.Nature2012, 485:242–245.
7. O’Roak BJ, Deriziotis P, Lee C, Vives L, Schwartz JJ, Girirajan S, Karakoc E, Mackenzie AP, Ng SB, Baker C, Rieder MJ, Nickerson DA, Bernier R, Fisher SE, Shendure J, Eichler EE:Exome sequencing in sporadic autism spectrum disorders identifies severede novomutations.Nat Genet 2011,43(4):585–589.
8. O’Roak BJ, Vives L, Girirajan S, Karakoc E, Krumm N, Coe BP, Levy R, Ko A, Lee C, Smith JD, Turner EH, Stanaway IB, Vernot B, Malig M, Baker C, Reilly B, Akey JM, Borenstein E, Rieder MJ, Nickerson DA, Bernier R, Shendure J, Eichler EE:Sporadic autism exomes reveal a highly interconnected protein network ofde novomutations.Nature2012,
485(7397):246–250.
9. Sanders SJ, Murtha MT, Gupta AR, Murdoch JD, Raubeson MJ, Willsey AJ, Ercan-Sencicek AG, DiLullo NM, Parikshak NN, Stein JL, Walker MF, Ober GT, Teran NA, Song Y, El-Fishawy P, Murtha RC, Choi M, Overton JD, Bjornson RD, Carriero NJ, Meyer KA, Bilguvar K, Mane SM, Sestan N, Lifton RP, Gunel M, Roeder K, Geschwind DH, Devlin B, State MW, et al.:De novo
mutations revealed by whole-exome sequencing are strongly associated with autism.Nature2012,485(1):82–93.
10. Anney R, Klei L, Pinto D, Almeida J, Bacchelli E, Baird G, Bolshakova N, Bolte S, Bolton PF, Bourgeron T, Brennan S, Brian J, Casey J, Conroy J, Correia C, Corsello C, Crawford EL, de Jonge M, Delorme R, Duketis E, Duque F, Estes A, Farrar P, Fernandez BA, Folstein SE, Fombonne E, Gilbert J, Gillberg C, Glessner JT, Green A, et al.:Individual common variants exert weak effects on risk for autism spectrum disorders.Hum Mol Genet2012,21(21):4781–4792.
11. Klei L, Sanders SJ, Murtha MT, Hus V, Lowe JK, Willsey AJ, Moreno-De-Luca D, Yu TW, Fombonne E, Geschwind D, Grice DE, Ledbetter DH, Lord C, Mane SM, Lese Martin C, Martin DM, Morrow EM, Walsh CA, Melhem NM, Chaste P, Sutcliffe JS, State MW, Cook EH Jr, Roeder K, Devlin B:Common genetic variants, acting additively, are a major source of risk for autism.Mol Autism2012,3(9).