An Appropriate Stepwise Solution for Design of Speed Box –
A Practical Approach
Pravin S.Ghawade
Assistant Professor, Jawaharlal Darda Institute of Engg & Technology, Yavatmal (India) Email ID : [email protected]
Tushar B.Kathoke
Assistant Professor, Jawaharlal Darda Institute of Engg & Technology, Yavatmal (India) Email ID : [email protected]
Satish B. Chawale
Assistant Professor, Jawaharlal Darda Institute of Engg & Technology, Yavatmal (India) Email ID : [email protected]
Ravikant V. Paropate
Assistant Professor, Jawaharlal Darda Institute of Engg & Technology, Yavatmal (India) Email ID : [email protected]
Ranjan K.Waghchore
Assistant Professor, Organization : Jawaharlal Darda Institute of Engg & Technology, Yavatmal (Indi) Email ID : [email protected]
Abstract — Gears have been in use since the age of civilization for transmission of power. The process of gear design is an extremely vast and critical area, and a whole research coverage in such work is not possible. A review of relevant literature in the areas of optimized design of spur gear indicates that compact design of spur gears involves a complicated algebraic analysis. The present work describes the development of such a design methodology and diagnostic tool for determining the number of gear teeth on gears for a optimum shape of gear box including structure and ray diagrams with stepwise solution. The ray diagram is also considered for finding out the minimum diameter and maximum transmission range.
Keyword — Structural Diagram, Ray Diagram,
Stage restriction criteria, Ray restriction criteria.
1. I
NTRODUCTIONThe ease of Machine Tools manufacture and its operations is solely depends upon the simplicity of its design. The location of speed boxes i.e. gear boxes which are employed in machine tools are in main Drive and its principles of designing are dealt with stepped regulation of speed only in certain discrete values of the spindle rpm. [1]The present work has been done by developing ray diagram to find out the best transmission ratio and speeds on the different shafts of the gearbox and describes the development of such a design methodology and diagnostic tool for determining the number of gear teeth on gears for a optimum shape of gear box including structure and ray diagrams with stepwise solution. The
essential information required for designing a Gear box are as follows.[1] [2] [3]
1. The lowest output rpm, n min 2. The highest output rpm, n max
3. The number of steps z into which the range between n max and n min is divided and
4. The number of stages in which the required number of speed steps are to be achieved.
2.
L
ITERATURE REVIEWAncient engineers were aware of the desired performance parameters such as a gear ratio, center distance and available power source (water current, wind, horse power) and used them to define the gear parameters (diameters, number and shape of the teeth). They then manufactured gears using available materials, technology and tools. A review of relevant literature in the areas of optimized design of spur gear indicates that compact design of spur gears involves a complicated algebraic analysis. Various researchers had worked for the designing of the reduction unit, from which they concluded that design is based on the fatigue failures of the gears.[4] The present work describes the development of such a design methodology and diagnostic tool for determining the number of gear teeth on gears for a optimum shape of gear box including structure and ray diagramswith stepwise solution. Also the present work can be utilized to determine the optimized design of the gear box unit using ray diagrams.
3
P
ROBLEM DEFINITIONCopyright © 2014 CTTS.IN, All right reserved sequence in text books and reference book. This is quite
confusing to solve a complete solution for a design gear box. The present work gives a complete stepwise solution for a gear box.
4. P
ROCEDUREF
ORS
TEPWISE SOLUTION4.1STRCTURAL DIAGRAM
The structural diagrams are drawn from the structural formulae which is a graphical tool used to find the range ratio of transmission groups. The structural diagram gives information about the number of shafts and the number of gears on each shaft. The order of changing transmissions in individual groups to get the desired spindle speed and The transmission range and characteristics of each group.
4.2 RAY DIAGRAM
The structural diagram only depicts the range ratio whereas with the help of ray diagram the transmission ratio of all transmissions and the rpm values of gear box shafts can be determined. So it is necessary to plot the speed chart to determine the transmission ratio. The line joining points of adjacent shafts in a speed chart depict the transmission ratios. If:
1. The line is horizontal, it corresponds to transmission ratio i=1, i.e. no speed change.
2. The line is inclined upward, it depicts i>1, i.e., speed increase.
3. The line is inclined downward, it depicts i<1, i.e., speed reduction.
While plotting the speed chart it is desirable to have the minimum transmission ratio, i.e. maximum speed reduction.
To illustrate the design procedure for optimal gear pair, the following example has been considered. Here the gear box having twelve speed steps, that is z=12, has been realized in three stages that is u=3. The maximum input speed (nmax) has been taken as 1500 rpm and geometric progression ratio (Φ) has been taken as 1.41. The motor speed (Nm) is 1440 rpm. The twelve speed steps may be distributed in three stages as discussed below:
Formulae required 1) Rn= Nz /N1= Øz-1
where N1= Nmin Nz = Nmax Rn= Range ratio
Z= No. of speed steps Ø = Progression Ratio 2) Ø= Rn( 1/z-1)
3) Z= log Rn. Ø/ logo Ø
4) Structural Formula Z= p1(x1) p2(x2) p3(x3) where p1= No. of speed steps in transmission group p1(x1) and x1 its characteristics
5) Im= Ø(pm-1) xm where pm= No. of speed steps in mth group and xm= its characteristics,Im= transmission range of mth group.
6) transmission ratio restriction (ig ≤ 8)
The transmission range of group= ig = imax/ I min = 2/(1/4) =8
Where imax= 2 & I min= ¼
7) minimum tot shaft size (Σ d=min) x1≤ x2 ≤ x3 ≤ ….. ≤ xu-1 ≤ xu
The best version which ensures that it will be one in which the n min values of the intermediate shafts are maximum and n max values of the intermediate shafts re minimum
8) U = No. stages
Design speed box or gear box From the given Data =N min = 30 rpm N max = 1500 rpm,Z= 12 u=3 Ø= 1.41 Nm= motor speed =1440 rpm
Solution: step I) Z= 12= 2 X 3X2 ( here u=3 from factors)Obtain six structural formulae for six Structure Diagrams
a) z= p1(x1)p2(x2)p3(x3)
here x1= 1 x2= characteristics of x1= p1=2 & x3=characteristics of x1x2= p1p2 =2x3= 6
Z= 2(1)3(2)2(6)
b) z= p1(x1)p2(x3)p3(x2)
here x1= 1 x2= characteristics of x1= p1=2 & x3=characteristics of x1x2= p1p3=2x2= 4
Z= 2(1)3(4)2(2)
c) z= p1(x2)p2(x1)p3(x3)
here x1= 1 x2= characteristics of x1= p2=3 & x3=characteristics of x1x2= p2p1=3x2= 6
Z= 2(3)3(1)2(6)
d) z= p1(x3)p2(x1)p3(x2)
here x1= 1 x2= characteristics of x1= p2=3 & x3=characteristics of x1x2= p2p3=3x2= 6
Z= 2(6)3(1)2(3)
e) z= p1(x2)p2(x3)p3(x1)
here x1= 1 x2= characteristics of x1= p3=2 & x3=characteristics of x1x2= p3p1=2x2= 4
Z= 2(2)3(4)2(1)
f) z= p1(x3)p2(x2)p3(x1)
here x1= 1 x2= characteristics of x1= p3=2 & x3=characteristics of x1x2= p3p2=2x3=6 Z= 2(6)3(2)2(1)
Procedure
1) Draw u+1 vertical line at convenient distance where u= No.of stages (for above formula u=3 three transmission group)
Note : first vertical line represent the transmission from motor shaft and the rest represent the transmission groups of speed box.
2) Draw array of horizontal lines is equal to the number of speed steps z of speed intersecting the vertical lines distance of log Ø from each other. Steps 3) from the above structure diagram selection of best structure diagram
1) Transmission ratio restriction
Ig ≤ I max/ I min = 2/(1/4) =8 & Im= Ø(pm-1)xm
Now Analyze structure diagram from a to e we get. Apply stage restriction or transmission ratio restriction condition:
For Fig 1)Between shaft I & II m=1, ig= imax/imin = ф(p1-1)X1
= ф(2-1)1 = ф1= ф Between shaft II & III
m=2, ig= imax/imin = ф(p2-1)X2 = ф(3-1)2 = ф4 Between shaft III & IV
m=3, ig= imax/imin = ф(p3-1)X3
= ф(2-1)6 = ф6 Hence the maximum transmission range for Fig.1 is ф6
For Fig 5)Between shaft I & II m=1, ig= imax/imin = ф(p1-1)X1
= ф(2-1)2 = ф2 Between shaft II & III
m=2, ig= imax/imin = ф(p2-1)X2
= ф(3-1)4 = ф8 Between shaft III & IV
m=3, ig= imax/imin = ф(p3-1)X3
= ф(2-1)1 = ф
Hence the maximum transmission range for Fig 5 is ф8 For Fig 3)Between shaft I & II
m=1, ig= imax/imin = ф(p1-1)X1
= ф(2-1)3 = ф3 Between shaft II & III
m=2, ig= imax/imin = ф(p2-1)X2
= ф(3-1)1 = ф2 Between shaft III & IV
m=3, ig= imax/imin = ф(p3-1)X3
= ф(2-1)6 = ф6 Hence the maximum transmission range for Fig 3 is ф6
Copyright © 2014 CTTS.IN, All right reserved 15.622<=8 (condition is Not satisfied)
Hence select structural figures 1,3,4 & 6.
II) Apply minimum shaft size criterion i.e Σdmin i.e x1<x2<x3
for fig 1) x1<x2<x3(satisfy) For fig 3 )x1<x2<x3(Not satisfy) For fig 4 )x1<x2<x3(Not satisfy) & for fig 6) x1<x2<x3(Not satisfy)
From above fig 1 satisfies both condition. Also, maximum speed on intermediate shaft is minimum and minimum speed on intermediate shaft is maximum for fig (1) as compared to fig (3),(4) & (6).
III) fig( 1) is more narrow towards the starting point i.e. input point. Hence fig (1) is BEST VERSION OF STRUCTRAL DIAGRAM.
For best structure diagram following guidelines are important.
1)The number of gears on the last shaft (spindle) should be minimum possible.
2)The transmission ratio between spindle and the shaft preceding it should be the maximum possible i.e. speed reduction should be the maximum possible.
3)The structure diagram shod be narrow towards the starting point (on input shaft) i.e. parabolic in nature. Step 4) RAY DIAGRAM (SPEED CHART) NOTE: Draw possible ray diagrams According to geometric progression series
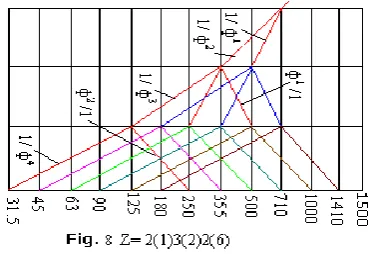
The No. of speeds in steps are 31.5 45 63 90 125 180 250 355 500 710 1000 1410
Procedure for potting Ray diagram
Draw z+1 No. of vertical lines i.e. one greater than in the structure diagram
Draw 4 horizontal lines intersecting the vertical lines at convenient distance. Use of speed in steps if Nz>Nm draw z No. of horizontal lines + one line=12 +1 =13. Draw the rays depicting transmission between shaft and the shaft preceding it. The rays are drawn from the lowest rpm of last shaft keeping in mind the transmission ratio restriction condition imax≤ 2 and I min>=1/4.In our problem the transmission range of the last group is ф6
for ф=1.41 on divided only in one possible manner.
I max= 2 = ф2
[(1.41)2 = 1.9881] I min = 1/4 = 1/ ф4
[(1.41)4 = 3.9525] (ф6
= ф2. ф4 ) [1]
For section of best ray diagram following are the conditions:
1) It should have concave shape.
2) Gear ratio i.e..ray restriction conditions be satisfied i.e. (ф6
=6)
3) Stage restriction condition should be satisfied i.e. (ф6 = 8)
4) Nodal sum should be minimum.[2]
Table(1) Compare between Fig7 and Fig8
Fig 7 Fig 8 Gear ratio ( ray restriction) Ф4 Ф4 Stage restriction (Rs) Ф6 Ф6 Summation of Node should
be minimum
3+5+9+ 13=30
4+6+9+13 =32 Determination of Number of Teeth
Here z= 12 = 2 X 3 X 2
Hence No. of gears in gear train = 2( 2+3+2) =14 From fig7 speed chart between shaft I & II Here number of rays = 02
In this arrangement for stage I Ray= U1 = 1/ Ф2
= 1/(1.41)2 = 1/1.9881 = 0.502 Ray= U2 = 1/ Ф1
= 1/(1.41)1 = 1/1.41 = 0.7092
Table (2) Conversion of Fraction into form of Numerator and Denometer
Uj 1/ ф Fi/ gj Fj+gj U1 1/ 1.988 1/2 3 U2 1/1.41 5/7 12
The L.C..M. OF 3 12 IS 12
The maximum power involves the minimum size gear hence Umin =1/2= f/g
Here fmin = 1 where fmin /fmin+g = 1/1+2 = 1/3 This leads to
E X K X fmin/ fmin+g >= 17 E X 12 X 1/3 >= 17
From which E >= 17 x 3 / 12 E >= 51/12
E= 4.25 = 5,Thus c =EK C= 5X 12 =60.
The Gear teeth are
Z4 = c X fi/ fj+ gj = 60 X 7/12 = 35 In this arrangement for stage II
Ray= U1 = 1/ Ф4 = 1/(1.41)4 = 1/3.9525 = 0.2530 Ray= U2 = 1/ Ф2
= 1/(1.41)2 = 1/1.9881 = 0.502 Ray= U3 = 1/ Ф0
= 1/(1.41)0 = 1/1
Table (3) Conversion of Fraction into form of Numerator and Denometer
Uj 1/ ф Fi/ gj Fj+gj U1 1/ 3.9525 3/12 15 U2 1/1.988 1/2 3
U3 1/1 1/1 2
The L.C..M. OF I5, 3, 2 is equal to 30.The maximum power involves the minimum size gear hence Umin =3/12= f/g, Here
fmin = 3 where fmin/fmin+g = 3/3+12 = 3/15 This leads to E X K X fmin/ fmin+g >= 17 E X 30 X 3/15 >=17
From which E>= 2.833 =3 Thus c =EK, C= 3X 30 =90 The Gear teeth are
Z5 = c X fi/ fj+ gj = 90 X 3/15= 18 Z6 = c X gi/ fj+ gj = 90 X 12/15 = 72 And Z7 = c X fi/ fj+ gj = 90 X 1/3= 30
Z8 = c X gi/ fj+ gj = 90 X 2/3 = 60 And Z9 = c X fi/ fj+ gj = 90 X 1/2 = 45 Z10 = c X gi/ fj+ gj = 90 X 1/2 = 45 In this arrangement for stage III Ray= U1 = 1/ Ф4
= 1/(1.41)4 = 1/3.9525 = 0.2530 Ray= U2 = Ф2 /1 =(1.41)2 =1.9881
Table (4) Conversion of Fraction into form of Numerator and Denometer
Uj 1/ ф Fj/ gj Fj+gj U1 1/ 3.9525 3/12 15
U2 1.988 2/1 3
The L.C..M. OF I5, 3 is equal to 15.The maximum power involves the minimum size gear hence Umin =3/12= f/g, Hence
fmin = 3 where fmin/fmin+g = 3/3+12 = 3/15 This leads to E X K X fmin/ fmin+g >= 17 E X 15 X 3/15 >=17
From which E>= 5.66 =6 Thus c =EK, C= 6X15 =90 The Gear teeth are
Z11 = c X fi/ fj+ gj = 90 X 3/15= 18 Z12= c X gi/ fj+ gj = 90 X 12/15 = 72 And Z13 = c X fi/ fj+ gj = 90 X 2/3= 60 Z14= c X gi/ fj+ gj = 90 X 1/3 = 30
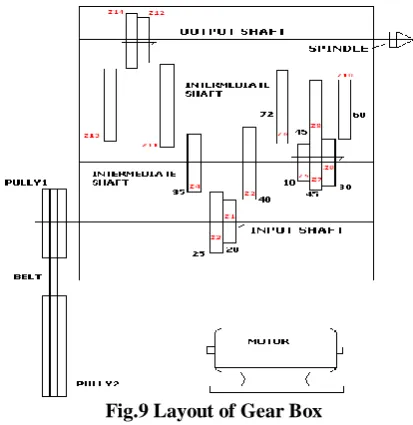
Fig.9 Layout of Gear Box
C
ONCLUSIONThis solution can be carried out to find out the optimized design of the gearbox for compact machine tools. Also the stepwise solution of this present work would be helpful to a design engineer in saving time and reducing complexity for design a Gear box. The ray diagrams are incorporated to make the design more feasible with respect to the transmission ratio and number of teeth used in gearbox.
R
EFERENCE[1] N.K.Mehata,”Machine Tool Design and Numerical control”, Tata McGraw- Hill Publishing Company Limited, ISBN 0-07-462237-4, 1996.
[2] G. C. Sen, A. Bhattacharya, “New Control Book Agency Pvt. Ltd., 8/1 Chintamani Das Lane, KolKatta 700009, ISBN NO. 81-738111555, 2006 [3] S.K.Basu, D.K.Pal” Design of Machine Tools”
oxford & IBH Publishing co.pvt. ltd, New Delhi, ISBN 978-81-204-1721-2, 2009
[4] Faisal S. Hussain, ”Optimization of Gear Reduction Unit Through Ray Diagram”, International Journal of Advanced Engineering and Global Technology, Vol-1, pp-185-191, issue-4, 28 November 2013.
[5] Bush, G. S., Osman, O. M. and Sankar, S., ”On the optimal design of multi speed gear trains”, Mechanism and machine theory, Vol. 19, pp 183-195, 2005
[6] Rao, S. S. and Eslampour, H. R., “Multistage multi objective optimization of gearboxes”, Journal of Mechanisms, Vol.108, pp 461-468, December 1986.