____________________________________________________________________________________________ 4(1): 14-62, 2014
SCIENCEDOMAINinternational www.sciencedomain.org
The Nutrition Report 2012 Summary
Peter Stehle
1* 1German Nutrition Society, Science Department, Godesberger Allee 18, 53175 Bonn,Germany.
Author’s contribution This whole work was carried out by the author PS, German Nutrition Society.
Received 15thNovember 2013 Accepted 15thNovember 2013
Published 20thDecember 2013
ABSTRACT
The German Nutrition Society publishes a national Nutrition Report on behalf of the Federal Ministry of Food, Agriculture and Consumer Protection on a regular basis. Lastly the 12th Nutrition Report was published in December 2012. The Nutrition Report 2012 is
an important instrument for those responsible in nutrition and health policy, and also for food manufacturers, for the public, nutritionists, dieticians and the media.
This paper is a short version of the Nutrition Report 2012 published by the German Nutrition Society. The five chapters of this report are providing substantial information about the nutritional situation in Germany, a review of the prevalence of pre-obesity and obesity in Germany, a description of the nutritional situation of seniors with need of care in private homes in Germany (ErnSiPP Study) and data about the situation, quality and satisfaction with “meals on wheels”. Aspects of food safety are always of broad public interest and so we continue to describe toxicological and microbiological aspects of nutrition. Continuing the former Nutrition Reports and the report of the World Cancer Research Fund of 2007, a systematic analysis of the relation between nutrition and carcinogenesis was pursued evaluating the current evidence according to the guidelines of the German Nutrition Society. Furthermore the influence of phytochemicals on human health was described updating the information of the last three Nutrition Reports. Within each chapter, methodology, results and evaluation are described.
Keywords: Food intake; nutrient intake; seniors; meals on wheels; food safety; prevention; cancer; phytocemicals.
ADDITIONAL INFORMATION
This is the complete english summary of the Nutrition Report 2012 also published as booklet (www.dge.de/pdf/en/DGE-Nutrition-Report-summary-2012.pdf). The long version of this Nutrition Report (more than 400 pages) is only available in German. It is cited as reference to the manuscript [1]. The German long version is available for purchase as a book (www.dge-medienservice.de/ernahrungsbericht-2012.html).
1. NUTRITIONAL SITUATION IN GERMANY
1.1 Trend Analysis of Food Consumption on the Basis of Agricultural
Statistics
1.1.1 Methodology
The basis for calculating the long-term trend analysis is formed by the agricultural statistics compiled by the Federal Statistical Office and each federal ministry responsible for agriculture which are published every year in the statistical yearbook on nutrition, agriculture and forestry (Section “D. Food Economy”). The corresponding data are recorded on the production or wholesale level (official company statistics) or on the basis of estimates of the food quantities in question based on tax revenue. The agricultural statistics show the food quantities available for consumption throughout the entire German economy; these are classed as “food consumption” for evaluation purposes. The listed quantities also contain food items which are not consumable (e. g. bones, peelings) or not intended for human consumption (e. g. used for animal feeding). For this reason, the listed annual “food consumption” per capita is usually higher than the quantities actually consumed. Due to the data collection methods which have been comparable for decades, it is possible to evaluate trends. Linear regression analysis was conducted for this purpose. In the presence of a significant regression coefficient β, the average annual change in per capita consumption is very probably different from zero (error probability p < 0.05; significant trend).
To obtain a nutritional physiological evaluation of food consumption, the listed data are set in relation to the food-related recommendations of the DGE to maintain a balanced, whole-some diet.
1.1.2 Results
Increased consumption of vegetables, citrus fruits, cheese, poultry meat and fish accompanied by a simultaneous decrease in the consumption of rye, potatoes, alcohol (calculated as aqueous ethyl alcohol), butter and vegetable fats (including margarine) are characteristic of the long-term development of food consumption per capita of the population in Germany from the 1950s until 2010. The consumption of grain products and fresh fruit is only changing slightly. Consumption of sucrose (sugar) rose considerably between the 1950s and 1980s and remains at this high level to this day. Per capita sugar consumption was recalculated due to the increasing use of sugar beets for bioethanol production and for this reason, no trend statements are currently possible. Glucose consumption today is almost twice as high as it was roughly 20 years ago.
average of 1.2 kg, but it was only the consumption of durum wheat, maize and oats that increased, whereas the significant decline in rye consumption continues.
Pasta and rice consumption has increased by an average of 220 g and 150 g respectively, whereas consumption of legumes dropped slightly by approx. 40 g. This also applies to bread and bread rolls (average reduction approx. 200 g), with potato consumption also falling by an average of approx. 1.3 kg. Total vegetable consumption (Fig. 1) shows average annual growth rates of approx. 1.1 kg attributable above all to the increases in the consumption of tomatoes (approx. 600 g), onions and carrots (approx. 130 g and 180 g respectively), leaf and stalk vegetables (approx. 100 g) and cucumbers (approx. 70 g).
In contrast, there was a significant decline in the consumption of cabbage (approx. 150 g) and fresh legumes (approx. 50 g). Fruit consumption shows a reduction by an average of approx. 800 g caused above all by the decrease in the consumption of apples and peaches (approx. 600 g and 90 g respectively). Among the tropical fruits, there was a reduction above all in the consumption of bananas, lemons, grapefruit and other citrus fruits. With the berry fruits, a significant increase can only be recognised for the blackberry, blueberry, cranberry group (average 40 g). In the confectionery area, the consumption of gumdrops and jelly products increased by an average of 70 g, as opposed to consumption of hard and soft caramel and honey which decreased by an average of 15 g and 25 g respectively. The biggest shift in this food group was in the consumption of chocolate goods which showed a significant increase of approx. 150 g on average.
cheese, whereas there was a decline in cream cheese consumption by an average of 330 g. With meat, an increase in the consumption of poultry meat by an average of approx. 120 g was observed. Consumption of offal is in decline (average decrease approx. 100 g). Where beverage consumption is concerned there are significant increases with mineral water and refreshing drinks (on average approx. 2.9 l and 1.1 l respectively). Consumption of fruit juices (including fruit nectars and vegetable juices), on the other hand, has declined by an average of approx. 0.5 l. An overall decline, if only slight, is still being experienced with coffee consumption, with an average of approx. 30 g of beans (equivalent to approx. ¾ l of liquid coffee) and tea consumption with an average of approx. 2 g (equivalent to approx. ¼ l of liquid tea). There has also been a further reduction in alcohol consumption (minus 70 ml), with beer being affected most severely by this development with a decline averaging approx. 2 l. There was also a slight reduction in the consumption of spirits (approx. 50 ml).
1.1.3 Evaluation
decrease in the consumption of spreadable fats is regarded as favourable because it reduces total fat consumption. As the consumption of vegetable oil is also on the decline, the ratio of (poly-) unsaturated to saturated fatty acids should be affected negatively. Due to the fact that grain (wheat) is also used for bioethanol production, and grain consumption is only increasing very slowly, it has to be assumed that consumption is probably too low to achieve the desired increase in the intake of grain dietary fibres. The consumption of sugar-sweetened refreshing drinks should not increase even further, especially among children and teenagers, but should be significantly reduced. From a nutritional perspective, the increased consumption of vegetables is very much to be welcomed and should have resulted in a further improvement in the supply of several vitamins and minerals, as well as phytochemicals and dietary fibres. As the trend analysis is showing a decrease in fruit consumption in the meantime, however, further efforts are required in this area in the fu- ture in order to counteract this trend, thereby enabling the use of the preventive potential of increased vegetable and fruit consumption.
1.2 Food and Nutrient Intake – Results of the National Nutrition Survey II
1.2.1 Methodology
Within the National Nutrition Survey II (NVS II), a total of 19,329 men and women aged between 14 and 80 years were interviewed throughout Germany between November 2005 and January 2007. With the help of a personal, computer-supported initial interview (CAPI), data were collected on socio-demographic characteristics, eating habits and state of health. In addition to this, the participants completed a supplementary questionnaire on their shopping behaviour their health aspects and their leisure time, work and sleeping habits. Anthropometric measurements (body weight, body height, waist and hip circumference) were taken among the participants.
The data was evaluated with the help of the programme SAS, Version 9.1 (SAS Institute Inc., Cary, North Carolina, USA). To calculate food and nutrient intake, the respective arithmetical mean value from the first and second 24-hour recall was formed initially. Food intake is expressed as an arithmetical mean value (MV) for the various population groups and nutrient intake as the median (p50), each with the 95 % confidence interval (CI). The comparisons of food and nutrient intake, differentiated by gender, age and social class, are made on the basis of the confidence intervals of the mean value and median. Significant differences exist between the groups if the confidence intervals do not intersect or touch. To estimate the usual nutrient intake of the participants and avoid intra-individual variance, the Multiple Source Method (MSM) was applied under consideration of the covariates gender, age, social class and body mass index (BMI). To describe the social status of the participants, the household net income, the level of education of the participant and the professional status of the main earner of the household were used to form a stratification index. On the basis of this index, the participants were classified into the groups “lower social class”, “middle social class” and “upper social class”. Possible socio-demographic distortions were minimised by weighting on the basis of the micro-census conducted in 2006 for the characteristics gender, age, federal state, secondary school qualifications, profession and household size. Underreporting by the participants was determined on the basis of the quotient from energy intake and resting energy expenditure. Resting energy expenditure was calculated under consideration of body height and body weight. A limit value of 0.965 was determined for the quotient from energy intake and resting energy expenditure. If the energy intake – resting energy expenditure quotient of a participant lies below this limit value, it has to be assumed that the energy intake established with the help of the 24-hour recalls does not reflect actual energy intake and that it is lower than actual energy intake.
1.2.2 Results
The percentage of males in the examined collective is 45 % (n = 6,160) and the percentage of females 55 % (n = 7,953). The average age of the males is 45 years and of females is 46 years.
vegetable products than women (69 g vs. 61 g). On average, men eat more potatoes and potato products than women (73 g vs. 57 g). With 158 g on average, men also eat more bread than women with 111 g. With people of both genders, the 19 to under 25-year-olds eat less bread than the 35 to 80-year-olds. Overall, men eat on average more bakery products than women (60 g vs. 53 g). With 70 g, the quantity of grain and grain products eaten by men is higher on average than it is with women with 58 g. Men aged under 25 years and women under 35 years eat twice as much grain and grain products as people aged over 65. On average, men eat twice as much sugar as women (6 g vs. 3 g), although the intake of sugar via sweet bakery products, drinks etc., which is more important in terms of quantity, is not included. With 52 g, the average quantity of other sweets eaten by men is higher than it is with women with 47 g. There are no differences between the age groups where the quantity of eaten sweets is concerned. Women of the upper social class eat more sweets than women of the lower social class (49 g vs. 44 g). Overall, men drink more non-alcoholic drinks than women. With both genders, the quantity of alcoholic beverages drunk by the middle age groups (25 to under 65 years) is highest. Under consideration of social class, it can be seen that men of the upper social class drink the most coffee and tea (black/green 581 g).
Women of the upper social class drink more coffee and tea (black/green) than women of the middle social class (520 g vs. 491 g). Water (mineral water and tap water) is the most com-monly drunk non-alcoholic beverage, with women drinking more water than men (1,017 g vs. 899 g). Among women, teenagers drink the least amount (842 g). With an average of 225 g, men drink more fruit juices and fruit nectars than women with 197 g. On average, men drink roughly twice as much lemonade as women (198 g vs. 90 g). The quantities of lemonades drunk by both genders decrease across all age groups from the 19 to under 25 age group. Men drink more than 6 times as much beer as women do (299 g vs. 47 g). With both genders, the average quantity drunk by teenagers up to the 19 to under 25 age group rises and remains constant thereafter. With 48 g and 43 g respectively, wines and sparkling wines are drunk in roughly equal quantities by both men and women. The quantities of spirits and other alcoholic drinks are low and show no differences between men and women. The high intake of these drinks among men aged between 19 and 25 years (16 g) is conspicuous.
Table 1a. Median intake of energy, energy-supplying nutrients, cholesterol, dietary fibres and purines1according to gender
and age (NVS II) – men
Table 1b. Median intake of energy, energy-supplying nutrients, cholesterol, dietary fibres and purines1according to gender
and age (NVS II) – women
1
Estimation based on two 24-hour recalls using the Multiple Source Method (MSM)
2
Intake of vitamins and minerals: Median vitamin and mineral intake is higher in men than in women (exception: vitamin C). Vitamin D intake is particularly low in the 15 to under 19 year age group with 1.8 µg/day for men and 1.3 µg/day for women. The lowest vitamin E intake is to be found with both genders among young people aged 15 to under 19 years and senior citizens aged 65 to 80 years. Vitamin K intake is lowest with young people aged 19 to under 25 and rises through the succeeding age groups.
With water-soluble vitamins, there are no differences between the age groups of both gen-ders where vitamin B1 intake is concerned. Median vitamin B2 intake is lowest among males aged 15 to under 25 (1.3 mg/day), males aged over 65 (1.4 mg/day) and females aged 15 to under 19 (1.0 mg/day). Among males, the 15 to under 25-year-olds have a lower folate intake compared to the other age groups. Among females, folate intake increases up to the 51 to under 65-year-olds to 193 µg/day. Pantothenic acid intake is highest in males in the middle age groups (25 to under 65 years). Among females, there is an increase in intake up to the 25 to under 35-year-olds, whereafter it remains constant. With males, there is no difference among the age groups where biotin intake is concerned. With females, an increase in biotin intake is recorded up to the 25 to under 35 age group, whereafter it remains constant. Vitamin B12 intake is higher among men aged 25 to 80 years than in teenagers and 19 to under 25-year-olds, whereas an increase in intake can be observed in all female age groups. There are no differences in vitamin C intake among the male age groups. Among females, a higher vitamin C intake of 103 mg/day was observed for the 51 to under 65-year-olds compared to the younger age groups.
Median intake of the examined minerals is often higher in the medium age groups (25 to under 65 years) with both men and women than it is in the younger and older age groups. With 2,602 mg/day, sodium intake is lower in men aged 65 to 80 than in the other age groups. Among women, sodium intake increases up to the 25 to under 51 age group, then decreases again. In both genders, potassium intake increases in the medium age groups (25 to under 65 years) before dropping again among male senior citizens. With 725 mg/day and 683 mg/day respectively, calcium intake is lowest among male and female seniors as well as young females with 684 mg/day. In both genders, young people have the lowest and the 35 to under 65-year-olds the highest magnesium intake. The lowest iron intake is to be found among the 15 to under 25-year-olds. When calculating median iodine intake, the iodine ingested in the form of iodine salt and foods made with it was not taken into account. Iodine intake is lowest among men aged 15 to under 25, male senior citizens and young females. In both genders, the 25 to under 65-year-olds have a higher zinc intake than young people and senior citizens. The intake of most vitamins and minerals is higher among both men and women in the upper social class than in the middle and lower social class.
1.2.3 Evaluation
vegetable intake is only a third of the benchmark. With roughly 2 l/day, the benchmark of at least 1.5 l/day for the intake of liquids, which relates to low-energy and energy-free drinks, is reached by both men and women. This figure includes the intake of lemonade, fruit juices and fruit nectars, however.
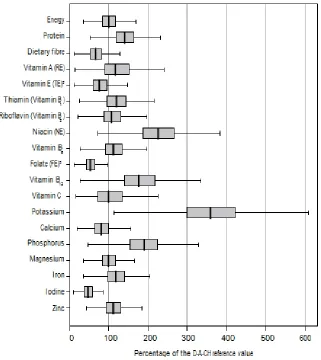
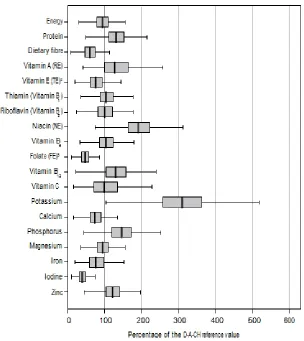
Energy and nutrient intake in comparison with the D-A-CH reference values (Figs. 3a and 3b): Under consideration of a low physical activity (PAL 1.4), the median energy intake of 51 to 80-year-old males is in the range of the guiding value, whereas this value is not achieved by the younger age groups, and a similar pattern can be seen with women. The percentage of energy-supplying nutrients in energy intake does not comply with the reference values in either age group in both genders, with the percentage of fat lying generally above the guiding value of 30 %. Accordingly, the percentage of carbohydrates is usually too low (approx. 45 %). The fatty acid composition, i.e. the ratio of saturated to mono- and polyunsaturated fatty acids does not comply with the guiding values in males or females. In both genders, the percentage of saturated fatty acids exceeds the guiding value of 10 % of energy intake, while the percentage of polyunsaturated fatty acids lies below the guiding value of 7 %. With 19 g/day and 18 g/day respectively, the median intake of dietary fibres lies considerably below the guiding value of at least 30 g/day. Overall, roughly 31 % of men and 25 % of women have an alcohol intake which lies above the level regarded as acceptable for the maintenance of health which amounts to 20 g/day in healthy males and 10 g/day in healthy females.
Fig. 3a. Energy and nutrient intake (NVS II) in comparison with the D-A-CH reference values; men, 15 to 80 years1(median, interquartil region and
minimum-maximum shown, outliers and extreme values not shown) 1Estimation based on two 24-hour recalls using the multiple source method (MSM) 2Currently tocopherol equivalents are predominantly calculated on the basis of α-tocopherol
without considering further vitamin E-compounds.
3FE: The factor 1,7 was used to calculate folate equivalents for fortified foods.
Fig. 3b. Energy and nutrient intake (NVS II) in comparison with the D-A-CH reference values; women, 15 to 80 years1(median, interquartil region and minimum-maximum
shown, outliers and extreme values not shown)
1Estimation based on two 24-hour recalls using the multiple source method (MSM) 2Currently tocopherol equivalents are predominantly calculated on the basis of α-tocopherol
without considering further vitamin E-compounds.
3FE: The factor 1,7 was used to calculate folate equivalents for fortified foods.
RE: retinol equivalents; TE: tocopherol equivalents; NE: niacin equivalents; FE: folate equivalents
1.3 Nutrient Intake via Supplements–Results of the National Nutrition Survey II
1.3.1 Methodology
Three dietary assessment methods (diet history interviews, 24-hour recalls, weighed dietary records) were used to record food intake. The 24-hour recalls within the NVS II were conducted on two non-consecutive days with a time interval of one to six weeks (average 16 days). The programme EPIC-SOFT, which was developed within the scope of the study “European Prospective Investigation into Cancer and Nutrition” (EPIC) by the International Agency for Research on Cancer (IARC) in Lyon was adapted and then used for the NVS II. For a total of 13,926 survey participants aged between 14 and 80 years, two 24-hour recalls are available.
In the course of the two 24-hour recalls in the NVS II, it was recorded whether the participants had taken any supplements on the day of the survey and if yes, which ones. During the survey, no difference was made between food supplements and medicines containing nutrients, some of which are only available in pharmacies or on prescription. Accordingly, supplements are understood below to be all nutritional supplements and medical products containing nutrients (e.g. analgesics with vitamin C).
Persons who stated that they had used a supplement in at least one of the two 24-hour recalls are described as supplement takers. As relatively high quantities of vitamins are also ingested via multivitamin drinks, the group of multivitamin drink consumers is shown separately. This group comprises persons who drink multivitamin juices, multivitamin fruit nectars and/or multivitamin juices mixed with mineral water.
The intake of nutrients via supplements was calculated with the help of a database maintained at the Federal Research Institute of Nutrition and Food (MRI). It comprises around 2,700 supplements, most of whose nutrient data is from the years 2006 and 2007. The intake of nutrients through foods is calculated with BLS 3.02. The intake quantities from the intake of food – including the recorded enrichment with vitamins and/or minerals – and from supplements are added together to calculate total nutrient intake. Nutrient intake is assessed on the basis of the D-A-CH reference values.
Whether or not the frequency distributions regarding the use of supplements and/or the intake of multivitamin drinks differ between men and women and between the different age groups and social classes was checked using the chi-square test. Comparisons regarding the nutrient intake of supplement takers and non-supplement takers are made on the basis of the confidence intervals of the median (CI-Median). Differences between the groups are regarded as significant if the confidence intervals do not intersect. The data basis is the collective of the NVS II participants aged 15 to 80 years (total: 13,753; men: 6,160; women: 7,593). Data was weighted on the basis of the microcensus conducted in 2006 for the characteristics gender, age, federal state, secondary school qualifications, profession and household size.
1.3.2 Results
than it is in the lower and middle social classes. The main supplement consists of a combination of vitamins and minerals. A further 0.7 % (38 men, 56 women) use “other supplements” which include coenzyme Q10, as well as fish oil and omega-3 fatty acid capsules. Where vitamin D and folate are concerned, the highest percentage of supplement takers is to be found among 65 to 80-year-old men (vitamin D 5 %; folic acid 9 %) and women (vitamin D and folic acid 12 % respectively). Only around 8 % of women aged 19 to under 45 years take supplements containing folic acid. With 3 %, the percentage of young females (15 to under 19) who supplement folic acid is considerably lower.
1.3.3 Evaluation
Total nutrient intake compared to the D-A-CH reference values: Overall in the median, supplement takers reach or exceed the corresponding D-A-CH reference value for almost all nutrients ingested via foods and supplements. In relation to each D-A-CH value, nutrient intake from foods and supplements amounts in the median to between 103 % (men) and 105 % (women) for calcium and 377 % (men) and 337 % (women) for potassium, with potassium being ingested mainly through food. With vitamins B1, B2 and B6, as well as vitamin C, overall intake via supplements and foods is roughly double the D-A-CH reference value in the median, and three times the value with niacin. For folate, the intake via food lies below the D-A-CH reference value. A total nutrient intake that lies above the D-A-CH reference value results for both men and women when the quantities of folic acid ingested via supplements are taken into account. Where the intake of calcium via food in men and women, and iron in women, is concerned – both of which are below the recommended level – total nutrient intake is increased by means of supplements so that the D-A-CH reference values are reached (calcium) and exceeded (iron) by both men and women. With vitamin E, the reference values are exceeded in the median by 60 % in men and 72 % in women when intake via food and supplements is taken into account. It should be taken into consideration here that the values calculated for vitamin E intake via food constitute a distinct underestimation of actual vitamin E intake.
1.4 Nutritional Situation of Various Population Groups–Results of the National
Nutrition Survey II
1.4.1 Methodology
Within the National Nutrition Survey II (NVS II), a total of 19,329 men and women aged between 14 and 80 years were interviewed throughout Germany between November 2005 and January 2007. With the help of a personal, computer-supported initial interview (CAPI), data was collected on socio-demographic characteristics, eating habits and state of health. In addition to this, the participants completed a supplementary questionnaire on their shopping behaviour, their health aspects and their leisure time, work and sleeping habits. Anthropometric measurements (body weight, body height, waist and hip circumference) were taken among the participants.
initial interview and questionnaire. Categorisation on the basis of nutrition knowledge was done on the basis of the answers to four questions in the questionnaire which were summarised into an index via a points system: 1) Estimation of foods that are important for a “healthy diet”, 2) Correct attribution of what probiotic yoghurt is, 3) Correct attribution of what ACE drinks are, and 4) Proper knowledge of the meaning of the “5 a day” campaign. It was not established whether the participants had a migration background, but the country of birth was determined so that people who were not born in Germany could be grouped together.
In general, only German-speaking persons were questioned in the survey. Nutrient intake through supplements was not taken into account among the identified population groups. This also applies to the supplement-takers.
The information provided by the NVS II participants aged 19 to 64 years was used for the various population groups (basis: 10,215 persons; 4,489 men; 5,726 women). As a completed questionnaire was only available from 6,817 persons, the size of the groups is smaller with the population groups formed on the basis of information contained in the questionnaire (e.g. physically active, knowledge of nutrition). Energy and nutrient intake was calculated on the basis of the German Nutrient Food Code and Data Base (BLS) 3.02. When determining nutrient intake, foods enriched with vitamins and minerals were also taken into account as far as they were included in BLS 3.02. It was possible to record the possible enrichment of various foods with vitamins and minerals (e.g. juices, breakfast cereals) with the help of the EPIC-SOFT programme.
1.4.2 Results
On average, physically active men and women eat less meat and fewer meat products and cold cuts but more milk, dairy products, cheese and quark, fruit and fruit products and non-alcoholic drinks than non-physically active persons. Compared to non-smokers, smokers eat more meat, meat products and cold cuts and less fruit and fruit products, vegetables and vegetable products and bread. In addition to this, female smokers drink more non-alcoholic drinks than female non-smokers. Men and women who take supplements eat on average less meat, meat products and cold cuts and more fruit and fruit products and more non-alcoholic drinks than people who do not use any supplements. Women who take supplements also eat more milk, dairy products, cheese and quark (213 g/day) and vegetables and vegetable products (138 g/day) than women who do not take any supplements (189 g/day and 128 g/day respectively). On the one hand, men and women with good knowledge of nutrition eat on average fewer meat, meat products and cold cuts (146 g/day and 83 g/day) than persons with poor knowledge of nutrition (166 g/day and 94 g/day). On the other hand, they eat more milk, dairy products, cheese and quark, fruit and fruit products, vegetables and vegetable products and non-alcoholic drinks. With 137 g/day, men who stated that they have very good or good cooking skills eat on average more vegetables and vegetable products and drink more non-alcoholic beverages (2,179 g/day) than men with poor or no cooking skills (120 g/day and 2,045 g/day respectively). Women with very good or good cooking skills drink more non-alcoholic drinks than women who claim to have poor cooking skills or none at all (2,207 g/day vs. 2,017 g/day).
respectively) than people who were born in Germany (199 g/day each). On the other hand, however, women who were not born in Germany eat on average more fish, fish products, crustaceans and shellfish but less bread and fewer non-alcoholic drinks than women who were born in Germany. Men and women who live on their own eat on average less meat and fewer meat products and cold cuts (152 g/day and 74 g/day respectively) than persons who live in households with three or more persons (166 g/day and 91 g/day).
1.4.3 Evaluation
Food intake compared to the food-related benchmarks of the DGE: When comparing the food intake of the various population groups with the DGE benchmarks, it can be seen that, on average, men of all of examined population groups eat more than 300 g and up to 600 g of meat, meat products and cold cuts per week. Among women, the intake quantities of most population groups are in the upper range of the benchmark for meat, meat products and cold cuts. With 99 g/day, the benchmark is clearly exceeded by physically inactive women. Intake of fish was close to the lower limit of the benchmark (150 g per week) among men in all population groups and below this limit among women in all groups. The quantities of milk, dairy products, cheese and quark eaten in all of the represented population groups lay below the benchmark of 250 g to 310 g/day. The benchmark of at least 400 g of vegetables and a minimum of 250 g of fruit is not reached on average by any population group, nor is the benchmark for bread of 200 g to 300 g.
Energy and nutrient intake compared to the D-A-CH reference values: In most of the population groups examined, energy intake lies within the range of the guiding value with men and slightly below it with women (PAL 1.4). The percentage of fat of energy intake is always above the guiding value of 30 % in the population groups examined here. The guiding value for the percentage of carbohydrates of energy intake of > 50 % is not reached by far by men and women in the examined population groups. Intake of folate lies clearly below the recommended level in all population groups examined. The highest folate intake is to be found in men and women with good knowledge of nutrition (234 µg/day and 199 µg/day) and physically active women (199 µg/day). The lowest folate intake is recorded for unemployed males (194 µg/day) and female smokers (170 µg/day). The reference value for calcium is not reached in any of the population groups examined. Calcium intake lies clearly below the recommended level in men and women who are unemployed (746 mg/day and 678 mg/day respectively) or not born in Germany (758 mg/day and 695 mg/day) and with women with poor knowledge of nutrition (696 mg/day).
1.5 Iodine Supply of Schoolchildren in Germany – Results of the DONALD
Study
1.5.1 Methodology
records which were kept parallel to the study. The total table salt intake of the children was established on the basis of the sodium excretion in their urine. Possible continuous changes in iodine excretion between 1996 and 2009 were analysed statistically by means of longitudinal regression models.
1.5.2 Results
The measured absolute daily iodine excretions (median) permit the assumption that boys have a better iodine supply (89.2 µg/day) than girls (81.4 µg/day). If 24-hour iodine excretion is set in relation to individual energy intake, however, there are no differences between the genders.
After evaluation of the 3-day weighed dietary records, the conclusion is permitted that table salt (the quantities used at home for seasoning as well as the table salt added during food processing) and milk combined account for more than three quarters of the daily iodine intake of 6 to 12-year-old children. Due to the very low quantities eaten, sea fish, which has a relatively high iodine content, made only a marginal contribution to iodine supply.
A study of the trend analysis (Fig. 4) showed a clear increase in iodine excretion up to 2003 (in relation here to individual energy intake as age and hydration status-independent parameter), which reflects the success of the widely applied iodine deficiency prevention measures and simultaneous increase of iodine concentrations in milk since the 1990s. There was no evidence of this increase from 2004 on and there even appears to be a renewed decline in iodine excretion among the children. The results underscore the necessity for regular iodine monitoring in order to document further declines or possible advances in iodine supply and mark out approaches for specific deficiency prevention measures, thereby ultimately ensuring a sufficient and sustained iodine supply.
Fig. 4. Median 24-hour iodine excretion (–) of 6 to 12-year-old participants of the DONALD study in comparison with the desirable excretion amounts calculated on the
1.5.3 Evaluation
Under consideration of non-renal iodine losses of approx. 15 %, an appropriately desirable iodine excretion value of 119 µg/day can be derived from the D-A-CH reference values for iodine intake of 140 µg/day for 7 to under 10-year-olds. The comparative evaluation shows that well over 50 % of this group does not achieve the desirable iodine excretion and therefore also does not achieve the recommended iodine intake (median iodine excretion lies clearly below the target values). It must be taken into account here, however, that the reference values (D-A-CH as well as WHO) contain allowances in order to guarantee an iodine intake that meets requirements in almost all of the population groups. The fact that the majority of the study participants do not reach this recommended intake therefore should not be regarded as an iodine deficiency, but it nevertheless indicates an unsatisfactory situation.
1.6 Prevalence and Development of Overweight in Germany
1.6.1 Methodology
To evaluate the prevalence and development of overweight in Germany, the large national samples of the microcensuses of 1999, 2003, 2005 and 2009 were used along with data from the “German Health Interview and Examination Survey for Adults” (DEGS).
The microcensus is conducted by the Federal Statistical Office in a random sample of 1 % of German households with the inclusion of all household members. On top of the annually conducted basic programme, additional surveys are conducted on health-related issues and other matters. Within representative sub-samples, randomly selected adult household members were questioned about their body weight and height. The body mass index (BMI) and distribution of overweight (pre-obesity and obesity) were then calculated from the information provided by these voluntary participants.
Within the health monitoring, the Robert Koch Institute (RKI) conducts national health surveys on a regular basis. The first wave of the nationwide “German Health Interview and Examination Survey for Adults” (DEGS) was conducted in the years 2008 to 2011. In the course of this study, a random sample of the residential population of Germany aged 18 and over was questioned in detail about health-relevant topics and subjected to a medical examination. In this way, standardised measured values on body height and weight are available for a total of 7,116 adults aged 18 to 79 years. These values were also measured in the National Health Study 1998 (BGS98) in a standardised form, thus allowing a direct comparison of the two studies.
1.6.2 Results
and 62.5 % (women) in the 70 to 75 age group. In the period from 1999 to 2009, the prevalence of obesity – but not of pre-obesity – increased sharply, in particular the spread of class II (BMI 35 to 39.9) and class III (BMI ≥ 40) obesity.
Table 2. Body measurements as well as prevalence of underweight and overweight on the basis of the microcensus 2009 (average values)
Men (aged 18 and above) Women (aged 18 and above)
Body weight (kg) 83,4 68,1
Body length (cm) 178,0 165,0
BMI 26,3 25,0
Underweight 0,7 % 3,4 %
Normal weight 39,2 % 53,7 %
Pre-obese 44,4 % 29,1 %
Obese class I 12,5 % 10,1 %
Obese class II 2,4 % 2,7 %
Obese class III 0,8 % 1,0 %
Similar to the microcensus data, the age-specific prevalences in DEGS1 (Figs. 5a and 5b) showed a sharp increase in the frequency of overweight (BMI ≥ 25) men across the younger age groups (18 to 39 years), from 19.4 % in the 18 to 19-year-olds to 66.9 % in the 35 to 39-year-olds. Although the prevalence of overweight continues to rise in the 40 to 74 age groups, the increase is considerably lower. With 79.9 %, the 75 to 79 age group even has a slightly lower overweight prevalence than the preceding age group (70 to 74 years).
Fig. 5b. Prevalence of pre-obesity (BMI 25-29,9) and obesity (BMI ≥ 30) of German adults (DEGS1), women 18 to 79 years
1.6.3 Evaluation
Overweight in Germany is very widespread among the adult population, with the prevalence increasing sharply with advancing age. Men of normal weight from the 30 to under 35 age group upward and women from the 55 to under 60 age group upward are in the minority. Interestingly, there are differences in the development of prevalences for pre-obesity and pre-obesity in the individual age groups.
In Germany today, only a minority of adults are capable of keeping their body weight in the normal range (BMI 18.5 to 24.9) up to an advanced age. With persons who already are pre-obese, a clear trend towards the development of obesity with advancing age can be observed. Where class I obesity already exists, a tendency towards the development of class II or class III obesity with advancing age can be seen.
1.7 Nutritional Precautions for Emergency Situations
1.7.1 Methodology
1.7.2 Results
Due to the changed geopolitical outline conditions, the likelihood of a supply crisis in Europe/Germany due to acts of war has decreased significantly. This is balanced off by an increase in the significance of occurrences which could result in a peacetime supply crisis (e.g. natural disasters, large-scale technical accidents, pandemics, epizootic diseases). The “critical” infrastructures which could possibly be affected by this include the supply of power, drinking water and food, telecommunications, the transport, traffic and finance system and the health system, i.e. medical care.
The state measures in supply shortages include regulations on the cultivation of crops and farming of animals, the treatment, processing and delivery of goods, the procurement and allocation of products, the determination of prices for products and the imposition of compulsory registration for companies involved in the food industry and agriculture. Material investment measures (storage) include the maintenance of a federal emergency reserve (so-called Federal Grain Reserve) and a so-called civil emergency reserve (ZNR; ready-to-use foods). In the event of a crisis, these reserves are to be issued directly to consumers via community catering facilities by aid organisations such as the Federal Agency for Technical Relief (THW), German Red Cross (DRK) or German armed forces. When selecting the products, their shelf life is of paramount importance in addition to the nutritional physiological aspects, i.e. a ratio of carbohydrates, protein and fat that is as well-balanced as possible. Cereal grains (wheat, oats and rye), rice, peas and lentils are usually stored for ten years in the warehouses of private storage space providers rented by the federal government. The quality of the goods is controlled continuously during storage. The Federal Office for Agriculture and Food (BLE) is responsible for the purchase, rollover (exchange of foods) and control of the national emergency reserves. The computer-supported information system “IS ENV” which has been set up in recent years is intended to enable quick communication between the various decision makers on different levels in times of crisis.
The emergency supply of food, which is only intended to last for a short time, must be supplemented by private food supplies. For this reason, in collaboration with the BLE and the ministries of the federal states responsible for emergency food supply, the Federal Ministry of Food, Agriculture and Consumer Protection has developed an information platform dealing with the topic of food supply (part of “IS ENV”) which can be freely accessed by all citizens (www.ernaehrungsvorsorge.de). The purpose is to make it easier for the general public to access information on food supply and how they can set up their own supply, and to provide information on the tasks, responsibilities and government activities in this area. The internet portal is part of “IS ENV” and the goal is to achieve increased preparedness among the general public to stock up with food, thereby enhancing their ability to help themselves.
1.7.3 Evaluation
2 NUTRITIONAL SITUATION OF SENIORS WITH NEED OF CARE IN PRIVATE
HOMES IN GERMANY (ERNSIPP STUDY)
2.1 Methodology
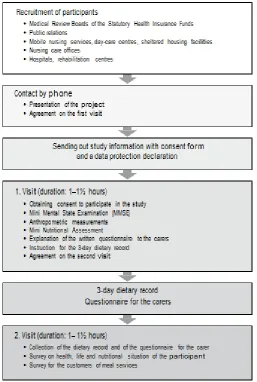
The target population for this multi-centre (Bonn, Nuremberg, Paderborn) epidemiological nutrition study was made up of seniors in need of care living in private homes and being looked after by relatives and/or outpatient care services. The inclusion criteria were: minimum age 65, resident in private household, assigned care level in line with Volume XI of the German Social Insurance Code, no pre-terminal condition. Participants were recruited on two levels: a) through cooperation with the Medical Review Boards of the Statutory Health Insurance Funds (MDK) in the North Rhine, Bavaria and Westphalia-Lippe regions. In each study centre, selected MDK experts were informed about the study project and trained in recruitment procedures. During their visits to assess care requirements, the MDK employees gave seniors who met the study inclusion criteria an information flyer on the study and, where the seniors expressed an interest in taking part, obtained their consent to pass on their address. The addresses were forwarded to the various study centres and initial contact was made by phone; b) PR activities comprising newspaper articles, calls to participate in the study on regional radio stations and the distribution of information flyers; further seniors in need of care were contacted via day care centres, care services, sheltered housing facilities, care advisory agencies, hospitals and rehabilitation centres. During the initial phase, potential participants were informed about the study project by phone; the survey procedure was explained and the individual efforts and benefits associated with individual nutritional counselling outlined. If seniors expressed an interest, a date was set for a first visit. The participants and their carers were also send an information letter together with a consent form and a data protection declaration (Fig. 6).
The data were collected during two visits to the homes of the seniors each lasting between one and one and a half hours. The carers were present during the visits where possible. The interviews documented the cognitive skills (Mini Mental State Examination, MMSE), the risk of malnutrition (Mini Nutritional Assessment, MNA®), nutritional condition
Fig. 6. Methods and procedure of assessments
The data from the various study centres were merged and checked for plausibility.
2.2 Results
A total of 353 persons in need of care took part in the study; 148 in Bonn, 103 in Nuremberg and 102 in Paderborn. The study collective comprised 128 men (36.3%) with an average age of 79.1 ± 7.8 years (minimum 65, maximum 96) and 225 women (63.7%) with an average age of 82.0 ± 7.5 years (minimum 65, maximum 99). On average, the male participants are younger than their female counterparts (p < 0.001). 58.9% of participants receive benefits in line with care level I, 29.7% care level II and 11.3 % care level III under the long-term care insurance scheme based on sections 14 and 15 of Volume XI of the German Social Insurance Code. The seniors suffered from five chronic diseases in the median and, with the exception of one female participant, all had at least one chronic disease. The dominant diseases were cardiovascular diseases (hypertension, cardiac insufficiency, arrhythmia, coronary heart disease) with a prevalence of 86.1 % in the study collective, followed by joint diseases (arthritis, arthrosis) with 54.4% and metabolic disorders (diabetes mellitus, lipidemia, hyperuricemia) with 46.7%. While 42.8% of participants were able to walk at least 50 metres with or without walking aid and 24.4% could walk the same distance with the help of another person, 28.3% were not able to walk this far. Using the Barthel Index, 60.6% of participants were classified as in need of minor care, 19.0% as in need of moderate care and 20.4% as in need of high-level care.
Anthropometric and nutritional status: The average body weight of male seniors was 81.3 ± 16.9 kg compared to 68.9 ± 17.5 kg for female seniors (Table 3). Both average height and average body weight are significantly lower among the women (p < 0.001). Both genders exhibit significant decline in average height and average body weight with increasing age. 13.7% of men and 13.8% of women had a BMI < 22 (risk of malnutrition). 4.8% of the male and 3.7% of the female study participants had a BMI < 20, and 3.2 % and 1.8% a BMI below 18.5. The BMI is over 30 in one in three examined participants, with 12% of the men and women recording a BMI ≥ 35. It was possible to measure the calf circumference of 343 of the 353 participants. There were no gender-specific differences in average calf circumference. Both gender showed a significant decline in average calf circumference with increasing age. Average triceps skinfold thickness was 17.0 ± 7.1 mm in the women; the figure for the men was significantly lower (13.8 ± 5.4 mm) (Table 4). When asked about weight loss during the last three months, 14.1 % of the men and 15.1 % of the women said they had lost between 1 kg and 3 kg, while 15.6% and 10.7% said they had lost more than 3 kg.
Table 3. Body length and body weight of male (m) and female (w) study participants [Mean ± standard deviation (mean ± SD), minimum (Min.), 5. percentile (P5), 50.
Percentile (P50), maximum (Max.) number of participants (n)]
Age Mean ± SD Min. P5 P50 P95 Max. n
Body length (cm)*** m ### w### all 65–74 yr. 75–84 yr. ≥ 85 yr. all 65–74 yr. 75–84 yr. ≥ 85 yr.
169,9 172,3 170,1 166,7 155,9 160,6 156,3 153,7
± 6,0 ± 6,5 ± 4,9 ± 5,7 ± 6,9 ± 7,3 ± 6,0 ± 6,5
155,0 158,0 160,5 155,0 137,0 140,0 142,0 137,0 160,2 163,0 161,0 155,0 143,3 145,0 147,0 141,9 169,7 171,5 169,4 166,6 156,0 160,8 157,0 154,0 180,4 184,0 179,3 176,0 167,4 172,5 166,1 165,0 188,0 188,0 182,2 178,0 177,0 177,0 170,1 172,0 127 39 55 33 224 39 90 95 Body weight (kg)*** m # w### all 65–74 yr. 75–84 yr. ≥ 85 yr. all 65–74 yr. 75–84 yr. ≥ 85 yr.
81,3 87,4 80,5 75,7 68,9 77,4 71,7 62,6 ± 16,9 ± 18,7 ± 16,0 ± 14,0 ± 17,5 ± 25,0 ± 15,9 ± 12,6 47,3 54,8 47,3 55,0 38,0 38,0 41,5 39,0 54,9 55,8 48,7 55,7 47,2 48,8 47,8 43,6 80,3 85,1 82,0 72,4 65,9 72,0 70,3 62,0 109,9 120,1 109,6 104,8 100,0 143,0 104,8 84,4 160,0 160,0 115,0 110,0 170,0 170,0 110,7 110,0 124 38 53 33 218 37 90 91
Comparison men/women: Independent samples T-test; ***p < 0.001
Comparison of age groups within one gender: Analysis of variance;#p < 0.05;###p < 0.001
Table 4. Triceps skin fold (TSF) of male (m) and female (w) study participants [Mean ± standard deviation (mean ± SD), minimum (Min.), 5. percentile (P5), 50. percentile (P50), maximum (Max.), number of
participants (n)]
Age Mean ± SD Min. P5 P50 P95 Max. %TSF
< Ref.+ n
TSF (mm)*** m n.s. all 65–74 yr. 75–84 yr. ≥ 85 yr.
13,8 15,1 13,7 12,6 ± ± ± ± 5,4 7,3 4,5 4,2 5,5 5,7 5,5 7,3 7,0 6,1 6,9 7,3 13,0 13,9 13,4 11,3 23,5 32,6 22,3 21,8 40,0 40,0 25,7 24,5 12,4 18,2 12,2 6,5 113 33 49 31 w ## all
65–74 yr. 75–84 yr. ≥ 85 yr.
17,0 17,2 18,7 15,3 ± ± ± ± 7,1 7,5 6,9 6,8 4,1 4,6 5,0 4,1 6,1 5,1 9,4 5,1 16,0 16,0 18,2 14,3 30,4 31,8 30,9 30,1 40,0 33,0 40,0 35,8 36,6 37,1 28,0 44,7 202 35 82 85
+Ref.: reference value TSF men < 8.5 mm, women < 13.7 mm Comparison men/women: Independent samples T-test; ***p < 0.001
Comparison of age groups within one gender: Analysis of variance;##p < 0.01; n.s.: not significant
Over half (53.8%) of those in need of care said that their feeling of thirst had decreased, and over one in three noticed a modest (29.7%) or poor (7.1%) appetite. More than 18% of respondents said or were said by the carer to drink less than 0.5 l a day either frequently or occasionally. One in two (51.8%) respondents reported difficulties with chewing and almost one in three (28.3%) found it difficult to swallow.
and dairy products averaged 273 g (m) and 252 g (w) a day. Daily intake of edible fats and oils was 31 g (m) and 28 g (w). Intake of potatoes and cereal products was low overall and well below the benchmark quantities of 200 g to 250 g of potatoes or pasta or 150 g to 180 g of rice a day. Daily intake of vegetables and vegetable products was also too low at 179 g (m) and 163 g (w). With 170 g (m, w), intake of fruit (fresh fruit, exotic fruit, fruit products) was also below the DGE benchmark of at least 250 g a day. Average daily intake of non-alcoholic beverages was 1,504 g (m) and 1,489 g (w), with the lowest scores being recorded for women in the highest age group. Overall, this figure is in line with the benchmark of 1.5 l a day.
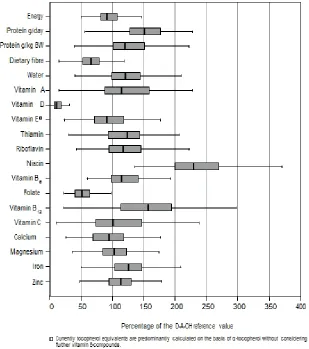
Intake of energy, water and energy-supplying nutrients: Median daily energy intake was 2,016 kcal (8.4 MJ) for men and 1,708 kcal (7.1 MJ) for women; 63.0% of men and 58.4% of women did not achieve the individually calculated guiding value for daily energy intake. On average, energy intake was made up of around 38 energy percent of fat, 43 energy per-cent of carbohydrates and 16 energy perper-cent of protein. Mean daily water intake (beverages, water in solid food) was roughly 2,397 ml for men and 2,231 ml for women, which means that both genders drank more than the guiding value of 1,990 ml for daily water intake.
In the case of the majority of investigated vitamins and minerals, the median intake values were in line with the D-A-CH reference values for nutrient intake. Only in the case of vitamin D, vitamin E, folate and calcium were the median intake values of seniors of both genders below the reference values, although it is to be assumed that vitamin E intake is higher than estimated (Figs. 7a and 7b).
The higher the care level, the lower the energy intake was among women (p < 0.05), resulting in a significantly lower intake of many of the nutrients. Comparison of type of care showed no significant differences between people cared for by family members and those receiving care from professional carers. Analysis of the energy and nutrient intake of people with and without dementia showed significantly lower intake values for water, folate, sodium, calcium and magnesium among female seniors with dementia compared to female seniors not suffering from dementia.
2.3 Evaluation
In this study, both BMIs ≥ 30 and the risk of malnutrition were widespread among the participants. In the case of a high BMI, the primary objective must to be avoid a further increase in weight. Weight reduction is to be seen as critical in old age and should only be undertaken if medically indicated and accompanied by intensive physical activity, as a reduction in weight is always associated with a reduction in muscle mass and therefore with functional impairments. On the other hand, particular care must be taken in cases of malnutrition or malnutrition/dehydration risk to ensure ample quantities of food and drink as well as adequate intake of essential nutrients. Although the intake of most nutrients was adequate on average for the collective in this study, serious deficits in nutrient supply were also identified in some cases.
favourable impact on the nutrient ratio. In addition, nutrient losses due to incorrect storage or keeping food hot for long periods should be avoided. Particular importance should be attached to the supply of vitamin D. As this vitamin is not contained in many foods and the body produces less of this vitamin as people get older, the diet must additionally be supplemented with vitamin D in order to achieve the reference value if the people in question do not have sufficient exposure to sunlight.
Fig. 7a. Energy intake in comparison to the individually calculated reference values; nutrient intake in comparison to the D-A-CH reference values – men (all age groups;
Fig. 7b. Energy intake in comparison to the individually calculated reference values; nutrient intake in comparison to the D-A-CH reference values – women (all age groups; median, interquartil region, minimum – maximum; without outliers and
extreme values)
3. SITUATION, QUALITY AND SATISFACTION WITH “MEALS ON WHEELS”
3.1 Methodology
The search ascertained 2,496 providers, all of whom were contacted for the survey.
The questionnaire was made available to the providers both in paper format and online.
In the written questionnaire, the providers were asked to supply menus covering a period of at least four weeks. Only the menus that covered this period and supplied meals seven days a week were analysed. The quality of meal planning was assessed using parameters geared towards the principles of a wholesome diet in line with the “10 dietary guidelines of the German Nutrition Society”.
In addition, food type frequency was determined in line with the “DGE Quality Standard for Meals on Wheels”. The German Nutrient Data Base, version 3.01, was used to estimate the fat content of meat products.
Customer satisfaction was measured using standardised interviews in different regions of Germany. The customers were recruited with the help of the meal services included in the survey. At least 40 persons were interviewed in each region, and the goal was to achieve representative depiction of urban and rural communities. Within the context of the research project, urban communities are taken to mean large cities, medium-sized cities and small towns.
Data input for the provider survey was performed with the help of the EvaSys statistics software, which allows automatic recording of data. The PASW statistics programme, version 18.0.0, was used for subsequent data processing. In the case of categorical variables, the chi-square test according to Pearson was used to verify differences between two groups.
If there were values < 5 in too many cells, categories were grouped or Fisher’s exact test was used. The U test according to Mann and Whitney was performed for variables with ordinal scale level. Differences between more than two groups were analysed with the help of the H test according to Kruskal-Wallis. If no answers were given for individual questions, these questions were excluded from the final statistical tests. The significance level was defined as p < 0.05.
3.2 Results
Description of study cohort: A total of 2,496 providers of “meals on wheels” were identified using the defined search criteria and contacted; 844 questionnaires (return rate 33.8 %) were returned. 74.2% of meal services are providers of the welfare sector and only 18.5% are private companies. The majority of providers (52.7%) deliver only hot meals to the customers; a small percentage (7.8%) offer only deep-frozen meals. 76.5% of providers (n = 646) generally supply a meal to their customers on seven days a week, and only 12.8% deliver meals on five days of the week. The providers mainly make use of industrially produced deep-frozen menus; in other words, 64.2% do not produce the meals themselves.
Organisation of meal services is characterised by a high level of flexibility vis-à-vis the customer.
kept hot for longer than two hours before the process of transport to the customer begins. 64.9 % of the 844 providers said that an HACCP concept is implemented in their operation. 33.1 % of providers have conducted a risk analysis according to REG (EC) 852/2004 Article 5.
There are wide variations in prices. The majority of prices (80.2%) are between 3.01 euros and 7 euros per meal.
Quality of meals (Table 5): The overwhelming majority of providers (72.8%) say they are in a position to provide information on the nutritional composition of the menus they offer; 52.1% rely on the information provided by their suppliers for this. In line with the “DGE Quality Standard for Meals on Wheels”, a menu cycle should cover at least four weeks: 88.3% of providers meet this requirement. Meal services offer different types of meals that are geared towards the needs of customers. The most frequent types are meals for diabetics (88.2%). 75 % of providers offer pureed meals for older people who have difficulty chewing or swallowing. Based on the “DGE Quality Standard for Meals on Wheels”, a one-week cycle menu should include seven portions of vegetables a one-week, including at least three portions of raw vegetables or salad.
The midday meals supplied by 34.4% of providers contain vegetables daily; 26.1% offer meals that include vegetables five to six times a week, 31% three to four times a week and a low figure of 2.5% just once to twice a week. 43.7% of providers meet the requirement regarding the frequency of salad or raw vegetables as part of the meal, while salad or raw vegetables are never offered in 28.1% of providers.
Overall, it was possible to evaluate 236 complete 4-week menu records and assess these records through comparison with the specifications of the DGE (Fig. 9). 40.3% of the analysed menus include a daily portion of vegetables as part of the midday meal. Only 0.8% of the analysed menus met the criterion of including meat/meat products a maximum of three times a week. 64.8 % (n = 153) of menus include saltwater fish once a week in line with the requirements, while 24.2% serve fatty saltwater fish once every two weeks. Most of the submitted menus list several types of meals. The most frequently listed type of meal is the regular diet (99.2%), followed by diabetic meal with 69.9%. Vegetarian meals and regular diet restricted in special foods in case of intolerances are offered with almost equal frequency (56.4 % and 54.7% respectively). Sodium-reduced meals are seldom listed (5.5%, n = 13).
Only 21 of the 236 evaluated menus permit assessment of energy-supplying nutrients for the “regular diet” category. And only seven of these assessable menus meet the requirement that a midday meal should contain an average 2,510 kJ (600 kcal). Only one menu meets the requirement that the midday meal should contain more than 75 g of carbohydrates. Three menus do not exceed the specified maximum of 30 g threshold for protein, and again only three menus meet the requirement that the midday meal should not contain more than 20 g of fat.
Table 5. Quality of catering
Providers Total (n = 844)
Absolute % Used catering system (multiple
responses) Frozen menusCook & Chill (chilled food) 42389 50,110,5
Hot holding meals 558 66,1
Missing value 1 0,1
Self-made menus Yes 287 34,0
No 542 64,2
Missing value 15 1,8
Used containers
(multiple responses) Aluminium packagingPlastic packaging 401348 47,541,2
Porcelain plates 254 30,1
Others 68 8,1
Missing value 1 0,1
Menu cycle Weekly 4 0,5
Monthly 77 9,1
5–6 weeks 355 42,1
> 6 weeks 313 37,1
Missing value 95 11,3
Number of menus to select 1 menu 62 7,3
2 menus 163 19,3
3 menus 132 15,6
4 menus and more 293 34,7
Free choice of components 136 16,1
Missing value 58 6,9
Nutrient composition is known Yes, will be calculated by us 175 20,7 Determined by deliverer 440 52,1
Not known 198 23,5
Missing value 31 3,7
Different portion sizes are offered Yes 601 71,2
No 227 26,9
Missing value 16 1,9
Action days/weeks are performed Yes 502 59,5
No 334 39,6
Missing value 8 0,9
3.3 Evaluation
On the whole, the findings show that the “meals on wheels” service meets the needs of older people in a wide range. This impression is supported by the results of all three survey tools. What is also true is that the findings point to both strengths and weaknesses.
Fig. 8. Study design
4. FOOD SAFETY
4.1 Microbiological Aspects
4.1.1 Methodology
The situation with regard to the occurrence of the most important foodborne infections and intoxications as well as the incidence of the responsible pathogens in foods in Germany is presented in its current status and in comparison with past years on the basis of the docu-mentation of foodborne disease outbreaks by the Robert Koch Institute (RKI) and supple-mentary data surveys conducted by the Federal Institute for Risk Assessment (BfR).
4.1.2 Results
In recent years, there has been a strong decline in the number of reported incidents of salmonella infections in humans, caused in particular by Salmonella enteritidis. According to the survey findings of the regional states, salmonella is also being detected less frequently in raw chicken and pork meat and in hen’s eggs. In contrast, the reported figures for infections with bacteria of the Campylobacter species in Germany are still considerably higher. Listeriosis is only of secondary importance in terms of absolute numbers (Table 6) but is extremely dangerous. This disease increasingly affects old people and those with underlying diseases, and this may be connected to the increase in the number of people with weaker immune systems as a result of the demographic trend. Changed intake habits, above all the trend towards pre-packaged foods that are cooled for long periods and not heated prior to intake, may also play a role in the rising number of reported cases of listeriosis. The high number of reported cases of norovirus and rotavirus infections and the increase in the number of cases of hepatitis E infections acquired in Germany underline the importance of research into the occurrence of these viruses in different foods as well as into transmission paths and ways of inactivating these viruses. As no suitable detection techniques exist for most food groups, it is not yet possible to estimate the actual percentage of foodborne viral infections. Trichinellosis is an extremely rare disease in Germany, and fattening pig stocks in Germany are practically trichinella-free. Livestock in some Eastern European countries is infected with this parasite more frequently, however, with the result that intake of raw meat from these countries or products made from this meat like cold cuts or raw ham can lead to infection.
Table 6. Verified* foodborne disease outbreaks which were transmitted from Germany to the EFSA, 2007 to 2010
4.1.3 Evaluation
4.2 Undesired Substances in Food – Residues of Plant Protection Products
4.2.1 Methodology
The frequency of occurrence of plant protection products and their residues is reported and assessed on the basis of the annual “National Report on Plant Protection Products in Food” (Federal Office of Consumer Protection and Food Safety [BVL]) and the supplementary quar- terly evaluations of the official investigation findings published by the BVL since the spring of 2009 (these findings are broken down into samples from Germany, the European Community, third countries and of unknown origin).
4.2.2 Results
A total of 70,358 samples were analysed in Germany in the period from 2006 to 2009, an increase of around 31% on the period between 2002 and 2005. 39.1% of the samples had no detectable residues, 56.6% contained residues within the admissible limits and 4.3% contained levels of residues above these limits. While the percentage of samples without detectable residues was more or less constant in the period from 2006 to 2009, the per-centage of samples with residue levels above the admissible limits steadily decreased, from 5.4% in 2006 to 3.2% in 2009. At the same time, advances in analytical methods mean that the number of substances for which samples are tested has increased steadily in recent years, so that tests cover a far wider range of substances than they used to. As in previous years, testing focused on foods of plant origin, in particular fruit and vegetables. On average 4.6% of 63,938 tested samples contained residues above the admissible maximum content, with the overall rate falling from 6.0% in 2006 to 3.4% in 2009. Within the frame- work of risk-oriented controls, apples, strawberries, table grapes, sweet peppers, lettuce and tomatoes were tested particularly frequently.
Multiple residues (Fig. 10): More than one residue was detected in 25,613 of the 63,938 samples of plant-based foods analysed between 2006 and 2009. Around one in three of the former contained two residues, one in five contained three residues and a further one in five more than five residues. Ten and more residues were found in 4% of the samples. During this reporting period as well, infant food was generally found to have no detectable residues.
Fig. 10. Amount of multiple residues (R) in plant-based foods in the years 2006 to 2009
4.2.3 Evaluation
The overall trend with regard to residues remains positive, and there were no detectable residues in most of the infant food and organic food products during the reporting period.
As in previous years, fruit and vegetables were the focal point of testing activities. There has been a continuous downtrend in residue levels exceeding the maximum content in recent years and results are now almost consistently in the low single-digit percentage range. The possibility that this is partly due to Europe-wide harmonisation of maximum concentrations cannot be ruled out, however. In all products, levels above the acute reference dose that is of relevance to human health were seldom exceeded. Testing and assessment strategies are currently being developed for the assessment of the occurrence of multiple residues.
In summary, it can be said that the evaluation of residues of plant protection products provides no evidence whatsoever to suggest that people should refrain from including a high percentage of fruit and vegetables in their daily diets as recommended by nutrition experts.
4.3 Residues in Food of Animal Origin
4.3.1 Methodology