Alternative Methods of Grading One or
More Multiple Choice Examinations
S.
J.
KILPATRICK, JR.
Department of Biometry,
Medical College of Virginia,
Richmond, 23219
The Single Multiple Choice Examination
The labor of grading large classes has been greatly reduced by the use of a computer equipped with an optical scanner. In examinations since 1965, stu-dents studying medicine at the Medical College of Virginia have been given precoded answer sheets con-taining the student's name and Social Security number. Answers to multiple choice questions are recorded by marking one of the five 'boxes' against each question number. These answer sheets are then compared auto-matically against a master sheet and each student's score totaled. Results for the class are printed in alpha-betical and rank order giving the following information:
The number of correct answers, The percentage of correct answers,
The "z" score, ie, (number correct - class mean)/ class standard deviation,
The standardized score, i.e. the z score stand-ardized to a mean of 50 and a standard de-viation of 10.
Students may be graded Honors, Pass, or Fail as the standardized score is greater than 70, between 70 and 30, or below (Rosinski and Hamilton, 1966).
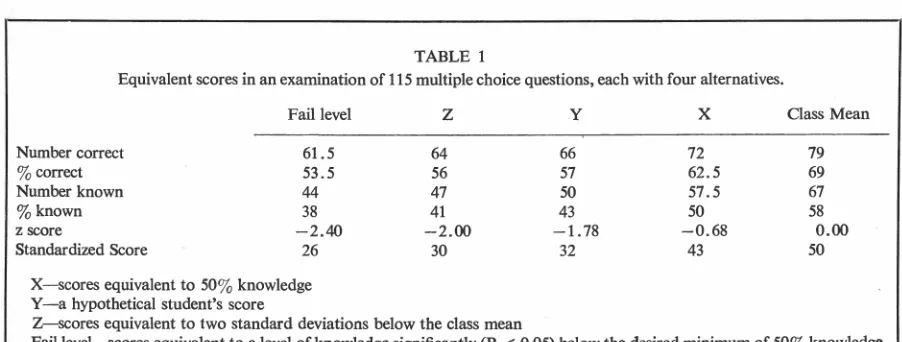
Example: Consider a hypothetical student Y (Table 1) who scored 66 correct out of 115 multiple choice questions, each with 4 alternatives. Assume that the class mean was 79 correct and the standard deviation of the class scores was 7.3. Then Y's performance in the examination would be sum-marized as:
Number of questions correct = 66 Percent correct= 66/115 = 57% z score
=
66 - 79=
-
1 787.3 .
Standardized score = 50
+
10( -1.78) = 32 In this section we present an alternative approach to grading in which each student's performance is eval-uated without reference to his peers. Since a stu-dent's knowledge of the material may be directlyestimated from a multiple choice examination, a fail-ing grade would be given to those whose knowledge was insufficient. This would require the instructors of the course to define, before the exam, the mini-mum performance they would accept as satisfactory.
It is felt that this would be preferable to the current practices in which either a standardized score of 30 is taken arbitrarily as the cut-off level, or the pass level is set after examining the distribution of the class's standardized scores.
Review of the Literature
In an examination of n multiple choice questions each with a alternatives, McCall (1920) relates s, the number of questions which a student might be expected to answer correctly to k, his knowledge of the material. His argument leads to the relation-ship:
s
=
nk+
n(l - k)/ a. (1) Conversely the student's knowledge of the ma-terial may be estimated by:(2) Lyerly (1951) shows that (1) and (2) are unbi-ased estimators of the student's "true score" and his "true knowledge" of the material.
Grading a Single Examination
It is recommended that a failing grade be given only to those students who score significantly beiow what can reasonably be expected from a person with a minimum passing knowledge of the material. We may, therefore, define a failing grade as a percentage score (s/n) % where
~
<
;; -
2~;
(I - ;) /
n (3)This criterion 1s derived from a simple
x
2 test of significance with one degree of freedom. The Type I error associated with ( 3) is approximately 2 % .Example: Assume that for the hypothetical examination described by Table 1, a minimum passing knowledge of 50% was set. By (1) this is equiv-alent to a score of 62.5% correct or 72 ques-tions correct. The cut-off is then calculated from (3) as
s
<
.625 - 2v'.625x
.375/115n
s
or
<
53.473n
This is equivalent to 61.5 questions correct. Y is therefore judged to have passed the ex-amination since his score of 66 (57%) correct is greater than 61.5 (53%), the pass-fail cut-off.
Table 1 contrasts Y's performance with the class mean, X (the minimum expected level of perform-ance disregarding sampling variation), Z (a cut-off based on two standard deviations below the mean of the z scores), and the pass-fail cut-off defined as a level of knowledge significantly below the minimum expected. Note that this pass-fail criterion is equiv-alent in this example to nearly two and one-half
terial. While the definition of a failure in a single examination as illustrated may appear permissive,
this depends on the choice of the minimum level of knowledge k,,. However, the application of this cri-terion to a student's performance over the year is as we shall see more stringent.
Promotion
Use of an Index in Promotion
Rosinski and Hamilton ( 1966) combine the stan-dardized scores from a series of multiple choice ques-tions into a Cumulative Weighted Standardized Score (CWSS). In this section we compare a number of indices including the CWSS and examine the validity of using a single figure to represent a student's per-formance over the year.
An overall score for the year may be defined in terms of the type of score used, its weight, and how these are combined into a single index. Many eco-nomic, demo~aphic, psychological, and other in-dices are defined as linear weighted functions. This practice is also consistent (Kilpatrick, 1962) with the concept of the index as an estimator of a con-stant unknown parameter. In the following we con-sider only simple linear combinations of scores.
Three types of weights are considered. Equal weights result in the index being the mean of the scores. The CWSS in practice uses weights proportional to the relative number of teaching hours in each subject. These two sets of weights will be compared against "ideal" weights generated by principal com-ponent analysis. In principal component analysis the class scores from a series of examinations are re-structured as orthogonal (uncorrelated) linear com-binations of the original scores. Not only are these
TABLE 1
Equivalent scores in an examination of 115 multiple choice questions, each with four alternatives.
Fail level
Number correct 61.5
% correct 53.5
Number known 44
%known 38
z score - 2.40
Standardized Score 26
X- scores equivalent to 50% knowledge Y- a hypothetical student's score
z
64 56 47 41
- 2.00 30
Z- scores equivalent to two standard deviations below the class mean
y
x
66 72
57 62.5
50 57.5
43 50
- 1.78 - 0.68
32 43
Class Mean
79 69 67 58
0.00 50
TABLE 2
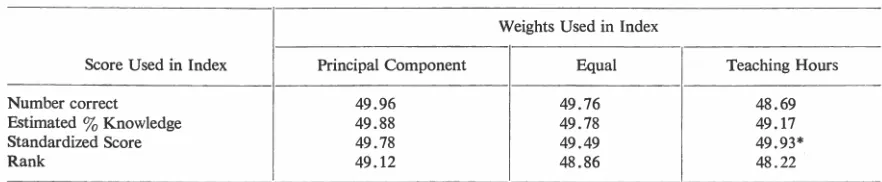
For a given class of medical students, the table gives the percentage of variation in the number of correct questions extracted
by an index of the type shown.
Weights Used in Index
Score Used in Index Principal Component Equal Teaching Hours
Number correct 49.96 49. 76 48.69
Estimated % Knowledge 49.88 49.78 49.17
Standardized Score 49.78 49.49 49.93*
Rank 49.12 48.86 48.22
I
*
Cumulative Weighted Standardized Score as used at the Medical College of Virginia. This includes bonus questions and other artifacts which in this particular case result in an index extracting more of the variation than is theoretically possible.components independent, but the weights are
ad-justed so that the first or principal component ex-tracts or explains the maximum degree of variability
that can be extracted by any linear index. The sec-ond and remaining components are defined in
de-creasing order of the amount of variability
ex-tracted (Harman, 1967).
Each of these three weighting systems is used in
the formation of an index combining the four
pos-sible scores available. These are: the number of cor-rect questions; the standing or rank of a student in
the class based on the number of questions answered correctly; the standardized score defined in the in-troduction; and the estimated knowledge level de-fined in equation ( 2), or the percent of questions the student is estimated to know without guessing.
These 12 indices (three weighting systems by four
types of scores) were calculated for each of the 86 students who completed the second phase of the
inte-grated medical curriculum at the Medical College of
Virginia. (Table 3 lists the 14 component
examina-tions in this phase.)
The relative amount of variability extracted by each index is shown in Table 2. Surprisingly each of
the 12 indices leaves more than 50% of the
variabil-ity among students' scores unaccounted for. In other
words, if this data is typical, a single linear com-bination of scores from different examinations will
describe no more than about half of the differences
among students' scores over the 14 examinations. Since the percent variability extracted by these
in-dices are approximately equal, they are all equally
uninformative.
We now investigate whether by using two indices
we can increase the percent variation accounted for. This would be equivalent to representing a student's
overall performance as a point on a graph rather
than as a point on a line. The second principal
com-ponent which by definition extracts the maximum
of the remammg variability added only 8.6%. Thus, using two figures to represent 14 examination results accounts for, at most, only 58.6% of the total
var-iability in the data used here. As one or even two indices cannot adequately represent a student's per-formance over a year, we now consider the
applica-tion of the criterion introduced in the first section to
the problem of promotion.
Unsatisfactory Performance in a Series of
Exam-inations
In the first section it is recommended that a failing
grade be given to students who score significantly less than that expected of a person with a minimum acceptable knowledge of the material. We recom-mend the same criterion for promotion, viz. that a student would not be promoted if his total score for
the year or phase was significantly less than that expected of a hypothetical student who, in each
com-ponent examination, knew only the minimum
ac-ceptable.
The cut-off for the year would be calculated as
before using equation ( 3) except that now, s. would be defined as the sum of the s0 scores in each exami-nation and n would be the total number of questions given in all examinations.
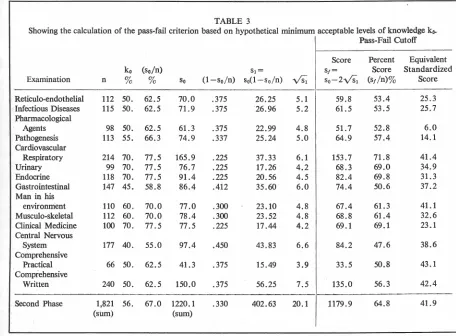
Example: Table 3 shows the application of the criterion
to each of 14 examinations in the second phase of the medical curriculum. The sum over all
14 examinations of So is the number of correct questions which might be expected of a student with a min'imum acceptable knowledge throughout the phase. This is equivalent to 67% correct or 56% knowledge of the material
examined. Following the same procedure as
before (shown on last line of Table 3) and
knowledge. This is in contrast to the difference be-tween the cut-off level and expected minimum in a single examination. Thus, in Table 1, the cut-off level (53.5%) is 9% below the desired minimum of 62.5 % . With nearly 2000 questions we can de-tect more readily those students whose knowledge falls significantly below -the acceptable minimum for the year.
Table 3 shows that in typical examinations the minimum passing score in terms of percent correct is generally greater than the minimum passing level
of knowledge. The requirement that a student needs to score more than 65 % correct over the year is here based on minimum pass levels in the sep-arate exams ranging from 48 % to 72 % correct. These in turn derive from minimum acceptable lev-els of knowledge ranging from 40% to 70%. For the benefit of readers used to standardized scores,
Table 3 gives the standardized scores equivalent to the hypothetical passing levels adopted here.
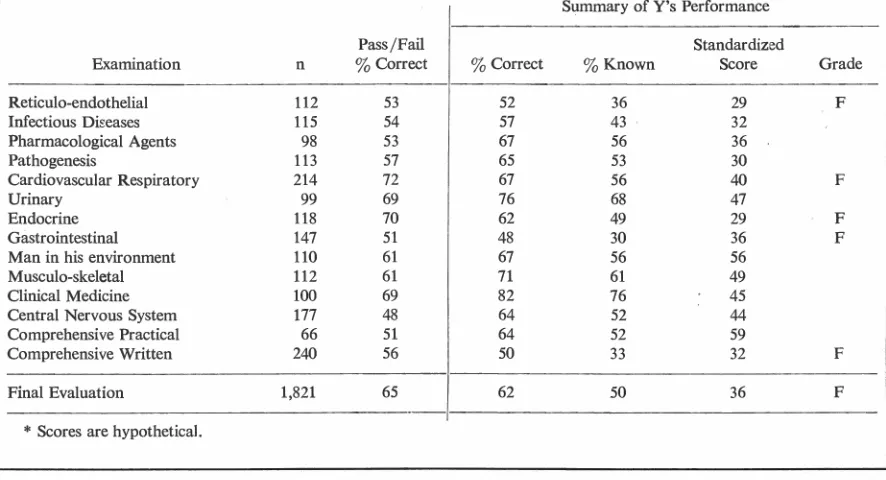
In Table 4, Y's performance is compared with these cut-off levels in each of the 14 component
endothelial, cardiovascular, endocrine, gastrointes-tinal, and written comprehensive sections of the year. Even if he had not failed these sections, Y should not be promoted since over the whole year he scored less than the minimum of 65% correct. Therefore, Y's knowledge of the material in this phase of the curriculum fell significantly below the (hypothetical) minimum level of 56% knowledge required of students for promotion.
Discussion
Use of the standardized score from a single ex-amination to award grades of Pass or Fail implies
that students are judged against their peers and that no absolute standard is possible. The alternative pro-posed here is to use the percent of questions known for evaluation. To estimate the percent of questions known, it is assumed that when a student does not know the answer he guesses among the alternatives.
It is further assumed that in such guessing each al-ternative is equally likely. Clearly these assumptions are only a first approximation. However, this
ap-TABLE 3
Showing the calculation of the pass-fail criterion based on hypothetical minimum acceptable levels of knowledge ko. Pass-Fail Cutoff
Score Percent Equivalent
ko (so/n) S1= S1= Score Standardized
Examination n % % So (1-so/n) SoO - so/n)
vs;
So-2Vs1 (SJ /n)% ScoreReticulo-endothelial 112 50. 62.5 70.0 .375 26.25 5.1 59.8 53.4 25.3 Infectious Diseases 115 50. 62.5 71.9 .375 26.96 5.2 61.5 53.5 25.7 Pharmacological
Agents 98 50. 62.5 61.3 .375 22.99 4.8 51. 7 52.8 6.0
Pathogenesis 113 55. 66.3 74.9 .337 25.24 5.0 64.9 57.4 14.1 Cardiovascular
Respiratory 214 70. 77.5 165.9 .225 37.33 6.1 153.7 71.8 41.4 Urinary 99 70. 77.5 76.7 .225 17.26 4.2 68.3 69.0 34.9 Endocrine 118 70. 77.5 91.4 .225 20.56 4.5 82.4 69.8 31.3 Gastrointestinal 147 45. 58.8 86.4 .412 35.60 6.0 74.4 50.6 37.2 Man in his
environment 110 60. 70.0 77.0 .300 23.10 4.8 67.4 61.3 41.1 Musculo-skeletal 112 60. 70.0 78.4 .300 23.52 4.8 68.8 61.4 32.6 Clinical Medicine 100 70. 77.5 77.5 .225 17.44 4.2 69.1 69.1 23.1 Central Nervous
System 177 40. 55.0 97.4 .450 43.83 6.6 84.2 47.6 38.6
Comprehensive
Practical 66 50. 62.5 41.3 .375 15.49 3.9 33.5 50.8 43.1 Comprehensive
Written 240 50. 62.5 150.0 .375 56.25 7.5 135.0 56.3 42.4
Second Phase 1,821 56. 67.0 1220.1 .330 402.63 20.1 1179.9 64.8 41.9
TABLE 4
An example of Y's performance in the second phase of an integrated medical curriculum in which the examinations consist of multiple choice questions, each with four alternatives.*
Pass/Fail Examination n
3
CorrectReticulo-endothelial 112 53 Infectious Di~eases 115 54 Pharmacological Agents 98 53
Pathogenesis 113 57
Cardiovascular Respiratory 214 72
Urinary 99 69
Endocrine 118 70
Gastrointestinal 147 51
Man in his environment 110 61
Musculo-skeletal 112 61
Clinical Medicine 100 69
Central Nervous System 177 48 Comprehensive Practical 66 51 Comprehensive Written 240 56
Final Evaluation 1,821 65
*
Scores are hypothetical.proach is useful in defining the minimum number of questions which will be considered satisfactory in a given examination. If, in a multiple choice examina-tion of 100 quesexamina-tions with four alternatives per ques-tion, 63 correct is set as the minimum passing level, this score can be made by a student who knows and answers 50 questions correctly and who then se-lects his answers to the remaining 50 at random. A student who knows the answers to 50 of the ques-tions and who has partial knowledge of the remain-ing 50 questions should be able to score higher than 63 because he will be able to exclude some of the alternatives in each question before guessing the answer. Likewise, a student who knows the answers to 26 questions but is able to exclude two of the four alternatives in each of the remaining 74 will on average also answer 63 questions correctly. Use of the estimated percent of questions known is rec-ommended, therefore, not as a model of what hap-pens in a multiple choice examination but as a means of providing the faculty with a procedure for es-tablishing minimum pass levels.
The foregoing analysis, however, raises the ques-tion of the utility of a system in which the student is examined on average every month. It is impossible to discriminate in a multiple choice examination be-tween a student who knows half of the questions and guesses the remainder, and one who has a broad
Summary of Y's Performance
Standardized
% Correct
3
Known Score Grade52 36 29 F
57 43 32
67 56 36
65 53 30
67 56 40 F
76 68 47
62 49 29 F
48 30 36 F
67 56 56
71 61 49
82 76 45
64 52 44
64 52 59
50 33 32 F
62 50 36 F
but partial knowledge of the subject which enables him to exclude many of the alternatives and select the correct answer with a high degree of probabil-ity by a process of exclusion. In a series of mul-tiple choice examinations, neither the Combined Weighted Standardized Score nor any other linear index proved to be satisfactory because students in the class chosen for analysis exhibit varying degrees of knowledge in the different examinations. Exam-inations are useful as a teaching device and this aspect needs to be more emphasized, especially with students. One way of achieving this is to retain the current series of examinations throughout the year but to stop grading these examinations. They could still be scored by the computer and the results gen-erally released.
The student would not be promoted if his 'aver-age' over the year fell below the cut-off for promo-tion. This knowledge would be a sufficient stimulus to motivate the student to learn the material pre-sented in a given year or phase of the medical cur-riculum. The idea is similar to the requirement that college students, to remain in good academic stand-ing, maintain a B average.
off, since two standard deviations below the mean will, in a normal distribution, exclude about two in 100 students. Moreover, the use of the percent cor-rect and hence the standardized score is unfair. Hamilton ( 19 50) shows that scores in multiple choice examinations are biased upwards, the student who knows fewer of the answers gaining more from this bias than those who know the material well.
At the Medical College of Virginia, the Com-bined Weighted Standardized Score is calculated for each medical student at the end of each phase of his training, using weights proprotional to the number of hours taught in each system. The comprehensive examinations in the second phase are arbitrarily given 25 % of the total weight. The CWSS's are used to rank the students and this ranking of students is used during promotion considerations. Since the CWSS, together with other indices, leaves half of the total variability of students' performance un-accounted for, this procedure is clearly not too satisfactory. The promotions committee evaluates stu-dents against a CWSS equivalent to the mini
-mum passing level in each section (in the event of there being no failures in a section, the lowest stand-ardized score in that examination is used). This criterion is rather arbitrary and, although other in-formation is considered, the decisions reached re
-garding promotion are subjective. The faculty are hindered rather than helped by the CWSS which has no clear interpretation. This is evidenced by the erroneous assumption that the CWSS has a stand-ard deviation of 10. The CWSS has a standard deviation smaller than 10 because of a positive cor-relation among a student's scores over a year. Thus,
at the end of the second phase Y would be consid-ered for promotion using a CWSS of 41 rather than a standardized score of 36 or 1.4 standard de-viations below the class mean (Table 4).
This paper describes the use of the standardized score in grading multiple choice examinations by computer. Since standardized scores make no allow-ance for guessing, it is recommended that the per-cent of questions known be used instead, and that a student who correctly answers significantly fewer than a predetermined number of questions be given a failing grade.
The performance of a class of sophomore medical students in a series of 14 multiple choice examina-tions was analyzed. It was found that no single linear combination of their scores could account for more than 50% of the variability among students over the year. Therefore, it is recommended that the grading of subject matter examinations into Pass or Fail be ended. Promotion would not, however, be granted to those students who scored significantly below that expected of a person with overall minimum know-ledge of the material. Students entering this system would be informed of the overall minimum passing level for that year or phase and given, after each section examination, their cumulated score of ques
-tions correctly answered. It is considered that a change such as this toward liberalization of the ex-amination system would be welcomed by students and faculty alike.
References
Hamilton CH: Bias and error in multiple choice tests.
Psychometrika 15: 151, 1950
Harman HI: Modern Factor Analysis. Chicago, Univer-sity of Chicago Press, 1967
Kilpatrick SJ': Occupational mortality indices. Population Studies 16: 175, 1962
Lyerly SB: A note on correcting for chance success in ob-jective tests. Psychometrika 16: 21, 19 51
McCall WA: A new kind of school examination. Educa-tional Research 1: 33, 1920
Rosinski EF, Hamilton DL: Examination procedures