* Corresponding Author: Ali Yoonessi, MD, PhD,
School of Advanced Medical Technologies and Iranian National Center for Addiction Studies Tehran University of Medical Sciences. Email:[email protected]
Previous evidence has shown that the number of L and M cones in retina varies significantly between subjects. However, it is not clear how the variation of L/M ratio changes the behavioral performance of the subject. A model of transformation of data from retina to visual cortex for evaluation of various L/M cones ratios is presented. While L/M cone ratios close to 1 brings the best performance for one of postreceptoral (magnocellular) channels, we showed that the performance in the second channel (parvocells) will improve when the ratio furthers away from 1. Effects of different ratios of S were also explored.
A B S T R A C T
Article info:
Received: 28 March 2012
First Revision: 25 April 2012
Accepted: 25 July 2012
Ali Yoonessi1,3, Mojtaba Hajihasani4, Shahriar Gharibzadeh4, Mohammadreza Zarrindast1,3, Ahmad Yoonessi5
1. School Of Advanced Medical Technologies, Tehran University Of Medical Sciences, Tehran, Iran. 2. Eye Research Center, Tehran University Of Medical Sciences, Tehran, Iran.
3. Iranian National Center For Addiction Studies, Tehran, Iran.
4. Department Of Biomedical Engineering,Amirkabir University Of Technology, Tehran, Iran. 5. Mcgill Vision Research, Mcgill University, Montreal, Canada.
1. Introduction
hree types of cones exist in human retina with different spectral sensitivities. L (sen-sitive to Long wavelengths), M (Medium), and S (Short) cones form the input for the postreceptoral pathways that transfer information from retina to the primary visual cortex via lateral geniculate nucleus. Postreceptoral pathways include three types of cells; large and fast magnocells which transfer the lu-minance information, delicate and slow parvocells that compare the inputs of L and M cones, and less frequent koniocells that heavily rely on the input of S cones and its comparison with the other two types of cones.
Behavioral, structural, and computational studies have furthered our understanding of how the cones and post-receptoral pathways are arranged. Magnocells collect
Summer 2012, Volume 3, Number 4 Basic and Clinical
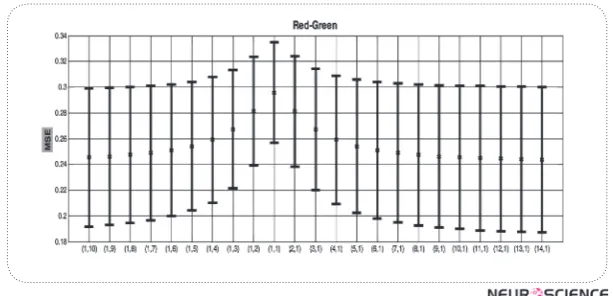
Luminance (Lum), Red-Green (RG), and Blue-Yellow (BY) for three post-receptoral channels magno, parvo and konio cells respectively.
However, direct imaging techniques of human retina as well as functional tests and post-mortem analysis have showed that the ratios of L to M cones vary signifi-cantly among different subjects. A behavioral estimate of L/M cone ratio suggested a range of 0.6 to very high (near deuteranopic, i.e. no M cone) ratio1. A postmortem
analysis of retina of 23 male subjects showed a variation of L/M cone ratios of 0.8 to 32, and a later expansion of
the study of 100 males showed a wider range of 0.8 to 9.7. In 1999, a report of direct retinal imaging in two subjects showed an L/M ratio of 1.15 and 3.793.
The variance in the L/M ratio begs the question wheth-er the input to each of postreceptoral pathways varies based on the ratio of the cones. In other words, if the L/M ratio is, for example, 2/1 in a person, does magno-cellular pathway receive input from an average of two Ls and one M, or it remains constant and a summation of one L and one M? The latter does not make sense since it would be a waste of resources for the organism, and the speculation is that during the critical period, when the ‘pruning’ of neurons happens, extra unused cones should vanish.
Yet, another possibility might be the usage of a fixed ratio for one of the pathways for most of the subjects, and a different ratio for another pathway. A model then would be, for example, 1*L+1*M+1*S for the magno-cells, while the parvocells may use the input by vari-ous ratios in different subjects, i.e. x*L-y*M (where x/y would be the ratio of L/M). We have evaluated the ef-fect of various coding on the transfer of information and their efficacy.
2. Methods
We used a publicly available color calibrated database from McGill University4. These images are from
natu-ral scenes taken by a calibrated camera and have been divided into several categories such as animals, land-scape, snow, fruits and flowers. RGB values of each pixel of each image were converted to a model of LMS cone responses (for details of this conversion, please see5). In summary, the scenes were photographed with a
Nikon CoolPix-7500 digital camera. The cameras were calibrated as follows. Each one of a set of grey Munsell papers was illuminated by an incandescent light with a constant-DC power, and photographed. Additionally, the luminance of the light reflected from each paper was
measured with a Topcon SR-1 spectroradiometer. The average R, G, and B pixel values were plotted against the corresponding measured luminance, and fitted with the following function: L = a(bs +1), where L is lumi-nance, s is the pixel level value obtained for each of the camera sensors (R, G, and B) and b a constant that determines the slope of the curve. In addition, a white target was photographed through a series of narrowband optical interference filters from 400 to 700 nm at 10nm intervals. Each R, G and B value was recorded, gamma-corrected and used to construct a spectral sensitivity function for each sensor, which was then normalized to produce equal responses of to a flat-spectrum light.
In order to model the three post-receptoral channel re-sponses to images of natural scenes one needs to use a color space. The most commonly used color space is a version of the one developed by MacLeod and Boyn-ton and later by DerringBoyn-ton and colleagues6,7. In the
cone-contrast version each cone's response is normal-ized to that of the cone response to the stimulus back-ground, e.g. ΔL/Lb, ΔM/Mb, ΔS/Sb, as the background
cone contrast is assumed to determine the state of cone adaptation. While this is a reasonable assumption for briefly presented stimuli such as gratings, or low con-trast patches, it is arguably inappropriate for natural scenes which tend to be of high contrast and for which cone adaptation is likely determined locally rather than by the average of the scene as a whole. Another, loga-rithmic-based version suggested by Ruderman Cronin & Chiao8, transforms cone responses to a logarithmic
space and then normalizes each post-receptoral channel response by the mean (log) value over the image. The logarithmic transform models a transducer function that produces Weber’s law for increment thresholds9, and
re-moves pure-luminance shading and shadows from the red-green channel. The three channels were modeled as equation 1:
And then
Where x, y and z are the ratios of the three cones.
We used a series of consequent values for each of co-efficients x (from 1 to 14) and y (from 1 to 10); i.e. (x=1,2,3,…,14, y=1,2,3,…,10), or in other words, we created an array of (x,y)=(1,10),(1,9),…,(1,1),(2,1),(3, 1),…,(14,1). We used higher values for x because pre-vious studies have reported ratios of L to M from 13 to 0.4. In this sequence, in fact, we covered a range of L/M ratio of 14 (14:1) to 0.1 (1/10). For the first step, we used a zero value for S cone coefficient to assess the main aim of the research, the L/M cone ratio effect.
for example, for dimension reduction or compression of data. Previous studies have shown that the three princi-ple components of data of natural scenes closely match the way the post-receptoral channels convey informa-tion 8. After mean subtracinforma-tion in PCA, a minimum mean square error is calculated and the first axis will be measured based on that.
Then similar to principle component analysis, the mini-mum standard error (MSE) of the data points from 3 axes (Lum, RG, BY) was calculated jointly. To be pre-cise, first the MSE of the data points from the luminance axes were found and then all the data point space were projected into the plane witch composed from conjunc-tion of the BY & RG axes. Finally, the quantity of the MSE from BY & RG axes were measured using coordi-nation of the mapped data points.
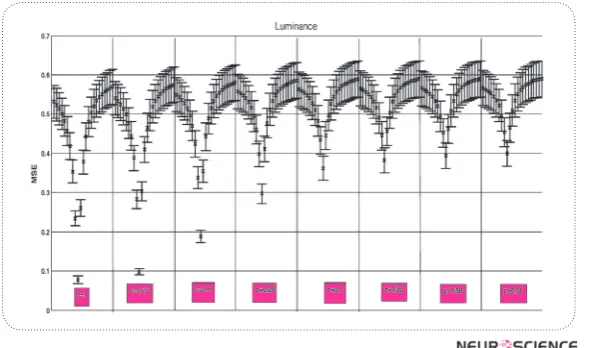
Figure 1. MSE fromLuminance Axis with standard errorsfor consecutive values of x and y (x axis).
Summer 2012, Volume 3, Number 4 Basic and Clinical
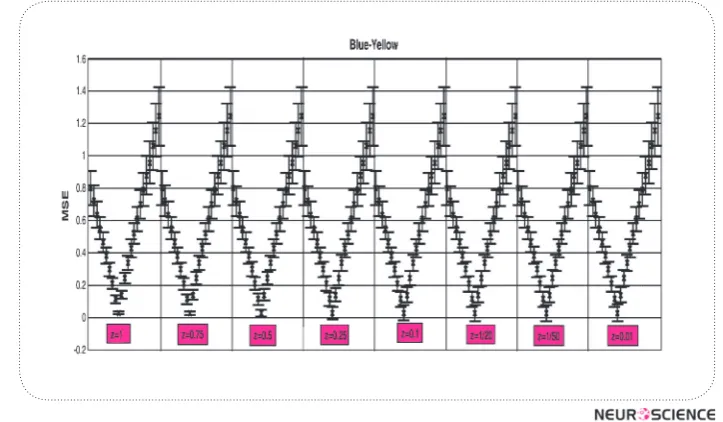
Figure 3. MSE fromBY Axis with standard errorsfor consecutive values of x and y (x axis).
Figure 4. Summary of MSE values on the same scale for all three axis
3. Results
We also used the same caluclaution for differ-ent values of z (x=1,2,3,…,14),( y=1,2,3,…,10) and
Figure 5. MSE fordifferent x and y values in the luminance channel separated by different z values.
Figure 8. Summary of MSE in all three AXES, on the same scale.
Summer 2012, Volume 3, Number 4 Basic and Clinical
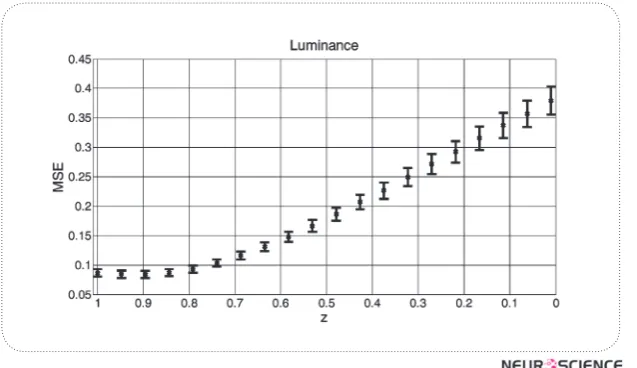
In the final part of our experiment, we measured the ef-fect of changes in z (S cone ratio), while keeping the x
Figure 9. The Mse Will Increase If The L And M Ratio Are Fixed While The Ratio Of S Cone Increases.
and y (L and M ratios) fixed. The MSEs are measured in luminance channel. The results are shown in figure 9.
4. Discussion
Retinal L/M ratio varies significantly in humans. We showed that the changes in L/M ratio make one of the axis less effective, while the other one more efficient, and therefore, make the effects of changes less variable in the post-receptoral channels. With changes in L/M ratio far away from 1, the efficiency of luminance chan-nel (magnocells) would be less efficient, and the parvo cells change in the other directions.
One of the possibilities of the structure of postrecpeto-ral channels is that they do not use all the retinal cones available for their input. In other words, while the ratio of L/M may vary, for example for parvocells, the ratio for magnocells may remain 1/1 in humans. This possi-bility, though not very plausible, may exist. In this case, the ratio of L/M will affect only the parvocells and its sensitivity, while the magnocells may remain similar in most of the subjects.
To test this model, the white point may vary for subjects that their red-green contrast balance for isoluminant point is different. Since the isoluminant point can be used to measure the L/M ratio of the parvocells, if the same ratio could be applied to magnocells, we would expect that the white point for these subjects vary as well. The white point should lean toward red (L/M ratio >1) or green (L/M ratio<1).
In summary, the variation in L/M cone ratio would lead to lower performance in one post-receptoral channel, while increases the efficiency in the other channels.
References
Lutze, M. (1988). Genetics of foveal cone photopigment sensi-tivities and receptor populations.
Hagstrom, SA., Neitz, J., Neitz, M. (1998). Variations in cone populations for red-green color vision examined by analysis of mRNA. NeuroReport. 9(9):1963.
Roorda, A., Williams, DR. (1999). The arrangement of the three cone classes in the living human eye. Nature. 397(6719):520– 522.
Olmos, A., Kingdom, FAA. (2004). McGill calibrated colour im-age database. URL http://tabby. vision. mcgill. ca. Last ac-cessed. 2011:05–08.
Yoonessi, A. (2008). Comparison of sensitivity to color changes in natural and phase-scrambled scenes. JOSA A. 25(3):676– 684.
Derrington, AM., Krauskopf, J., Lennie, P. (1984). Chromatic mechanisms in lateral geniculate nucleus of macaque. The Journal of Physiology. 357(1):241–265.
MacLeod, DIA., Boynton, RM. (1979). Chromaticity diagram showing cone excitation by stimuli of equal luminance. JOSA. 69(8):1183–1186.
Ruderman, DL., Cronin, TW., Chiao, CC. (1998). Statistics of cone responses to natural images: implications for visual coding. JOSA A. 15(8):2036–2045.