1
Research JournalVolume 10, No. 29, March 2016, pages 1–12
DOI: 10.12913/22998624/61925 Research Article
Received: 2015.12.15 Accepted: 2016.02.01 Published: 2016.03.01
COMPARE THE BEHAVIOR FACTOR OF THE ULTIMATE RESISTANCE OF
MOMENT FRAME, PLAIN AND PERFORATED STEEL PLATE SHEAR WALLS,
AND BUCKLING RESTRAINED BRACE AS YIELDING METAL DAMPER
Hamid Reza Ashrafi1, Kasra Shahbazian1, Shaahin Bidmeshki1,
Somaye Yaghooti1, Peyman Beiranvand1
1 Technical and Engineering Faculty, Razi University, Kermanshah, Iran, e-mail: h_r_ashrafi@yahoo.com; peyman51471366@gmail.com
ABSTRACT
Steel moment frame systems, steel plate shear walls and also buckling restrained brace (BRB) are considered as the most widely used seismic resistant systems of the world. Firstly, in this research, in order to validate the finite element models, the tested sample of steel plate shear walls of 4 floors at the University of Alberta, Can-ada, and the tested sample of buckling restrained brace at the University of Berkeley California, with the software ABAQUS 6.10-1 were used. Then, the obtained results of the test and analysis have been compared. The confirmed models have been used for the analysis of two-dimensional frame of plain and perforated steel plate shear walls with a regular pattern of positing holes in the screen, buckling restrained brace and moment frame of 4 floors.
Keywords: behavior factor, ultimate resistance, steel plate shear walls, buckling re-strained brace.
INTRODUCTION
Many structures during a moderate and se-vere earthquake enter the inelastic range, so in order to perform a structural design, one must use the inelastic analysis. Due to the ease of elastic analysis as well as the complexity and time-con-sumption of non-elastic analysis, regulations sug-gest factors to reduce lateral force of earthquake. Therefore, different ways to counter the lateral loads caused by earthquake are presented. These methods include: steel moment frame, all kinds of braces, shear walls, and so on.
The first research was conducted on thin not-
hard steel plate shear walls in 1983 by Torbren et al. They provided an analytical model for inves-tigating the shear resistance of thin not-hard steel plate shear walls [1].
Roberts and Saburi-Ghomi (1992) performed a series of alternating quasi-static load tests on not-hard steel plate shear panels with a central
circular opening. According to their recommen-dations, resistance (Vyp, perf) and hardness of perforated panels (Kperf) can be estimated as conservative by applying a linear reduction factor in resistance (Vyp) and hardness of similar solid panel (Kpanel) [2].
The first research was conducted in 1973 by Vakabayashy et al. in the field of buckling re -strained brace (BRB). They have proposed a sys-tem in which braces of steel plate were placed into the two plates of pre-stressed reinforced concrete. Several tests that were performed on this system showed that although the braces resistance in a little pressure is in stretch more than their resis-tance, but the cyclic behavior of the system is symmetrical and stable [3].
be-2
havior factor of 8. The results of this analysis showed that the behavior of buckling restrained braced frame in most cases is better than a com-mon converged braced frame. Also, responses of buckling restrained brace system are not sensitive to the behavior factor [4].
Unfortunately, in regulations 2800 no infor -mation on the behavior factor and steel plate shear wall resistance and buckling restrained brace is available. So in this article, it is considered to de-termine the parameters in two types of systems: lateral as well as moment frame (whose behavior factor is included in regulations 2800) and their
comparison. For this purpose, the finite element software ABAQUS6.10-1 is used.To validate the presented model in this application, the results of conducted experimental work by Draiver and co-workers used a sample of steel plate shear
wall, and reviewed the results by Cameroon
Black et al. on a sample of 1-99 braced buckling.
THE INTRODUCTION OF STUDIED
LATERAL SYSTEMS
Steel Plate Shear Walls
Steel plate shear walls (SPSW) are consid-ered a resistant system to lateral forces such as wind and earthquake forces. Steel plate shear
wall includes vertical steel plate called filler plate
that connects to beams and plates surrounding border columns in the total height of the frame. Filler plates can be used as hard or not hard. Rigid or simple connections can also be used in con-necting the beam to the column. If the design of steel plate shear wall is performed correctly, this
type of system, with ductility, will have sufficient
hardness and the ability for absorbing a lot of en-ergy [5].
Buckling Restrained Brace
Many conventional convergent bracing
be-havioral deficits, resulting from the difference
between compressive and tensile capacity of the braces, and reducing their resistance under cyclic loading. Therefore, in order to achieve a behavior of an ideal Elasto, a lot of research has been done to improve braces. To achieve this goal it was necessary to use appropriate mechanism to pre-vent the buckling compression brace and provide the possibility of steel pressure.For this purpose, the encapsulation of a ductile metal core was used
in a volume of enclosed concrete in a metal mem-brane. The main function of the damper is that in order keep pressure in it, a steel core buckling is prevented. In this way, the energy absorbed by the membrane increases.
In order to prevent buckling of the core, it
is placed in a filled steel sheath with concrete.
The system needs to provide a sliding surface or discontinuity layer between the metal core and surrounding concrete. The purpose of this sys-tem is that the bracing force just is tolerated by steel core. It should be designed with the above-mentioned sliding layer geometry and materials in such a way that provides the possibility of a relative movement between the steel and con-crete core that is caused due to Poisson effect. As a result, while preventing local buckling of the core, the possibility of its submission in the
loading pressure is provided. Concrete and steel
sheath provide hardness and necessary moment resistance to prevent the total buckling of brace and provide the possibility of load-bearing by
steel core to the surrender without a significant
reduction in hardness and resistance of brace
dur-ing loaddur-ing cycles. Concrete and steel sheath also
prevent the local buckling of the core [6].
Moment frame
Moment frame includes a set of beams and columns, which are connected to each other with a rigid connection. Resistance to lateral loads is
provided first by moment frame behavior, the cre -ation of bending moment and shears force in the connections and frame members. Given the na-ture of the rigid beam-column connections, due to lateral change of moment frame, bending moment will be created in beams and columns. So the ri-gidity and moment resistance of frame members
have a significant contribution in harden and lat -eral resistance of total frame.
Behavior factor
3
characteristics, load-deformation behavior,in-creasing resistance factor, participation of higher
modes and confidence factor of designing. Usually, behavior factor for different sys -tems of structure is estimated experimentally
and based on field observation of buildings per -formance in the past earthquakes. Since the early 1980’s, researchers sought to analyze the factor to its formation factors. Many laboratory studies were carried out including the research conducted
in Applied Technology Council (ATC).
Until now, researchers have used different
methods for calculating the behavior. By com-paring these methods one can divide them into two groups. One method is American research-ers and other European researchresearch-ers. Generally
US methods have simpler theoretical foundations
and practical applications. While European meth-ods have more complex analytics and theoretical
foundations, their use in practice is more difficult. US researchers’ methods include: Freeman ca -pacity spectrum method and Yang ductility factor. European researchers’ methods also include the theory of ductility and energy method.
In this study, Yang’s method was used to cal-culate the behavior factor. In Figures 1 and 2, rel-evant parameters and Pushovar curve with two linear graphs are shown.
According to this method, behavior factor is calculated based on the following formula:
Υ × Ω × =Rµ
R (1)
where: Rµ – is ductility reduction factor, Ω – is increased resistance factor, Y – is permitted stress factor.
Each of these parameters are described in the work [7].
Ductility reduction factor
Inelastic deformation capacity of structures is expressed with the help of their ductility fac-tor. The higher ductility (μ) capacity, the higher energy absorption, and consequently the amount of behavior factor will be larger. R μ and μ de-pend on various factors, such as the type of ma-terials, period of system alternation, damping of system, the type of loading, the load-deformation model, P-Δ effects and the backrest (soil type). According to Figure 1 the ductility factor of total structure µ is defined to maximum relative lateral displacement Δmax to the lateral displacement of relative yield Δy as:
y
∆
∆
=
maxµ
(2)The relationship between Rμ and μ has been studied by many researchers including the proto-col ATC-19 which recommended the methods by Niyomark and Hall, Kravinkler and Nesar, Mi-randa and Bortru. Each of the mentioned methods is summarized in the following sections.
Niyomark and Hall method. Niyomark and Hall, according to the main alternation periods of structure (T), provided the following formula to determine the reduction factor:
Rμ = 1 T ≤ 0.03 sec (3)
µ
µ
µ µ µ
=
− =
=
R R R
1 2 1
0.12 ≤ T ≤ 0.5 sec (4)
Rμ = μ T ≥ 1.0 sec (5)
Kravinkler and Nesar method. Kravinkler and Nesar provided a relationship for systems of a free degree on rocky ground or hard soil. Their suggested relationship changes according to the
Fig. 1. The general behavior of a conventional structure
4
period of structure alternation (T) and load de-flection-shift in the secondary part (α).
(
)
[
c]
cRµ = µ−1 +11 (6)
( )
T b T T Tc aa +
+ =
1
,α (7)
The parameters of a and b for different strain hardening ratio (α) are obtained as follows (α = 0% reflects full Elasto-plastic case. For dif-ferent values of α can use linear interpolation):
α = 0% : a = 1.00, b = 0.42 (8)
α = 2% : a = 1.00, b = 0.37 (9)
α = 10% : a = 1.00, b = 0.29 (10)
Miranda and Borutor method. Miranda and Borutor (1994) summarized therelationships developed by a number of researchers, includ-ing Niyomark and Hall, Ridil and Niyomark, and Kravinkler and Nesar. They also expanded the corresponding equations for rocky grounds, alluvial (alluvial) and soft sand. The formula of calculating ductility factor in terms of alternation period of structure and location of the building is as follows: 1 1+ Φ − = µ µ
R (11)
• For rocky grounds:
Miranda and Borutor method:
Miranda and Borutor in 1994 summarized developed relationships of a number of researchers,
including Niyomark and Hall, Ridil and Niyomark, and Kravinkler and Nesar. They also expanded
the corresponding equations for rocky grounds, alluvial (alluvial) and soft sand. The formula of
calculating ductility factor in terms of alternation period of structure and location of the building is
as follows:
(11)
For rocky grounds:
(12)
For alluvial grounds:
(13)
For soft soil grounds:
(14)
Tg is the alternation period of Accelerogram dominant.
The main alternation period:
The main alternation perids in steel moment frames, steel plate shear walls and buckling restrained
braced according to the formula of regulations that is below, were calculated.
- For steel moment frames:
(15)
- To frames of steel plate shear walls and buckling restrained braces
(16)
2-4-2- Factor of increasing resistance
(Ω)
The design regulations, structures are designed in such a way that none of them will not exceed the
elastic stage, otherwise the plastic hinge will be formed in them. As a result, the overall hardness of
the structure is reduced, but the structure will be able to resist till the hinges formation caused to
create mechanism and structure hardness conducted toward zero. At this point if the ductility
capacity is reached to end, the structure will be destroyed.
Structures during the process will bear
additional resistance that aren't considered at the initial design of structure and are known as the
factor of increasing resistance. This factor according to the following formula is, corresponding
force with the total surrender of structure (Vy), corresponding force with formation of the first
plastic hinge in structure (Vs):
(17)
1 1 R ln 0.62 1052 1 10
1
1
e ln 0.22 2
5
2
12
1
1
e
2 25 . 0 ln 3
4
3
3
1
g ge
gy V V 75 . 0 08 . 0 H T 75 . 0 05 . 0 H T (12)
• For alluvial grounds:
Miranda and Borutor method:
Miranda and Borutor in 1994 summarized developed relationships of a number of researchers,
including Niyomark and Hall, Ridil and Niyomark, and Kravinkler and Nesar. They also expanded
the corresponding equations for rocky grounds, alluvial (alluvial) and soft sand. The formula of
calculating ductility factor in terms of alternation period of structure and location of the building is
as follows:
(11)
For rocky grounds:
(12)
For alluvial grounds:
(13)
For soft soil grounds:
(14)
Tg is the alternation period of Accelerogram dominant.
The main alternation period:
The main alternation perids in steel moment frames, steel plate shear walls and buckling restrained
braced according to the formula of regulations that is below, were calculated.
- For steel moment frames:
(15)
- To frames of steel plate shear walls and buckling restrained braces
(16)
2-4-2- Factor of increasing resistance
(Ω)
The design regulations, structures are designed in such a way that none of them will not exceed the
elastic stage, otherwise the plastic hinge will be formed in them. As a result, the overall hardness of
the structure is reduced, but the structure will be able to resist till the hinges formation caused to
create mechanism and structure hardness conducted toward zero. At this point if the ductility
capacity is reached to end, the structure will be destroyed.
Structures during the process will bear
additional resistance that aren't considered at the initial design of structure and are known as the
factor of increasing resistance. This factor according to the following formula is, corresponding
force with the total surrender of structure (Vy), corresponding force with formation of the first
plastic hinge in structure (Vs):
(17)
1 1 R ln 0.62 1052 1 10
1
1
e ln 0.22 2
5
2
12
1
1
e
2 25 . 0 ln 3
4
3
3
1
g ge
gs y V V 75 . 0 08 . 0 H T 75 . 0 05 . 0 H T (13)
• For soft soil grounds:
Miranda and Borutor method:
Miranda and Borutor in 1994 summarized developed relationships of a number of researchers,
including Niyomark and Hall, Ridil and Niyomark, and Kravinkler and Nesar. They also expanded
the corresponding equations for rocky grounds, alluvial (alluvial) and soft sand. The formula of
calculating ductility factor in terms of alternation period of structure and location of the building is
as follows:
(11)
For rocky grounds:
(12)
For alluvial grounds:
(13)
For soft soil grounds:
(14)
Tg is the alternation period of Accelerogram dominant.
The main alternation period:
The main alternation perids in steel moment frames, steel plate shear walls and buckling restrained
braced according to the formula of regulations that is below, were calculated.
- For steel moment frames:
(15)
- To frames of steel plate shear walls and buckling restrained braces
(16)
2-4-2- Factor of increasing resistance
(Ω)
The design regulations, structures are designed in such a way that none of them will not exceed the
elastic stage, otherwise the plastic hinge will be formed in them. As a result, the overall hardness of
the structure is reduced, but the structure will be able to resist till the hinges formation caused to
create mechanism and structure hardness conducted toward zero. At this point if the ductility
capacity is reached to end, the structure will be destroyed.
Structures during the process will bear
additional resistance that aren't considered at the initial design of structure and are known as the
factor of increasing resistance. This factor according to the following formula is, corresponding
force with the total surrender of structure (Vy), corresponding force with formation of the first
plastic hinge in structure (Vs):
(17)
1 1 R ln 0.62 1052 1 10
1
1
e ln 0.22 2
5
2
12
1
1
e
2 25 . 0 ln 3
4
3
3
1
g ge
gs y V V 75 . 0 08 . 0 H T 75 . 0 05 . 0 H T (14)
where: Tg– is the alternation period of accele-rogram dominant.
The main alternation period. The main alternation periods in steel moment frames, steel plate shear walls and buckling restrained braced according to the formula of regulations that is below, were calculated. For steel moment frames:
Miranda and Borutor method:
Miranda and Borutor in 1994 summarized developed relationships of a number of researchers,
including Niyomark and Hall, Ridil and Niyomark, and Kravinkler and Nesar. They also expanded
the corresponding equations for rocky grounds, alluvial (alluvial) and soft sand. The formula of
calculating ductility factor in terms of alternation period of structure and location of the building is
as follows:
(11)
For rocky grounds:
(12)
For alluvial grounds:
(13)
For soft soil grounds:
(14)
Tg is the alternation period of Accelerogram dominant.
The main alternation period:
The main alternation perids in steel moment frames, steel plate shear walls and buckling restrained
braced according to the formula of regulations that is below, were calculated.
- For steel moment frames:
(15)
- To frames of steel plate shear walls and buckling restrained braces
(16)
2-4-2- Factor of increasing resistance
(Ω)
The design regulations, structures are designed in such a way that none of them will not exceed the
elastic stage, otherwise the plastic hinge will be formed in them. As a result, the overall hardness of
the structure is reduced, but the structure will be able to resist till the hinges formation caused to
create mechanism and structure hardness conducted toward zero. At this point if the ductility
capacity is reached to end, the structure will be destroyed.
Structures during the process will bear
additional resistance that aren't considered at the initial design of structure and are known as the
factor of increasing resistance. This factor according to the following formula is, corresponding
force with the total surrender of structure (Vy), corresponding force with formation of the first
plastic hinge in structure (Vs):
(17)
1 1 R ln 0.62 1052 1 10
1
1
e ln 0.22 2
5
2
12
1
1
e
2 25 . 0 ln 34
3
3
1
g ge
gs y V V 75 . 0 08 . 0 H T 75 . 0 05 . 0 H
T (15)
To frames of steel plate shear walls and buckling restrained braces:
Miranda and Borutor method:
Miranda and Borutor in 1994 summarized developed relationships of a number of researchers,
including Niyomark and Hall, Ridil and Niyomark, and Kravinkler and Nesar. They also expanded
the corresponding equations for rocky grounds, alluvial (alluvial) and soft sand. The formula of
calculating ductility factor in terms of alternation period of structure and location of the building is
as follows:
(11)
For rocky grounds:
(12)
For alluvial grounds:
(13)
For soft soil grounds:
(14)
Tg is the alternation period of Accelerogram dominant.
The main alternation period:
The main alternation perids in steel moment frames, steel plate shear walls and buckling restrained
braced according to the formula of regulations that is below, were calculated.
- For steel moment frames:
(15)
- To frames of steel plate shear walls and buckling restrained braces
(16)
2-4-2- Factor of increasing resistance
(Ω)
The design regulations, structures are designed in such a way that none of them will not exceed the
elastic stage, otherwise the plastic hinge will be formed in them. As a result, the overall hardness of
the structure is reduced, but the structure will be able to resist till the hinges formation caused to
create mechanism and structure hardness conducted toward zero. At this point if the ductility
capacity is reached to end, the structure will be destroyed.
Structures during the process will bear
additional resistance that aren't considered at the initial design of structure and are known as the
factor of increasing resistance. This factor according to the following formula is, corresponding
force with the total surrender of structure (Vy), corresponding force with formation of the first
plastic hinge in structure (Vs):
(17)
1 1 R ln 0.62 1052 1 10
1
1
e ln 0.22 2
5
2
12
1
1
e
2 25 . 0 ln 34
3
3
1
g ge
gs y V V 75 . 0 08 . 0 H T 75 . 0 05 . 0 H T (16)
Factor of increasing resistance
The design regulations, structures are de-signed in such a way that none of them exceeds the elastic stage, otherwise the plastic hinge will be formed in them. As a result, the overall hard-ness of the structure is reduced, but the structure will be able to resist till the hinges formation caused to create mechanism and structure hard-ness conducted toward zero. At this point if the ductility capacity is reached to end, the structure will be destroyed. Structures during the process will bear additional resistance that are not con-sidered at the initial design of structure and are known as the factor of increasing resistance. This factor, according to the following formula is, cor-responding force with the total surrender of struc-ture (Vy), corresponding force with formation of the first plastic hinge in structure (Vs):
s y V V = Ω (17)
The factor of increasing resistance is in-dicative of several factors. One of them is the degree of structure uncertainty that provides the possibility of members’ internal forces playback in case of losing resistance to other members. The more uncertain the structure, the higher the value of factor. Strain hardening is also a factor that causes an increase in resis-tance after surrender of members and thus in-creases the resistance of the whole structures. Resistances of the above defined limit of con-sumed materials are another reasons that in laboratory research cause to increase this factor.
Allowable stress factor
This factor, according to the regulations deal-ing with design stresses (allowable load or end load) is determined and its value is the ratio of force in the formation of the first plastic hinge (Vs), to force the allowable stresses (Vw). In the ATC-19 (Bortur and Witaker) based on earth-quake-resistant frames, the values are expressed for allowable stress factor in Table 1.
Table 1. Proposed allowable stress factor ATC-19
(Bortur and Witaker)
Allowable stress factor (Y) The number of frame openings
5
THE EXPERIMENTAL MODEL OF
CAMEROON BLACK FOR BUCKLING
RESTRAINED BRACE
To validate the finite element model of buck-ling restrained brace, the test sample 1-99 Cam-eroon Black was selected as it was also tested at the University of California, Berkeley [8]. The selected profile of the sample model was used. In Figure 3 and 4 respectively, you can observe a view of test sample and the details of the test sample 1-99.
The above-mentioned sample based on
near-fieldsampleloadingof SACregulations present-ed inFigure 5has beentested.
LABORATORY MODEL
FOR
STEEL PLATE
SHEAR WALL
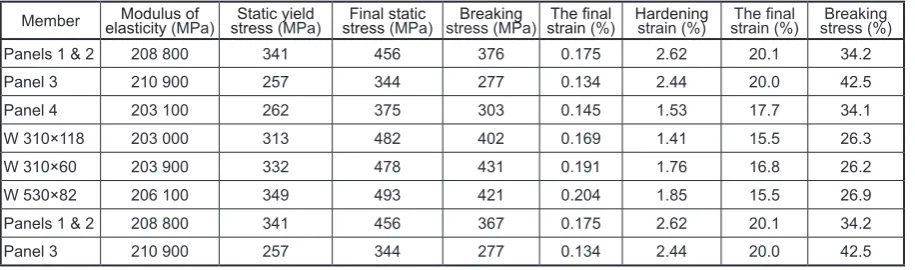
Draiver et al. [10], tested one sample of
4-floorssteel plate shear wallwithlarge-scale ac-cording to Figure 6. After modeling it has been under Pushover analysis [9, 10]. In the sample modeling, thespecificationsprovided inTable 2, according to the researchers, were used. Figure7
shows a hysteresis curve obtained for the men-tioned testsampleandalsodetermined load from
finite elementanalysisby theresearchers.
THE
CHARACTERISTICS OF
FINITE
ELEMENT MODEL
Geometryandprimary conditions
To createfinite elementmodelsof steel plate shear wallandbuckling restrainedbrace,the used characteristics in laboratory work of Draiver et al. andCameroonBlackandcolleagues are used.
Theresults of finite elementanalysiswere
com-Fig. 3. Buckling restrained braced test sample
at UC Berkeley [8]
Fig. 4. Details of test sample 1-99 UC Berkeley [8]
6
pared with test results. In the analytical models,
the movingof framesin thedirection of perpen-dicular to the plate has been blocked. Buckling restrainedbracedgeometricmodelinAbaqus pro-gram can be observed in the Figures 8a and 8b.
Geometry of 4 floors steel plate shear walls
withfinite elementmeshing is shown inFigure 9.
Thebordermembers as well as thesteel plate shear walls thickness of 4 floorswith perforated platesis similar tosteel plate shear wall sample of the designed4-floors witha minimum application thickness of3mm that the holeswith a diameter of60 cmby100 cmcenterdistanceiscreated in them. The full finite element model of 4-floors
steel plate shear wall with perforatedplates can be seen inFigure 10.
Intheprogramof Abaquswhen a page placed underperpendicular load to theedge ofits shell, if the loadis appliedwithouteccentricityorplate
is completely flatandwithoutdefect,nobuckling
creates in it. Therefore,after analyzingthe buck-ling,the sample of buckling restrainedbrace un-der presented loadinginFigure 5, thefirstmodel
Fig. 7. Hysteresis curve of test and Pushover obtained of finite element analysis of Draiver et al. [11]
Fig. 6. Test sample of 4 floors [9]
Table 2. Test sample materials characteristics of Draive and colleges 1997
Breaking stress (%) The final
strain (%)
Hardening
strain (%)
The final strain (%)
Breaking
stress (MPa)
Final static stress (MPa)
Static yield stress (MPa)
Modulus of elasticity (MPa) Member
34.2 20.1
2.62 0.175
376 456
341 208 800
Panels 1 & 2
42.5 20.0
2.44 0.134
277 344
257 210 900
Panel 3
34.1 17.7
1.53 0.145
303 375
262 203 100
Panel 4
26.3 15.5
1.41 0.169
402 482
313 203 000
W 310×118
26.2 16.8
1.76 0.191
431 478
332 203 900
W 310×60
26.9 15.5
1.85 0.204
421 493
349 206 100
W 530×82
34.2 20.1
2.62 0.175
367 456
341 208 800
Panels 1 & 2
42.5 20.0
2.44 0.134
277 344
257 210 900
7
of buckling is used in order to introduce thebuck-ling to theprogram.
There were also someprimary defectsin the pages ofalltest samplesof steel plate shear walls,
whose defectsare created with different reasons such as welding operations of filler plates to beams andcolumns,floor beams moment defor -mationsandeccentricityof the connectingropes.
Thesedefectscanhave asignificant impacton the behavior ofsteel plates.
So the primary defects of filler plate were considered in finite element model. Primary de
-fect pattern for filler plate is considered according
to the loaded shear wall buckling modes with the same procedure that was used in the related test. In this way by analyzing the buckling, buckling modes with a range of w2 (w is the thickness of page) were selected as primary defects. In
buck-ling restrained brace for primary defect defini
-tion, the first model of buckling was used.
In the steel plate shear walls, beams, columns
and filler plates are modeled and in buckling re -strained brace of central steel (steel core and hardenings of elastic area) using 4-node shell ele-ments with a double curve and reduced integral
(ABAQUS element S4R) are modeled. Concrete
and braced steel sheath is modeled as SOLID. S4R element calculates axial shell strains and great rotations. The elements in each point have six degrees of freedom. In the main coordinate system, three degrees of transitional freedom (ux, uy, uz) and three degrees of rotation freedom (θx,
θy, θz) are defined. S4R element is based on an
ISO parametric formula. In order to form the in-ternal force vector is used a point integral on the middle level of the element.
In this study the reduced integral elements are used, because they offer more accurate results, and if the elements are not locally deformed, largely runtime will reduce. Element size is
se-lected by investigating the mesh refining. For
modeling of the separated material between the steel core and the surrounding concrete, a con-tact is used with very low friction tangential fac-tor (about 0.001) due to the role of the material that its main task is the prevention of shear force transmission between the core and concrete. As Fig. 8. a) Finite element model of test sample with sheath; b) Steel core of finite element model the test samples
Fig. 9. Geometry and finite element model meshing of a 4-floors sample, Driver and colleges (1997)
a) b)
Fig. 10. Finite element model of 4-floors steel plate
8
well as for transmission of force from core to the sheath surrounding it A hard contact is also intro-duced therein. The empty space between the core and bracing, due to expanding core in pressure for it, is considered here as a distance of 3 mm in line with core width and 5 mm in line with thickness of the core has been used.
Material characteristics
The stress responses against determined strain, stretching tests of coupon as well as the standard of Von Mises are used. To determine the plastic strain increase, also the current law was used. In all analyzes of uniform Pushovar, a non-linear model, isotopic and harden are used. This model is suitable for uniform loading. In alterna-tion loading of quasi-static and earthquake load-ing that contain a lot of tension and shear actions, Bauschinger impact is important. Therefore, in the analysis of the two types of loading, the
kine-matic hardening law was used. Concrete and steel
sheath collection in buckling restrained brace sample is modeled as elastic and plastic behavior
for them is not defined. For the rest of the ele -ments of buckling restrained brace, elastic behav-ior is considered.
VALIDATE THE FINITE ELEMENT MODELS
WITH LABORATORY RESULTS
In Figure 11, load-displacement graph ob-tained of the testing and analysis of Cameroon Black et al. and finite element analysis (FEM) was shown. In Figure 12, load-displacement graph obtained of the testing of Draiver et al. and FEM analysis was presented. It can be seen that the obtained results of presented finite element
models in this paper are in good accordance with the results of laboratory samples.
RESULTS OF FEM ANALYSIS
Pushover graphs with two leaner graphs of 4-floors steel moment frame (MF-4), 4-floor steel plate shear walls with a thickness of 1 mm (SPSW-4 – 1 mm), 4-floors steel plate shear wall with perforated pages (SPSW-4 – perforated), 4-floors steel plate shear wall with a minimum application thickness of 3 mm (SPSW-4 – 3 mm) and 4-floor buckling restrained brace (BRB-4) are shown in the Figures of 13 to 17.
After determining the relative displacement of surrender from the two linear graphs and de-termining the ductility factor of the formula (2), ductility reducing factor is determined with Niyo-mark and Hall method. To calculate the factor of resistance increase according to formula (17), it is assumed that the forming location of the first plastic hinge is the moment of separation of real curves and two linear after the elastic area (start yielding) or the first point their contact. The al-lowable stress factor value according to Table 1 for all samples is assumed as 1. Finally, using for-mula (1), the behavior factor is calculated. The mentioned parameters in Table 3 are provided.
Fig. 11. The force curve – axial displacement of brac-ing in the testbrac-ing mode and finite element analysis
9
The ultimate strength value (Fu), the effectiveelastic hardness (Kel), the effective elastic hard-ness (Kvgl), hardening factor (a) were determined from two liners graphs and are presented in Table 4. In order to better understanding the obtained
val-Fig. 17. base shear force graph versus first floor dis -placement of 4-floors buckling restrained brace
Fig. 13. base shear force graph versus first floor dis
-placement of 4-floors steel moment frame displacement of Fig. 14. base shear force graph versus 4-floors Steel Plate Shear Walls with first floor a thickness of 1 mm
Fig. 15. base shear force graph versus first floor
displacement of 4-floors Steel Plate Shear Walls with perforated pages
Fig. 16. base shear force graph versus first floor
displacement of 4-floors Steel Plate Shear Walls with a thickness of 3 mm
ues, load curves related to frames of 4 floors for the corresponding system is shown in Figure 18. The behavior factor values and ductility factor of the corresponding system were compared in Fig-ure 19. In terms of ultimate resistance the system was compared in Figure 20.
CONCLUSIONS
The provided numbers in the tables and
ob-tained curves from finite element analysis, the
following conclusions can be reached:
Ultimate resistance of steel plate shear
ap-10
Fig. 18.load-displacement graph of 4-floors frames with different systems
Fig. 20. the ultimate resistance in 4-floors frames of Steel Plate Shear Walls (SPSW), buckling restrained brace (BRB) and moment frame (MF)
11
plication thickness is more than the bucklingrestrained brace and moment frame. So the energy dissipation of this system is more in earthquake.
Factor of resistance increase in the system of buckling restrained brace is more than a system of steel plate shear wall that the ratio of yield re-sistance to corresponding rere-sistance is with the first plastic hinge formation. In other words, the safety margin of using steel plate shear walls is more similar to the system of BRBs and in terms of design, the system is more reliable.
Behavior factor of steel plate shear wall sys-tems, even with a thickness of fewer plates from the minimum application thickness, is more re-strained than buckling braced systems and mo-ment frame. So the basic sheer level in structure design with steel shear wall system is less than buckling restrained brace system and moment frame. So the structure design with steel plate shear wall system would be more economic.
Given that in the short and medium build-ings, the required thickness to design is less than the minimum application thickness of 3 mm, use of steel plate shear walls with solid plates are more suitable for high-rise buildings and, since the beam and columns must be able to develop the created stretch on the plate, use it with a min-imum application thickness in the short and me-dium buildings will cause to increase the beam and column points.
A suitable solution is the use of steel plate shear wall with perforated plates that here 4 floors steel plate shear wall with a thickness of
3 mm and perforated plates is analyzed with a regular pattern and the results show, however, that hardness and ultimate resistance of this system is less than steel plate shear wall with solid plates, but its ductility and behavior fac-tor is slightly lower and for the development of the created stretch area in the plate need to lighter points than solid state. In addition, present the openings is considered an advan-tage to the solid plates. The results showed that the hardness and ultimate resistance, ductility and behavior factors of such a steel plate shear walls are higher than BRBs system.
REFERENCES
1. Thorburn L.J., Kulak G.L. and Montgomery C.J.
Analysis of steel plate shear walls. Structural
En-gineering Report No. 107, Dept. of Civil Engineer
-ing, University of Alberta, Edmonton, AB. 1983. 2. Roberts T.M. and Sabouri-Ghomi S. Hysteretic
char-acteristics of unstiffened perforated steel plate shear panels. Thin Walled Structures, 14, 1992, 139–151. 3. Wada A., Connor J., Kawai H., Iwata M. and Wata
-nabe A. Damage tolerant structure. Proceedings of Fifth us Japan Workshop on the Improvement of
Building Structural Design and Construction Prac
-tices, Redwood City, California, 1992, 27–39.
4. Sabelli R. and Aiken I. U.S. building-code provi -sions for buckling restrained braced frames, basis and development. In: Proceedings of the 13th World Conference on Earthquake Engineering, Vancou
-ver, B.C., Canada, Paper No. 1828, 2004.
5. Bhowmick A.K. Seismic analysis and design of steel plate shear walls. A thesis submitted to the
Table 3. Obtained behavior factor parameters of finite element analysis
R Y
Ω Rµ
µ T(s)
Samples
4.85 1
1.47 3.3
4.71 0.616
MF-4
6.58 1
1.53 4.3
9.60 0.385
SPSW-4 – 1 mm
7.20 1
1.60 4.5
10.60 0.385
SPSW-4 – perforated
7.33 1
1.56 4.7
11.34 0.385
SPSW-4 – 3 mm
6.01 1
1.67 3.6
6.93 0.385
BRB-4
Table 4. Obtained hardness and resistance parameters of finite element analysis
Fu (KN) Fy (KN)
Δy (mm)
α (%) Kinel (KN/mm)
Kel (KN/mm)
Samples
2187.91 1651.94
40.40 8.75
3.58 40.93
MF-4
3858.77 2973.58
19.83 3.47
5.20 159.00
SPSW-4 – 1 mm
4808.29 4088.77
17.98 1.85
4.21 227.24
SPSW-4 – perforated
6984.62 5666.18
16.75 2.25
7.61 338.20
SPSW-4 – 3 mm
4351.83 3512.30
27.42 4.03
5.16 128.12
12
Faculty of Graduate Studies and Research in
par-tial fulfillment of the requirements for the degree
of Doctor of Philosophy in Structural Engineering,
Department of Civil and Environmental Engineer
-ing, Edmonton, Alberta. 2009.
6. Zahraiy-Eftekhari M. Determine the slimy damp-ing factor equal braced frames with brace BRB based on nonlinear static analysis (Pushover).
Teh-ran University, 2006.
7. Uang C.M. Establishing R (or Rw) and Cd
fac-tors for building seismic provisions. Journal of
Structural Engineering, ASCE, 117(1), 1991,
19–28.
8. Black C., Makris N. and Aiken I. Component
testing, stabillity analysis and characterization of
buckling restrained braces. Final Report to Nippon
Steel Corporation, 2002.
9. Driver R.G., Kulak G.L., Kennedy D.J.L. and Elwi A.E. Seismic behaviour of steel plate shear walls. Structural Engineering Report No. 215, 44 Dept. of
Civil and Environmental Engineering, University of Alberta, Edmonton, AB. 1997.
10. Driver R.G., Kulak G.L., Kennedy D.J.L. and Elwi
A.E. Cyclic test of four storey steel plate shear wall. Journal of Structural Engineering, ASCE,
124(2), 1998, 112–120.
11. Driver R.G., Kulak G.L., Elwi A.E. and Kennedy
D.J.L. FE and Simplified models of steel plate
shear wall. Journal of Structural Engineering,

![Fig. 4. Details of test sample 1-99 UC Berkeley [8]](https://thumb-us.123doks.com/thumbv2/123dok_us/8808943.1776127/5.595.75.285.464.745/fig-details-test-sample-uc-berkeley.webp)