Systems/Circuits
Asymmetries in Global Perception Are Represented in
Near- versus Far-Preferring Clusters in Human Visual Cortex
X
Shahin Nasr and Roger B.H. Tootell
Athinoula A. Martinos Center for Biomedical Imaging, Massachusetts General Hospital, Charlestown, Massachusetts 02129, and Department of Radiology, Harvard Medical School, Boston, Massachusetts 02115
Human perception is more “global” when stimuli are viewed within the lower (rather than the upper) visual field. This phenomenon is
typically considered as a 2-D phenomenon, likely due to differential neural processing within dorsal versus ventral cortical areas that
represent lower versus upper visual fields, respectively. Here we test a novel hypothesis that this vertical asymmetry in global processing
is a 3-D phenomenon associated with (1) higher ecological relevance of low-spatial frequency (SF) components in encoding near
(com-pared with far) visual objects and (2) the fact that near objects are more frequently found in lower rather than upper visual fields. Using
high-resolution fMRI, collected within an ultra-high-field (7 T) scanner, we found that the extent of vertical asymmetry in global visual
processing in human subjects (
n
⫽
10) was correlated with the fMRI response evoked by disparity-varying stimuli in human cortical area
V3A. We also found that near-preferring clusters in V3A, located within stereoselective cortical columns, responded more selectively than
far-preferring clusters, to low-SF features. These findings support the hypothesis that vertical asymmetry in global processing is a 3-D
(not a 2-D) phenomenon, associated with the function of the stereoselective columns within visual cortex, especially those located within
visual area V3A.
Key words:
cortical columns; high-resolution fMRI; spatial frequency encoding; statistics of natural scenes; stereoselectivity
Introduction
Humans perceive visual stimuli more “globally” (as opposed to
“locally”) when stimuli are presented within the lower visual field
(LVF) compared with the upper visual field (UVF;
Previc, 1990
;
Christman, 1993
;
Levine and McAnany, 2005
). This vertical
asymmetry is (at least partly) due to relatively higher sensitivity to
lower spatial frequency (SF) components [
ⱕ
1.0 cycles per degree
(c/deg)], which are important for global processing (
Shulman et
al., 1986
;
Shulman and Wilson, 1987
;
LaGasse, 1993
;
Robertson
et al., 1993
;
Flevaris et al., 2010
), in LVF compared with UVF
(
Skrandies, 1987
;
Niebauer and Christman, 1998
;
Thomas and
Elias, 2011
). Although this asymmetry has been known for
de-cades, its underlying neural mechanisms remain little known
(
Liu et al., 2006
), partly due to technical challenges identifying
the small (and spatially restricted) low- and higher-SF preferring
sites within visual cortex (
Tootell and Nasr, 2017
). Such
fine-scale structures may not be directly resolved using conventional
neuroimaging techniques in humans.
Recently, by taking advantage of high-resolution fMRI, we
showed that low-SF (
ⱕ
0.3 c/deg) and higher SF-preferring
clus-ters in humans are localized within thick- and thin-type columns
(respectively) across areas V2, V3, and V3A (
Tootell and Nasr,
2017
). These thin- and thick-type columns were localized based
on their stereoselectivity and color selectivity, respectively. Their
Received Sept. 2, 2019; revised Nov. 4, 2019; accepted Nov. 5, 2019.Author contributions: S.N. and R.B.H.T. designed research; S.N. and R.B.H.T. performed research; S.N. contributed unpublished reagents/analytic tools; S.N. analyzed data; S.N. and R.B.H.T. wrote the paper.
This work was supported in part by National Institutes of Health/National Eye Institute Grant RO1-EY-026881 and by the Massachusetts General Hospital/Harvard-Massachusetts Institute of Technology Division of Health Sciences & Technology Athinoula A. Martinos Center for Biomedical Imaging; and was made possible by resources provided by National Institutes of Health Shared Instrumentation Grant S10-RR-019371. We thank Prof. Wim Vanduffel for review and comments on this manuscript.
The authors declare no competing financial interests.
Correspondence should be addressed to Shahin Nasr at [email protected]. https://doi.org/10.1523/JNEUROSCI.2124-19.2019
Copyright © 2020 Nasr and Tootell
This is an open-access article distributed under the terms of the Creative Commons Attribution License Creative Commons Attribution 4.0 International, which permits unrestricted use, distribution and reproduction in any medium provided that the original work is properly attributed.
Significance Statement
columnar (radial) organization was shown based on (1)
similar-ity between the activsimilar-ity patterns evoked across cortical layers and
(2) comparison of the level of correlation across versus within
layers (
Nasr et al., 2016
;
Nasr and Tootell, 2018
). The existence of
these columns and their differential sensitivity to additional
func-tional properties are consistent with findings based on invasive
techniques in nonhuman primates (NHPs; for review, see
Tootell
and Nasr, 2017
).
Here, we hypothesized that vertically asymmetric global
pro-cessing is reflected in the activity evoked within stereoselective
columns that represent LVF versus UVF across visual cortical
areas. Since V3A showed a stronger low-SF selectivity compared
with V2 and V3 (
Gaska et al., 1988
;
Tootell and Nasr, 2017
), we
also expected a stronger link between the level of vertical
asym-metry in global processing (i.e., behavior) and neural processing
within V3A, compared with that in earlier visual areas.
An extension of this hypothesis is that this vertical asymmetry
may be a 3-D (not 2-D) phenomenon, reflecting a hypothetically
higher ecological relevance of low SFs in visual encoding within
near, compared with far, space. This hypothesis is supported by
several considerations. First, in real-life vision, near objects are
more frequently located within the LVF compared with the UVF
(
Yang and Purves, 2003
). Second, the perception of near
(com-pared with far) objects may rely more on low-SF features likely
due to spatial blurring—visual features emphasizing
luminance-graded (e.g., low-SF) borders are generally perceived as nearer
compared with those in which higher-SF features are relatively
enhanced (
Marshall et al., 1996
;
Mather and Smith, 2000
;
Sprague et al., 2016
).
Our experiments specifically tested whether the asymmetry in
global visual processing is reflected as a differential sensitivity to
low-SF stimuli evoked within near- versus far-preferring clusters,
distributed within stereoselective columns. Although NHP (
Ad-ams and Zeki, 2001
;
Tanabe et al., 2005
;
Chen et al., 2008
) and
human (
Nasr and Tootell, 2018
) studies reported that near-
com-pared with far-preferring neurons are more frequently found in
the cortical representation of the LVF compared with the UVF, to
our knowledge, no previous study has compared the sensitivity of
near- versus far-preferring neural clusters, in any visual area, at
low SFs.
We scanned 10 human subjects using high-resolution fMRI.
The results confirmed an association between vertical asymmetry
in global processing and the response evoked by depth-varying
stimuli within human V3A—a cortical area heavily involved in
stereovision (
Tsao et al., 2003
;
Neri et al., 2004
;
Goncalves et al.,
2015
;
Tootell and Nasr, 2017
). In subsequent experiments, we
showed a higher sensitivity to low-SF features in near- compared
with far-preferring clusters. These findings suggest that the
ver-tical asymmetry in global visual processing is a 3-D phenomenon,
associated with differential low-SF sensitivity of near- versus
far-preferring clusters.
Materials and Methods
Participants
Eighteen human subjects (9 female), 22– 40 years of age, participated in the behavioral test (Experiment 1). Ten of 19 subjects (5 female) were selected (regardless of their behavioral performance) to participate in the subsequent imaging test (Experiment 2). Among them, eight subjects (four female), also agreed to participate in Experiments 3 and 4. All subjects had normal or corrected-to-normal vision and radiologically normal brains, without any history of neuropsychological disorder. All experimental procedures conformed to NIH guidelines and were ap-proved by Massachusetts General Hospital protocols. Written informed consent was obtained from all subjects before the experiments.
General procedures
Each subject was scanned multiple times (on different days) in a Siemens 7 T scanner (Siemens Healthcare) to localize the stereoselective thick-type columns (Nasr et al., 2016) and near- and far-preferring clusters within them (two sessions), and also to localize color-selective thin-type columns (one session;Nasr et al., 2016). Eight of 10 subjects also partic-ipated in additional scan sessions to measure sensitivity to 2-D spatial frequency (two sessions) and 3-D spatial configuration (one session) within their near- and far-preferring clusters. All 10 subjects were also scanned in a 3 T scanner (TIM Trio, Siemens Healthcare) in one addi-tional session, for structural and retinotopic mapping (one session).
Visual stimuli
During the behavioral test outside the scanner, stimuli were presented via an LCD monitor, positioned 57 cm in front of the viewers. Subjects were instructed to position their chins on a chin rest to fix their head position relative to the monitor.
Inside the scanner, stimuli were presented via a projector (1024⫻768 pixel resolution, 60 Hz refresh rate) onto a rear-projection screen, viewed through a mirror mounted on the receive coil array. In MATLAB 2018a (MathWorks), The Psychophysics Toolbox (Brainard, 1997;Pelli, 1997) was used to control stimulus presentation.
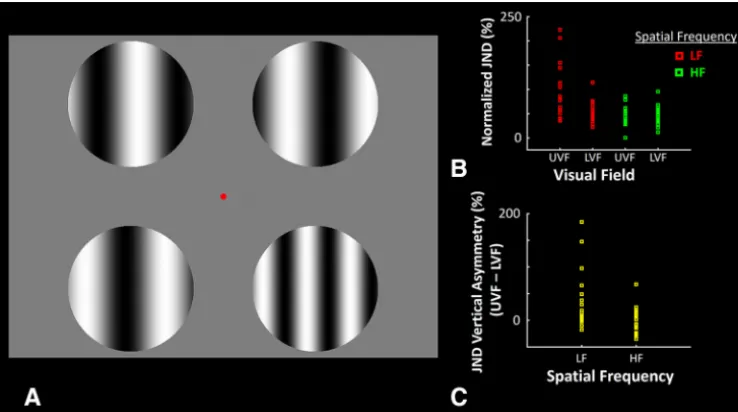
Experiment 1.Outside the scanner, we measured each subjects’ thresh-old as a “just noticeable difference” (JND) in detecting a small change in SF in the upper versus lower hemifields. In each trial, subjects were presented simultaneously with four gratings of either low (0.3 c/deg) or higher (3.0 c/deg) SF with different phase values, plus a small fixation target (0.1°⫻0.1°) presented at the center of screen (Fig. 1). Each grating was presented within a circular aperture (r⫽3.9°), positioned in one corner of screen, with a center-to-center distance of 11.4° between adja-cent apertures. Gratings were presented only for a short time (100 ms), remained without any change (i.e., statically) within the trial, then were followed by presentation of a spatially uniform gray screen.
Before the onset of each trial, one of the four target locations was chosen randomly (25% chance), and the SF of the grating in that location was changed (i.e., increased or decreased) slightly relative to the SF in the other three apertures. The level of this change (⌬SF) was controlled using a staircase method (Pelli, 1997) to adjust each subject’s response accuracy toward 75%. This adjustment was made between trials, independently for low versus higher SFs and for LVF versus UVF (i.e., 2⫻2 design). Subjects were instructed to report the hemifield (upper vs lower) in which the SF of the grating differed from the others by pressing a key on the keypad, in a two-alternative forced choice (2AFC) procedure. The subsequent trial began with a delay (1.5⫾0.5 s) following a subject’s response. This procedure increased the overall efficiency (compared with testing left and right hemifields separately). Moreover, use of the spatially balanced design, plus the short stimulus presentation time (100 ms), likely helps to control eye movement stability, compared with testing stimulus locations in isolation. Each subject participated in 50 trials per condition (i.e., 200 trials in total). Accuracy was stressed more than speed.
Experiment 2.In different blocks, subjects were presented with ran-dom dot stereogram (RDS;Julesz, 1971) stimuli, extending 20°⫻20° in the visual field. These stimuli formed a stereoscopic percept of a regular array of depth-based cuboids that varied sinusoidally either in front (near; 0°– 0.22°) or behind (far;⫺0.22°– 0°) the fixation spot with inde-pendent phase, similar to stimuli described earlier (Tsao et al., 2003;Neri et al., 2004;Bridge and Parker, 2007;Minini et al., 2010;Nasr and Tootell, 2018). In the control condition, the fused percept formed a 2-D fronto-parallel plane intersecting the fixation target (i.e., zero depth at that point). Subjects viewed the stimuli through custom anaglyph spectacles using Kodak Wratten filters No. 25 (red) and No. 44A (cyan). Each run consisted of nine blocks of 24 s each, showing one of the three possible stimulus conditions (i.e., three repetitions for each condition). The se-quence of blocks was randomized. Each run began and ended with an additional block (12 s) showing a spatially uniform (“blank”) achromatic field. Each subject participated in 12 runs per session, during which 960 functional volumes were collected (for more details, see Nasr and Tootell, 2018).
Experiment 3.In a block design experiment, subjects were presented with gratings of differing SFs (0.1, 0.27, 0.73, 2.08, and 5.79 c/deg) and achromatic contrasts (1.43%, 5.25%, 15.95%, 50.14%, and 99. 62%) across different blocks, in a 5⫻5 design (i.e., 25 different experimental conditions), extending 20°⫻20° in the visual field. In each block, grating orientation and phase changed every 4 and 1 s, respectively. Each run consisted of 15 blocks of 16 s each, showing 1 of the 25 possible stimulus conditions without any repetition within the run. Each run began and ended with an additional block (12 s) of uniform gray of equivalent mean luminance. During these runs, subjects were required to do a color change detection for a very small, centrally located fixation spot whose color varied between dark versus light green every few seconds (1.5⫾ 0.5 s). Each subject participated in two scan sessions, with 12 runs (1056 functional volumes) per session.
Experiment 4.Stimuli were 3-D checkerboards, generated based on sparse (5%) RDS. Across different blocks, check size was varied, forming different 3-D cubic arrangements (3⫻4, 6⫻8, 12⫻16, and 24⫻32). Within each block, the level of disparity varied between 0.22° and⫺0.22° and stimuli extended 20°⫻20° in the visual field. In the control condi-tion, presented within separate blocks, the RDS stimuli formed a uniform (1⫻1) 2-D frontoparallel plane intersecting the fixation target (i.e., zero depth at that point; i.e., five experimental conditions in total). Each experimental run included 10 blocks (24 s/block), plus 12 s of uniform blank presentation at the beginning and end of the runs. Each subject participated in 12 runs per session, during which 1248 functional vol-umes were collected. During these runs, subjects were required to do a shape change detection task for a centrally selected fixation spot, whose shape varied between a circle and a square every seconds few (1.5⫾0.5 s).
Localizer scans.To localize stereoselective columns, subjects were pre-sented with RDS stimuli, extending 20°⫻20° in the visual field. In 50% of blocks, these stimuli formed a stereoscopic percept of a regular array of depth-based cuboids that varied sinusoidally (between 0.22° and 0.22°) relative to the frontoparallel plane that intersected the fixation spot, sim-ilar to a stimulus described earlier (Tsao et al., 2003;Neri et al., 2004; Bridge and Parker, 2007;Minini et al., 2010). Importantly, these stimuli differed from those used in Experiment 2, in which the disparity level ranged between either⫺0.22° to 0° or 0° to⫺0.22° across different blocks. Data from Experiments 2 and 4 were collected during indepen-dent scan sessions.
In the other half of each block, the fused percept formed a 2-D fron-toparallel plane intersecting the fixation target (i.e., zero depth at that
point). Subjects viewed the stimuli through custom anaglyph spectacles using Kodak Wratten filters No. 25 (red) and No. 44A (cyan). Other details, such as the stimuli and the paradigm, have been reported previ-ously (Nasr et al., 2016). The results of Experiment 2 were used to detect and localize near- versus far-preferring clusters within the stereoselective (thick-type) columns (Nasr et al., 2016;Nasr and Tootell, 2018).
To ensure that these stereoselective columns did not overlap with the color-selective columns, we also localized color-selective (thin-type) columns. Briefly, in different blocks, subjects were presented with isolu-minance color-varying and luisolu-minance-varying gratings. All stimuli ex-tended 20°⫻20° in the visual field. Grating stimuli were presented at different orientations (0°, 45°, 90°, or 135°), drifting in orthogonal direc-tions (reversed every 6 s) at 4 deg/s. Vertices that showed overlapping stereoselective and color-selective activity were excluded from our anal-ysis. Other details have been reported previously (Nasr et al., 2016).
Retinotopic mapping.Details of retinotopic mapping have also been reported previously (Nasr et al., 2011). Briefly, stimuli were color- and luminance-varying images of scenes and face mosaics, which were pre-sented within retinotopically limited apertures, against a gray back-ground. The retinotopic apertures included horizontal/vertical meridian (radius, 10°; polar angle, 30°) wedges, upper/lower hemifield (radius, 10°; polar angle, 150°) wedges, a foveal disk (radius, 0°–1.5°), and a peripheral ring (radius, 5°–10°), presented across different blocks. To confirm the borders of retinotopic areas, in two subjects we also pre-sented phase-encoded, contrast-reversing (1 Hz) checkerboards within continuously rotating rays or continuously expanding/contracting ring stimuli, in different runs/experiments. Details of this procedure have been described previously (Sereno et al., 1995).
Imaging
The main MRI experiments were conducted in a 7 T Siemens whole-body scanner equipped with SC72 body gradients (70 mT/m maximum gradi-ent strength and 200 T/m/s maximum slew rate) using a custom-built 32-channel helmet receive coil array, and a birdcage volume transmit coil (Keil et al., 2010). To acquire functional images, we used a single-shot gradient-echo EPI with 1.0 mm isotropic voxels with the following pro-tocol parameter values: TR⫽3000 ms; TE⫽28 ms; flip angle⫽78°; matrix⫽192⫻192; band width (BW)⫽1184 Hz/pixel, echo-spacing⫽ 1 ms; 7/8 phase partial Fourier; FOV⫽192⫻192 mm; 44 oblique-coronal slices; and acceleration factorr⫽4 with GRAPPA (generalized autocalibrating partially parallel acquisitions) reconstruction and FLEET
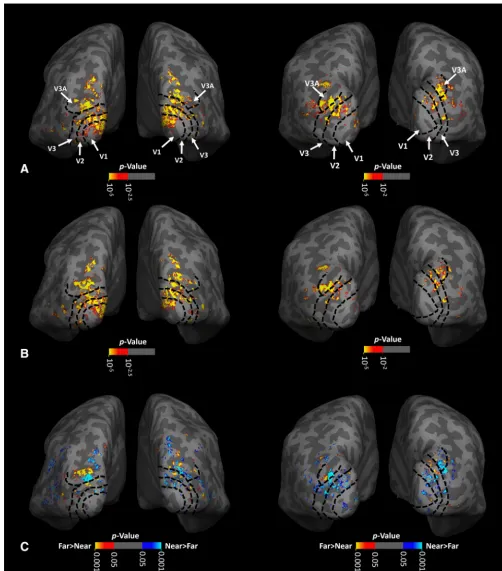
Figure 2. Activity evoked by depth-varying RDS stimuli within the occipital visual cortex of two individual subjects (shown on left and right, respectively), each overlaid on their own inflated brains.A,B, Activity evoked by disparity-varying stimuli ranging between 0° and 0.4° (i.e., near space) and⫺0.4° to 0° (i.e., far space), respectively, all compared with activity evoked by an otherwise equivalent stimuli presented at a constant frontoparallel plane that intersected the fixation spot (i.e., zero depth). Consistent with previous studies in humans at both high (Nasr et al., 2016;Tootell and Nasr, 2017;Nasr and Tootell, 2018) and conventional (Tsao et al., 2003;Neri et al., 2004) fMRI resolution, we found depth-sensitive activity within visual areas V1, V2, V3, and V3A (see Materials and Methods).C, Activity evoked by the more detailed contrast of “far–near”-selective activity, within occipital visual cortex of the same individuals. Near-preferring (blue to cyan) and far-preferring (red to yellow) clusters can also be found in different visual areas. For each subject, the borders of retinotopic visual areas (black dashed lines) are defined based on an independently collected set of retinotopic stimuli and scans.
(fast low-angle excitation echoplanar technique)-ACS (autocalibration signal) data (Polimeni et al., 2016) with a 10° flip angle. The field of view fully covered the occipital cortical areas V1, V2, V3, and V3A (but not always MT).
Retinotopic mapping was conducted using a 3 T Siemens scanner (TIM Trio) and the vendor-supplied 32-channel receive coil array. Func-tional data were acquired using single-shot gradient-echo EPI, with nominally 3.0 mm isotropic voxels using the following protocol param-eters: TR⫽2000 ms; TE⫽30 ms; flip angle⫽90°; matrix⫽64⫻64; BW⫽2298 Hz/pixel; echo-spacing⫽0.5 ms, without partial Fourier, FOV⫽192⫻192 mm; 33 axial slices covering the entire brain; and no acceleration.
Structural (anatomical) data were acquired using a 3-D T1-weighted MPRAGE sequence with the following protocol parameter values: TR⫽ 2530 ms; TE⫽3.39 ms; TI⫽1100 ms; flip angle⫽7°; BW⫽200 Hz/pixel, echo spacing⫽8.2 ms; voxel size⫽1.0⫻1.0⫻1.33 mm3; and
FOV⫽256⫻256⫻170 mm3.
Data analysis
Functional and anatomical MRI data were preprocessed and analyzed using FreeSurfer and FS-FAST (version 6.0;http://surfer.nmr.mgh. harvard.edu/;Fischl, 2012). For each subject, inflated and flattened
cor-tical surfaces were reconstructed based on the high-resolution anatomi-cal data (Dale et al., 1999;Fischl et al., 1999,2002).
All functional images were corrected for motion artifacts. The 3 T functional data, collected for retinotopic mapping, were spatially smoothed (Gaussian filtered with a 5 mm FWHM). However, no spatial smoothing was applied to the main imaging data acquired at 7 T (i.e., 0 mm FWHM). For each subject, functional data from each run were rigidly aligned (6 df) relative to his/her own structural scan, using rigid boundary-based registration (Greve and Fischl, 2009). This procedure enabled us to combine and average data collected for each subject across multiple scan sessions.
A standard hemodynamic model based on a gamma function was fit to the fMRI signal to estimate the amplitude of the BOLD response ( Boyn-ton et al., 1996;Courtney et al., 1997;Dale and Buckner, 1997). For each individual subject, the average BOLD response maps were calculated for each condition (Friston et al., 1999). Finally, voxelwise statistical tests were conducted by computing contrasts based on a univariate general linear model, and the resultant significance maps were projected onto the subject’s anatomical volumes and reconstructed cortical surfaces.
To reduce the impact of pial veins on evoked activity maps (Yacoub et al., 2008;Polimeni et al., 2010; Nasr et al., 2016), brain activity was sampled from the deepest (as opposed to more superficial) cortical lay-ers. Accordingly, for each subject the gray matter–white matter (“deep”) interface was detected based on their own high-resolution structural scans (see above) using FreeSurfer (Dale et al., 1999;Fischl et al., 1999, 2002). To measure the fMRI activity, the percentage fMRI signal change was calculated for those functional voxels that intersected this gray matter–white matter interface, and the resultant values were projected onto the corresponding vertices of the surface mesh.
Region of interest
Borders of regions of interest (ROIs), including V1, V2, V3, and V3A, were defined for each subject based on her/his own retinotopic mapping (see above). Stereoselective columns were localized functionally by con-trasting the activity evoked by disparity-varying RDS that formed 3-D versus 2-D stimuli (Nasr et al., 2016). Near- versus far-preferring clusters within the stereoselective columns were also localized functionally dur-ing a separate set of scans by contrastdur-ing the activity evoked by disparity-varying RDSs that formed near versus far stimuli (Experiment 2;Nasr and Tootell, 2018).
Statistical analysis
Statistical tests were based on repeated-measures ANOVA. When neces-sary (based on the Mauchly’s test), results were corrected for violation of the sphericity assumption, using the Greenhouse–Geisser method. In Experiment 3, to test the reliability of potential effects, a group factor (first vs second scan) was also considered in all ANOVA tests. In an ROI-based analysis, we did not find any difference between activity evoked within left versus right hemispheres. Therefore, data from both hemispheres were averaged together to enhance the signal-to-noise ratio. In all cases, data were tested for normality before choosing the statistical test (p⬍0.05 was considered significant).
To test the association between the evoked fMRI activity and the sub-ject’s behavior (Experiment 2), we used a linear regression model (be-havior⬃1⫹fMRI⫹fMRI⫻cluster type). This analysis enabled us to test whether behavior showed a different type of association with activity evoked within each cluster type (near- vs far-preferring). All resultantp
values were corrected for multiple comparisons (V2 vs V3 vs V3A), using a Bonferroni correction method. Subsequently, to test the significance of differences between the correlations across visual areas (see Results), we used a second linear regression model (behavior⬃1⫹fMRI⫹fMRI⫻ cluster type⫹fMRI⫻area⫹fMRI⫻cluster type⫻area). All statistical analyses were conducted using the MATLAB (2018a) Statistics and Ma-chine Learning Toolbox (MathWorks).
Data availability
Data are available on request from the authors.
Results
Experiment 1: vertical asymmetry for perception of low SF
We conducted psychophysical measurements in 19 participants
to measure the level of vertical asymmetry in global perception,
using stimuli matching those used later during fMRI
experi-ments. A 2AFC procedure was used to measure the JND in
dis-criminating variations in SF, centered at either low (0.3 c/deg) or
higher (3.0 c/deg) SFs (i.e., 100
⫻ ⌬
SF/SF), at 75% response
accuracy (see Materials and Methods). Consistent with previous
studies, subjects showed a higher JND in the UVF compared with
the LVF for discriminating low SFs, but not higher SF gratings
(
Fig. 1
). We applied a two-way repeated-measures ANOVA
[hemifield (LVF vs UVF) and SF (low vs higher)] to the measured
thresholds, which showed significant effects of hemifield (
F
(1,18)⫽
5.26,
p
⫽
0.03), SF (
F
(1,18)⫽
16.22,
p
⬍
10
⫺3), and SF
⫻
hemifield (
F
(1,18)⫽
4.47,
p
⫽
0.04). These results confirmed that
this vertical asymmetry was selective for low-SF stimuli, rather
than a broader response bias.
Experiment 2: is the asymmetry in low-SF processing
associated with activity within near- versus far-preferring
clusters?
Next, we tested whether the level of asymmetric low-SF sensitivity
(measured behaviorally) was associated with the fMRI response
evoked within stereoselective columns (
n
⫽
10). In other words,
we tested whether subjects who show a stronger stereoselective
activity also show a stronger asymmetric low-SF sensitivity.
Fig-ures 2
and
3
show activity evoked by depth-varying stimuli (see
Materials and Methods) within near versus far distances across
V1, V2, V3, and V3A. These maps of near versus far activity were
robust and consistent across the two scan sessions (see Materials
and Methods) in all individuals (
Fig. 4
). A similar consistency
(across sessions) was noted in maps in V2 and V3 (
Nasr et al.,
2016
).
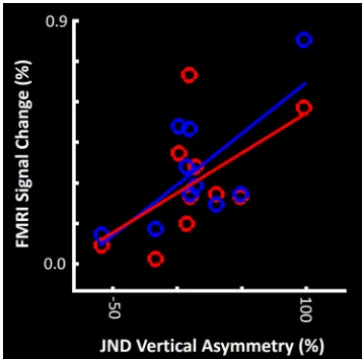
Consistent with our hypothesis, the association between
ver-tical asymmetry in global processing and the function of the
ste-reoselective cortical columns, we found a significant correlation
Figure 4. Reproducibility of a near- versus far-preferring clusters map in V3A across different subjects.A, Similarity between the activity maps evoked by far–near contrast in one individual across the two sessions.B, Correlation between the percentage of fMRI signal change in each V3A vertex, evoked by near versus far contrast during the first versus the second scan sessions in each individual subject. A Pearson test of correlation in data collected from each subject showed a significant (r⬎0.23;p⬍10⫺4) correlation between activity evoked across these two sessions. Since it could be
argued that the potential correlation within/between sessions was complicated by nonindependence of activity in adjacent vertices, we also used a stricter test in which (instead of using all V3A vertices), we randomly selected 10% of vertices, and measured the level of correlation between their activity across the two sessions. These correlation coefficients were compared relative to the chance level, defined as the level of correlation after randomly misaligning (i.e., spatially “shuffling”) V3A vertices between the two sessions. We repeated this test 10,000 times for each subject. In all subjects, we found the probability of finding a correlation coefficient that was less than the correlation coefficient of misaligned vertices (i.e., the null hypothesis) was⬍0.01. These results support the reliability/reproducibility of these activity maps between scan sessions. Data from both hemispheres are combined in these analyses.
between the level of vertical asymmetry in low-SF discrimination
[measured behaviorally as UVF
JND-LVF
JND(Experiment 1)] and
the level of stereoselective fMRI activity evoked within V3A.
Lin-ear regression showed a significantly higher vertical asymmetry in
low-SF discrimination in those subjects who showed a stronger
stereoselective response (

⫽
0.64;
p
⬍
0.01; corrected for
mul-tiple comparison; see below). This association was similar for
activity evoked by “near-zero disparity” and “far-zero disparity”
contrasts, without any significant moderator effect of depth
di-rection (i.e., near vs far,
p
⫽
0.73;
Fig. 5
).
Next, we tested whether this correlation was quantitatively
limited to cortical area V3A, or whether it was evident in
lower-tier cortical areas V2 and V3. In both of those areas, the analysis
used above did not yield any significant correlation between the
subject’s vertical asymmetry and the stereoselective fMRI
re-sponse evoked within stereoselective (thick-type) columns
within V2 (
p
⫽
0.12) or V3 (
p
⫽
0.15). All
p
values were corrected
for multiple comparisons using a Bonferroni correction.
Then, to test whether this difference between correlation
val-ues across areas V2 versus V3 versus V3A was significant, we used
a second regression model in which each visual area was
consid-ered as an independent factor (see Materials and Methods). The
results showed a significant moderator effect of visual area (i.e.,
behavior
⬃
1
⫹
fMRI
⫻
area;

⫽
0.45;
p
⬍
10
⫺3). Thus, vertical
asymmetry in the low-SF JNDs was more directly associated with
activity evoked within V3A, compared with earlier visual areas V2
and V3.
Experiment 3: SF preference in near- versus far-preferring
clusters based on 2-D stimuli
The results of Experiments 1 and 2 suggest that at least one aspect
of vertical asymmetry in global processing (i.e., sensitivity to
low-SFs) is predictable based on the fMRI response evoked within
area V3A by depth-varying stimuli. Here, we tested for a
differ-ence between low-SF selectivity of near- versus far-preferring
clusters, as suggested by our hypothesized 3-D mechanism for
this vertical asymmetry. fMRI activity was measured within
near-and far-preferring clusters in response to sinusoidal gratings with
different SFs (0.10, 0.27, 0.73, 2.08, and 5.79 c/deg) and contrasts
(1.40%, 5.25%, 16.00%, 50.10%, and 99.60%), presented in a 5
⫻
5 blocked design (see Materials and Methods). Analyses focused
on V3A, but included V2 and V3 as well, partly as control
condi-tions. To increase the level of signal averaging, and to measure the
reliability of the results, each subject was scanned twice, on
dif-ferent days.
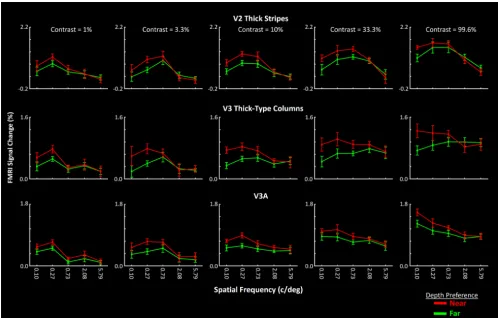
In all three cortical areas, the results showed that the higher
sensitivity to low-SF components was more prominent in
near-preferring compared with far-near-preferring clusters, especially at
higher contrasts (
Fig. 6
). A three-factor repeated-measures
ANOVA [SF, contrast and cluster type (near vs far preferring)],
with a group factor (first vs second session), showed a significant
effect of cluster type
⫻
SF interaction (
F
(4,48)⬎
7.13,
p
⬍
10
⫺3)
on activity measured within V2, V3, and V3A. This result suggests
a higher fMRI response to lower-SF stimuli in near-preferring
compared with far-preferring clusters (
Table 1
). These results
also support the hypothesis that the asymmetric visual global
processing reflects a stronger low-SF sensitivity in
near-preferring compared with far-near-preferring clusters. In neither ROI
did we find a significant interaction between the effect of scan
sequence and the other independent factors (
p
⬎
0.24), thus
supporting the reliability of our findings.
The results of this experiment also showed a systematic shift in
the preferred SF, in V2 (0.27 c/deg), and V3 and V3A (0.10 c/deg),
regardless of the visual depth preference of the ROI (
Fig. 6
).
Consistent with this observation, a three-factors
repeated-measures ANOVA (SF and cluster type and area) with a group
factor (first vs second scan session), applied to activity evoked by
high contrast (contrast
⫽
99.6%), stimuli showed a significant
interaction between SF
⫻
area effects (
F
(8,96)⫽
18.55,
p
⬍
10
⫺5;
Table 2
). Thus, a stronger correlation between the V3A fMRI
response and asymmetric global processing (indexed by low-SF
components) compared with lower stage visual areas could be
due to a lower SF preference in V3A compared with earlier areas
(see also Experiment 4). In all of these tests, the effect of group,
and its interaction with other factors, remained nonsignificant
(
p
⬎
0.27), thus supporting the reliability of our findings.
In cortical areas V2 and V3, the retinotopic mapping of upper
versus lower visual fields is more precise compared with
higher-tier areas (
Engel et al., 1997
;
Wade et al., 2002
;
Sereno et al., 2013
).
This is due to the increase in receptive field size and scatter in
higher-level compared with lower-level visual areas (
Hubel and
Wiesel, 1974
;
Gattass et al., 1987
;
Smith et al., 2001
;
Dumoulin
and Wandell, 2008
) that affects the localization of dorsal versus
ventral borders in higher-level visual areas including V3A. At
least in V2 and V3, it could be argued that this differential low-SF
sensitivity between near- and far-preferring clusters could reflect
a heterogeneous distribution of near- and far-preferring clusters
within the cortical representations of the LVF and UVF (
Nasr and
Tootell, 2018
).
To address this possibility, we tested whether the observed
differences between the low SF-related response in near- versus
far-preferring clusters was due to a secondary difference between
activity evoked within “dorsal versus ventral” stereoselective
col-umns, independent of their “near versus far” depth preference. In
this test, dorsal versus ventral stereoselective columns were
indi-vidually defined for each subject, based on the location of
stereo-selective columns relative to the cortical representation of the
lower versus upper visual field, mapped retinotopically (see
Ma-terials and Methods). The above analysis was applied to activity
measured within dorsal versus ventral (rather than near vs far)
stereoselective columns in V2 and V3. The results showed neither
a significant cluster type
⫻
SF (
F
(4,48)⬍
2.57,
p
⬎
0.12) nor
cluster type
⫻
SF
⫻
contrast (
F
(16,192)⬍
1.69,
p
⬎
0.15)
interac-tions (
Table 3
).
We then applied the same test to activity measured in
color-selective columns and/or the whole visual areas (see Materials
and Methods). We found no apparent difference between the
response to low-SF gratings in dorsal versus ventral areas (
Fig. 7
)
in any of these areas. We found only a stronger sensitivity to
mid-SF (0.73 c/deg) gratings in V2 dorsal versus ventral
color-selective columns. However, V3 color-color-selective columns showed
an opposite effect, making it unlikely that color-selective
col-umns contribute to vertically asymmetric global configuration
encoding. Thus, the differential SF sensitivity between
near-preferring and far-near-preferring clusters supported a primary
differ-ence between cortical mechanisms specialized for near versus far
space, rather than a secondary selectivity based on “LVF versus
UVF” representations.
Experiment 4: SF preference in near- versus far-preferring
clusters in 3-D stimuli
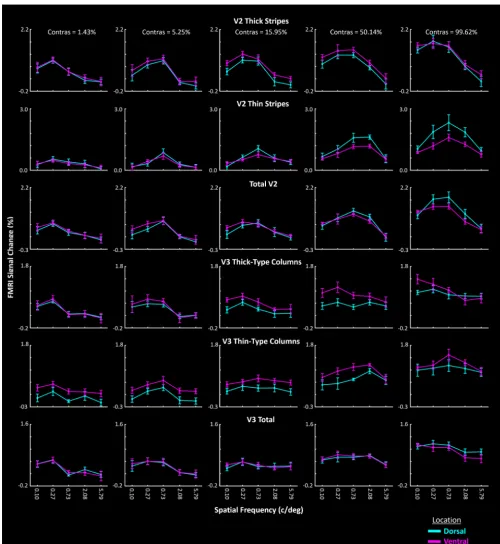
We next tested whether the higher sensitivity to 2-D low SFs in
near-preferring compared with far-preferring clusters (as
pre-Figure 6. Near-preferring clusters show a higher low-SF selectivity compared with far-preferring clusters. Each panel shows the activity evoked by gratings of various SFs, at one contrast level. Stronger low-SF selectivity of near-preferring clusters can be seen in V2, V3, and V3A, across different stimulus contrast levels. Area V3A showed a preference for lower SFs, compared with V2 and V3. Activity within near- and far-preferring clusters is indicated by red and green lines, respectively. Error bars represent 1 SEM.
Table 1. SF sensitivity across near- versus far-preferring clusters within areas V2, V3, and V3A (Experiment 3)
V2 V3 V3A
FValue pValue FValue pValue FValue pValue
Scan sequence (first vs second scan) 2.11 0.17 1.09 0.32 1.54 0.24
SF (0.10 vs 0.27 vs 0.73 vs 2.08 vs 5.79 c/deg) 40.39 ⬍10⫺7 5.38 0.02 15.97 ⬍10⫺4
SF⫻scan sequence 0.67 0.52 1.07 0.38 0.48 0.63
Contrast (1.43%, 5.25%, 15.95%, 50.14%, and 99. 62%) 19.32 ⬍10⫺4 38.35 ⬍10⫺6 128.27 ⬍10⫺12
Contrast⫻scan sequence 0.25 0.73 0.21 0.93 0.36 0.70
Cluster type (near vs far-preferring stereoselective) 39.72 ⬍10⫺4 5.21 0.04 9.29 0.01
Cluster type⫻scan sequence 1.73 0.21 0.34 0.57 0.38 0.55
SF⫻contrast 1.91 0.09 1.12 0.33 2.48 0.04
SF⫻contrast⫻scan sequence 1.03 0.42 0.94 0.47 1.24 0.30
SF⫻cluster type 16.36 ⬍10⫺3 7.13 ⬍10⫺3 20.13 ⬍10⫺6
SF⫻cluster type⫻scan sequence 0.19 0.74 0.02 0.99 0.78 0.49
Contrast⫻cluster type 2.29 0.11 2.95 0.08 0.84 0.45
Contrast⫻cluster type⫻scan sequence 0.22 0.85 0.30 0.71 0.84 0.45
SF⫻contrast⫻cluster type 3.15 0.02 2.47 0.08 2.32 0.04
SF⫻contrast⫻cluster type⫻scan sequence 0.81 0.53 0.92 0.44 0.78 0.59
dicted by our hypothesis, and as supported by the results of
Ex-periment 3) also generalized to 3-D cues. Stimuli were 3-D
checkerboards generated using RDS, in which 3-D check size
varied across the experimental blocks (i.e., 3
⫻
4 vs 6
⫻
8 vs 12
⫻
16 vs 24
⫻
32; see Materials and Methods). It was not possible to
directly convert and compare 3-D configuration to 1-D spatial
frequency (Experiment 3). Nevertheless, fundamental spatial
fre-quencies in the 3
⫻
4, 6
⫻
8, 12
⫻
16, and 24
⫻
32 stimulus
configurations include 0.075, 0.15, 0.3, and 0.6 c/deg (i.e.,
rela-tively low SF), along either horizontal or vertical directions. This
means that, compared with Experiment 3 (in which we found a
difference in response to low-SF, but not high-SF, stimuli in
near-vs far-preferring clusters), Experiment 4 had a more limited
range of stimuli. Therefore, rather than a significant cluster
type
⫻
check size interaction (as we found in Experiment 3 as a
significant cluster type
⫻
SF; see above), we expected a significant
effect of cluster type. fMRI activity was measured relative to the
1
⫻
1 (zero-disparity) configuration.
Figure 8
shows the responses evoked by these 3-D
checker-boards in near- and far-preferring clusters in V3A, along with
responses in earlier visual areas V2 and V3. In all three areas,
stereoselective columns showed a stronger response to larger 3-D
check configurations (i.e., 3
⫻
4 and 6
⫻
8) compared with the
smaller ones (i.e., 12
⫻
16 and 24
⫻
32). Moreover, in all three
areas, near-preferring clusters showed more sensitivity to the 3-D
stimulus configuration, compared with far-preferring clusters.
Furthermore, we noticed an apparent shift in the preferred
stim-ulus configuration, from a 6
⫻
8 to a 3
⫻
4 configuration,
be-tween V2 to V3 to V3A, as we found previously based on 2-D
gratings (see Experiment 3). A three-factor repeated-measures
ANOVA (check size, cluster type, and area) showed significant
effects of check size (
F
(3,18)⫽
27.83,
p
⬍
10
⫺5), cluster type (
F
(1,6)⫽
12.80,
p
⫽
0.01), and area
⫻
check size (
F
(6,36)⫽
16.68,
p
⬍
10
⫺3;
Table 4
). Thus, the differences in SF sensitivity between the
near- and far-preferring clusters were not limited to their
re-sponses to 2-D stimuli; the differences also extended to more
complicated 3-D cues, despite the broad stimulus differences
be-tween 3-D checks and 2-D gratings.
As in Experiment 3, we also checked whether a difference in
check size sensitivity was found between LVF and UVF
stereose-lective regions, regardless of their near versus far depth
prefer-ence (
Fig. 9
). Again, a three-factor repeated-measures ANOVA
[check size, area, and cluster type (dorsal vs ventral)] confirmed
significant effects of check size (
F
(4,18)⫽
20.19,
p
⬍
10
⫺4), and
area
⫻
check size (
F
(3,18)⫽
14.30,
p
⬍
10
⫺3), without a
signifi-cant effect of cluster type (
F
(1,6)⫽
0.08,
p
⫽
0.79) and/or
inter-action between this effect and the effect of other independent
factors (
F
⬍
1.26,
p
⬎
0.32;
Table 5
).
Similar results were found when we applied this analysis to
activity within dorsal versus ventral color-selective columns, and
also the cortical representation of LVF and UVF, regardless of
their stereoselectivity/color selectivity (
Table 6
). Other than a
stronger check size sensitivity in ventral compared with dorsal
color-selective columns (i.e., opposite to the pattern expected
from the vertical asymmetry in configuration encoding), we did
not find any difference between activity evoked across the ROIs.
Thus, these results support our hypothesis that sensitivity to
check size (3-D configuration) differs between near- and
far-preferring clusters; it was not a secondary effect of sampling from
the cortical representations of UVF versus LVF (see Discussion).
Discussion
The statistics of natural scenes, and a typical observer’s extensive
experience viewing them, are thought to shape visual perception.
Although psychophysical studies have provided much evidence
for such a bias (
Previc, 1990
;
Yang and Purves, 2003
), related
physiological evidence is rare, often limited to activity
measure-ments across large-scale brain regions using conventional fMRI
techniques (
Furmanski and Engel, 2000
;
Nasr and Tootell,
2012a
). Here, we instead measured fMRI activity at a finer spatial
scale (i.e., cortical clusters and columns) and demonstrated an
association between (1) the level of vertical asymmetry in global
perception (a phenomenon linked to higher relevance of low-SF
visual feature in the LVF compared with the UVF) and (2) fMRI
activity evoked within V3A near- and far-preferring clusters. This
analysis at a smaller scale revealed cortical selectivity that would
not have been visible at the larger spatial scale of conventional
fMRI. Thus, our results highlight the insights available from
studying fine-scale cortical structures in understanding the
im-pact of natural scene statistics in shaping human behavior.
Functional organization of the visual system is shaped by
statistics of natural scenes
The visual system processes many different stimuli, more or less
concurrently. However, the relevance of different visual stimuli
for survival can vary significantly. For instance, objects that are
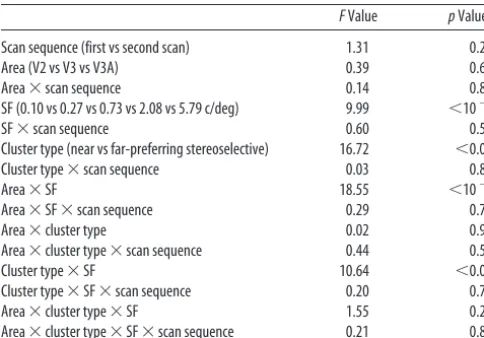
Table 2. SF sensitivity across near- versus far-preferring clusters within areas V2, V3, and V3A (Experiment 3)
FValue pValue
Scan sequence (first vs second scan) 1.31 0.27
Area (V2 vs V3 vs V3A) 0.39 0.67
Area⫻scan sequence 0.14 0.86
SF (0.10 vs 0.27 vs 0.73 vs 2.08 vs 5.79 c/deg) 9.99 ⬍10⫺3
SF⫻scan sequence 0.60 0.58
Cluster type (near vs far-preferring stereoselective) 16.72 ⬍0.01
Cluster type⫻scan sequence 0.03 0.87
Area⫻SF 18.55 ⬍10⫺5
Area⫻SF⫻scan sequence 0.29 0.79
Area⫻cluster type 0.02 0.93
Area⫻cluster type⫻scan sequence 0.44 0.56
Cluster type⫻SF 10.64 ⬍0.01
Cluster type⫻SF⫻scan sequence 0.20 0.72
Area⫻cluster type⫻SF 1.55 0.23
Area⫻cluster type⫻SF⫻scan sequence 0.21 0.82
Table 3. SF sensitivity across dorsal versus ventral stereoselective columns within areas V2 and V3 (Experiment 3)
V2 V3
FValue pValue FValue pValue
Scan sequence (first vs second scan) 3.23 0.10 2.71 0.13 SF (0.10 vs 0.27 vs 0.73 vs 2.08 vs 5.79 c/deg) 50.62 ⬍10⫺8 14.06 ⬍10⫺3
SF⫻scan sequence 0.54 0.59 1.11 0.34
Contrast (1.43, 5.25, 15.95, 50.14, and 99.62%) 26.39 ⬍10⫺5 45.40 ⬍10⫺8 Contrast⫻scan sequence (first vs second scan) 0.25 0.76 0.54 0.60 Cluster type (dorsal vs ventral stereoselective
columns)
5.31 0.04 0.87 0.37
Cluster type⫻scan sequence 0.12 0.73 0.37 0.55
SF⫻Contrast 3.90 ⬍0.01 1.36 0.24
SF⫻Contrast⫻scan sequence 0.91 0.48 0.77 0.59
SF⫻cluster type 0.48 0.61 2.57 0.12
SF⫻cluster type⫻scan sequence 0.24 0.78 0.08 0.85
Contrast⫻cluster type 4.33 0.02 3.40 0.04
physically nearer to the observer are often more relevant for
sur-vival (in terms of both threat and food acquisition), compared
with objects that are located farther away. Such “near” stimuli
appear more frequently within the LVF compared with the UVF
(
Yang and Purves, 2003
). Consistent with this, previous studies in
humans (
Nasr and Tootell, 2018
) and nonhuman primates (
Ad-ams and Zeki, 2001
;
Tanabe et al., 2005
;
Chen et al., 2008
) have
shown that clusters of near-preferring neurons are more
fre-quently distributed within those cortical regions that represent
the LVF, compared with those that represent the UVF. This
sys-tematic variation in the distribution of depth-sensitive neural
clusters may enable the visual system to more effectively allocate
Figure 7. Response to gratings of various SFs within dorsal versus ventral regions (LVF vs UVF cortical representations, respectively) of areas V2 and V3. In contrast to near- and far-preferring clusters (Fig. 6), these areas did not show greater activity within dorsal compared with ventral depth-selective regions in response to lower-SF gratings. Similar results were also found when comparing the activity evoked within dorsal versus ventral portions of V2 and V3, regardless of their depth selectivity. These results ruled out the possibility that the asymmetry found in Experiment 3 (i.e., higher low-SF selectivity in near-preferring compared with far-preferring clusters) is a second-order phenomenon relative to the potential difference between activity evoked within dorsal versus ventral regions. Error bars represent 1 SEM.
its limited neural resources across the visual field (
Previc, 1990
;
Yang and Purves, 2003
).
The current results extend those previous findings by
demon-strating a differential visual processing within near- and
far-preferring clusters. Specifically, it has been proposed that visual
blurring increases the relevance of low-SF components in
vi-sual perception, especially at near rather than far distances
(
Previc, 1990
). Our findings of differential low-SF preference
between near- and far-preferring clusters support the
hypoth-esis that the human visual system may have “adapted” to the
statistics of natural scenes by enhancing low-SF processing
within near-preferring compared with
far-preferring clusters. Our findings are
also consistent with the interpretation
that humans perceive near stimuli based
more on spatially graded borders,
com-pared with sharp borders (
Marshall et
al., 1996
;
Mather and Smith, 2000
;
Sprague et al., 2016
).
Moreover, here we showed that the
stronger low-SF response in near-preferring
clusters, compared with far-preferring
clusters, is not limited to 1-D gratings
(Ex-periment 3). Rather, the bias extended to
response to 3-D shapes, which were more
naturalistic than the 1-D gratings. This
generalization was evident despite the
dif-ferences among (1) the spatial
configura-tion, (2) the size of variation in stimuli
used in Experiment 3 versus 4, and (3) the
impact of these differences on the
statisti-cal analysis. Specifistatisti-cally, in Experiment 3,
the 1-D stimuli covered a wider SF range
compared with the 3-D stimulus used in
Experiment 4. The results of Experiment 3
showed a significant interaction between
the effects of SF
⫻
cluster type, suggestive
of a stronger effect of cluster type on low
compared with higher SFs (
Fig. 6
). In
Ex-periment 4, we found only a significant
effect of cluster type (rather than shape
⫻
cluster type interaction;
Fig. 8
), likely due
to the narrower range of variations in
stimulus shape in this test compared with
Experiment 3. Thus, the results of both
experiments suggest a stronger preference
for low SFs in near-preferring compared
with far-preferring stimuli.
Figure 8. Stronger selectivity to lower SFs in 2-D stimuli in near-preferring compared with far-preferring clusters also generalizes to 3-D checks that are generated based on RDS. In V2, V3, and V3A, near-preferring clusters (red) show a stronger selectivity for larger 3-D checks, compared with far-preferring clusters (green). As inFigure 6, area V3A here showed a preference for lower SFs compared with areas V2 and V3. Error bars represent 1 SEM.
Figure 9. Response to RDS-based 3-D stimuli, with various check sizes measured within dorsal versus ventral regions of areas V2 and V3. In contrast to the difference between near- and far-preferring clusters (Fig. 8), we did not find any significant difference between activity evoked within dorsal versus ventral regions, regardless of their depth selectivity. This result suggests that the stronger response to larger check sizes within near-preferring compared with far-preferring clusters (Experiment 4) is not a second-order phenomenon arising from a potential difference between activity evoked within dorsal versus ventral regions. Other details are similar to those inFigure 7.
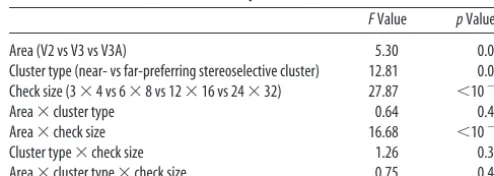
Table 4. Check size (3-D structures) sensitivity across near- versus far-preferring clusters within areas V2, V3, and V3A (Experiment 4)
FValue pValue
Area (V2 vs V3 vs V3A) 5.30 0.03
Cluster type (near- vs far-preferring stereoselective cluster) 12.81 0.01 Check size (3⫻4 vs 6⫻8 vs 12⫻16 vs 24⫻32) 27.87 ⬍10⫺5
Area⫻cluster type 0.64 0.49
Area⫻check size 16.68 ⬍10⫺3
Cluster type⫻check size 1.26 0.31
Near versus far or dorsal versus ventral?
Here we report a stronger selectivity within near-preferring
com-pared with far-preferring clusters in V3A at low SFs. However, in
lower-tier areas (e.g., areas V2 and V3), near-preferring clusters
are more frequently distributed within dorsal visual areas
com-pared with ventral visual areas (
Nasr and Tootell, 2018
).
There-fore, it could be argued that this selectivity difference between
near- and far-preferring clusters is a second-order phenomenon
compared with low-SF selectivity differences between dorsal and
ventral cortical regions.
To address this, we tested for a differential low-SF selectivity of
dorsal versus ventral disparity-selective clusters, in all
experi-ments. None of these tests showed a significant difference
between activity evoked within dorsal versus ventral
disparity-selective clusters. Moreover, we found a higher low SF-disparity-selective
response within near-preferring compared with far-preferring
clusters of area V3A, in which there is no systematic dorsal–
ventral difference in the distribution of near- and far-preferring
clusters. Thus, it is highly unlikely that our main findings arise
secondarily from a difference between dorsal and ventral regions.
Why V3A?
Sensitivity to horizontal binocular disparity is one important cue
for visual depth (i.e., visual distance from the observer).
Disparity-sensitive (stereoselective) activity has been reported in
multiple visual areas, including V2, V3, V3A, and V4, in
electro-physiological and imaging studies in nonhuman primates (
Ad-ams and Zeki, 2001
;
Hinkle and Connor, 2001
;
Thomas et al.,
2002
;
Watanabe et al., 2002
;
Tsao et al., 2003
;
Chen et al., 2008
;
Anzai et al., 2011
;
Li et al., 2019
) and in neuroimaging studies in
humans (
Tsao et al., 2003
;
Neri et al., 2004
;
Goncalves et al., 2015
;
Nasr et al., 2016
;
Nasr and Tootell, 2018
). In a previous study, by
taking advantage of high-field, high-resolution neuroimaging
techniques, we found that clusters of such disparity-selective
neurons show a strong selectivity for low-SF visual components
(
Tootell and Nasr, 2017
). Interestingly, among the early
retino-topic visual areas in humans, V3A showed the highest
concentra-tion of disparity-selective columns (
Tootell and Nasr, 2017
) and
is highly active in a broad range of disparity tests (
Tsao et al.,
2003
;
Neri et al., 2004
;
Bridge and Parker, 2007
;
Cottereau et al.,
2011
;
Goncalves et al., 2015
). Furthermore, V3A showed a
stron-ger low SF-selective response compared with lower visual areas
V2 and V3 (
Tootell and Nasr, 2017
).
The current results extend our previous findings in human
V3A by showing a significant correlation between the
disparity-selective response within V3A (but not lower-stage areas) and the
level of vertical asymmetry in global processing (measured
be-haviorally). These findings are consistent with previous studies
that suggested a close link between activity evoked in human V3A
(compared with the earlier visual areas) and the subjects’ depth
perception (
Backus et al., 2001
).
Selective attention versus sensory processing
Multiple psychophysical studies have suggested that the stronger
global processing in the LVF (compared with the UVF) is
accom-panied by relatively stronger attentional modulation in those
re-gions that represent the LVF compared with the UVF (
de
Gonzaga Gawryszewski et al., 1987
;
Previc, 1990
;
Thomas and
Elias, 2011
). Thus, one might also expect a stronger attentional
modulation of activity in near-preferring compared with
far-preferring neural clusters.
Our “sensory” hypothesis tested here (i.e., differential low-SF
selectivity within near- vs far-preferring clusters) and the
alter-native hypothesis of “attention modulation” (also within near- vs
far-preferring clusters) are not mutually exclusive. However, it is
unlikely that our findings are solely due to differential attention
modulation, for several reasons. Specifically, in our
neuroimag-ing tests, the impact of attention was reduced by requirneuroimag-ing our
subjects to perform a “dummy” attention task, detecting a change
in either color or shape in a small fixation target, regardless of the
much larger stimuli on screen. Also, our stimuli were either 2-D,
presented within the frontoparallel plane relative to the fixation
spot (Experiment 3), or 3-D, spanning near and far distances over
an equivalent range (Experiment 4). Therefore, such simple
geo-metrical stimuli are not expected to evoke differential attentional
modulation within near- versus far-preferring clusters.
Further-more, we did not find any significant difference between the
ac-tivity evoked within those regions that represented the LVF
versus those that represented the UVF, in either of our tests.
Thus, it is unlikely that our findings solely reflected a differential
impact of attentional modulation, in either near- versus
far-preferring clusters or LVF versus UVF.
Nevertheless, it remains possible that the difference in low-SF
selectivity between near- and far-preferring cluster is enhanced
when a subject’s attention is directed toward global processing.
Similar effects have been reported at macroscopic (area/region)
spatial scales within face- and scene-selective regions, during face
and scene discrimination tasks (
O’Craven et al., 1999
;
Nasr and
Tootell, 2012b
). Further studies are required to clarify the effect
of attention on the vertical asymmetry in global perception.
Limitations
Here we focused on a specific aspect of global–local processing,
the interaction between the perception of upper and lower visual
fields and spatial frequency. It is widely recognized that multiple
additional visual cues can affect global and local processing,
in-cluding holistic processing (
Tanaka and Farah, 2003
;
Young et al.,
2013
) and/or motion coherence (
Williams and Sekuler, 1984
;
Siegel and Andersen, 1988
). However, it is not yet known whether
(or which of) these other cues show biases that are consistent with
Table 5. Check size (3-D structures) sensitivity across dorsal versus ventral stereoselective columns of areas V2 and V3 (Experiment 4)
FValue pValue
Area (V2 vs V3) 10.40 0.02
Cluster type (dorsal vs ventral stereoselective clusters) 0.08 0.79 Check size (3⫻4 vs 6⫻8 vs 12⫻16 vs 24⫻32) 20.19 ⬍10⫺5
Area⫻cluster type ⬍0.01 0.98
Area⫻check size 14.30 ⬍10⫺4
Cluster type⫻check size 1.26 0.31
Area⫻cluster type⫻check size 0.73 0.46
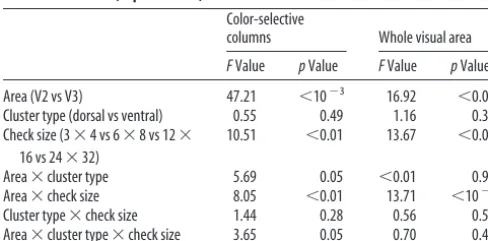
Table 6. Check size (3-D structures) sensitivity across dorsal versus ventral portions of areas V2 and V3 (Experiment 4)
Color-selective
columns Whole visual area
FValue pValue FValue pValue
Area (V2 vs V3) 47.21 ⬍10⫺3 16.92 ⬍0.01
Cluster type (dorsal vs ventral) 0.55 0.49 1.16 0.32 Check size (3⫻4 vs 6⫻8 vs 12⫻
16 vs 24⫻32)
10.51 ⬍0.01 13.67 ⬍0.01
Area⫻cluster type 5.69 0.05 ⬍0.01 0.96
Area⫻check size 8.05 ⬍0.01 13.71 ⬍10⫺3
Cluster type⫻check size 1.44 0.28 0.56 0.59 Area⫻cluster type⫻check size 3.65 0.05 0.70 0.49
environmental constraints, as suggested here. Importantly, other
biases in visual sensitivity also have been linked to environmental
biases in natural image statistics (
Furmanski and Engel, 2000
;
Sasaki et al., 2006
;
Rajimehr et al., 2011
;
Nasr and Tootell, 2012a
;
Nasr et al., 2014
). This supports the general hypothesis that the
statistics of natural scenes help to shape neural processing within
human visual cortex.
References
Adams DL, Zeki S (2001) Functional organization of macaque V3 for ste-reoscopic depth. J Neurophysiol 86:2195–2203.
Anzai A, Chowdhury SA, DeAngelis GC (2011) Coding of stereoscopic depth information in visual areas V3 and V3A. J Neurosci 31:10270 – 10282.
Backus BT, Fleet DJ, Parker AJ, Heeger DJ (2001) Human cortical activity correlates with stereoscopic depth perception. J Neurophysiol 86:2054 – 2068.
Boynton GM, Engel SA, Glover GH, Heeger DJ (1996) Linear systems anal-ysis of functional magnetic resonance imaging in human V1. J Neurosci 16:4207– 4221.
Brainard DH (1997) The psychophysics toolbox. Spat Vis 10:433– 436. Bridge H, Parker AJ (2007) Topographical representation of binocular
depth in the human visual cortex using fMRI. J Vis 7(14):15, 1–14. Chen G, Lu HD, Roe AW (2008) A map for horizontal disparity in monkey
V2. Neuron 58:442– 450.
Christman SD (1993) Local-global processing in the upper versus lower vi-sual fields. Bull Psychon Soc 31:275–278.
Cottereau BR, McKee SP, Ales JM, Norcia AM (2011) Disparity-tuned pop-ulation responses from human visual cortex. J Neurosci 31:954 –965. Courtney SM, Ungerleider LG, Keil K, Haxby JV (1997) Transient and
sus-tained activity in a distributed neural system for human working memory. Nature 386:608 – 611.
Dale AM, Buckner RL (1997) Selective averaging of rapidly presented indi-vidual trials using fMRI. Hum Brain Mapp 5:329 –340.
Dale AM, Fischl B, Sereno MI (1999) Cortical surface-based analysis. I. Seg-mentation and surface reconstruction. Neuroimage 9:179 –194. de Gonzaga Gawryszewski L, Riggio L, Rizzolatti G, Umilta´ C (1987)
Move-ments of attention in the three spatial dimensions and the meaning of “neutral” cues. Neuropsychologia 25:19 –29.
Dumoulin SO, Wandell BA (2008) Population receptive field estimates in human visual cortex. Neuroimage 39:647– 660.
Engel SA, Glover GH, Wandell BA (1997) Retinotopic organization in hu-man visual cortex and the spatial precision of functional MRI. Cereb Cortex 7:181–192.
Fischl B (2012) FreeSurfer. Neuroimage 62:774 –781.
Fischl B, Sereno MI, Dale AM (1999) Cortical surface-based analysis. II: inflation, flattening, and a surface-based coordinate system. Neuroimage 9:195–207.
Fischl B, Salat DH, Busa E, Albert M, Dieterich M, Haselgrove C, van der Kouwe A, Killiany R, Kennedy D, Klaveness S, Montillo A, Makris N, Rosen B, Dale AM (2002) Whole brain segmentation: automated label-ing of neuroanatomical structures in the human brain. Neuron 33:341– 355.
Flevaris AV, Bentin S, Robertson LC (2010) Local or global? attentional selection of spatial frequencies binds shapes to hierarchical levels. Psychol Sci 21:424 – 431.
Friston KJ, Holmes AP, Price CJ, Bu¨chel C, Worsley KJ (1999) Multisubject fMRI studies and conjunction analyses. Neuroimage 10:385–396. Furmanski CS, Engel SA (2000) An oblique effect in human primary visual
cortex. Nat Neurosci 3:535–536.
Gaska JP, Jacobson LD, Pollen DA (1988) Spatial and temporal frequency selectivity of neurons in visual cortical area V3A of the macaque monkey. Vision Res 28:1179 –1191.
Gattass R, Sousa AP, Rosa MG (1987) Visual topography of V1 in the cebus monkey. J Comp Neurol 259:529 –548.
Goncalves NR, Ban H, Sa´nchez-Panchuelo RM, Francis ST, Schluppeck D, Welchman AE (2015) 7 tesla FMRI reveals systematic functional orga-nization for binocular disparity in dorsal visual cortex. J Neurosci 35: 3056 –3072.
Greve DN, Fischl B (2009) Accurate and robust brain image alignment us-ing boundary-based registration. Neuroimage 48:63–72.
Hinkle DA, Connor CE (2001) Disparity tuning in macaque area V4. Neu-roreport 12:365–369.
Hubel DH, Wiesel TN (1974) Uniformity of monkey striate cortex: a paral-lel relationship between field size, scatter, and magnification factor. J Comp Neurol 158:295–305.
Julesz B (1971) Foundations of cyclopean perception. Chicago: University of Chicago.
Keil B, Triantafyllou C, Hamm M, Wald LL (2010) Design optimization of a 32-channel head coil at 7T. In: ISMRM-ESMRMB Joint Annual Meeting 2010: Stockholm, Sweden, 1–7 May 2010/monograph, p 1943. Red Hook, NY: Curran Associates.
LaGasse LL (1993) Effects of good form and spatial frequency on global precedence. Percept Psychophys 53:89 –105.
Levine MW, McAnany JJ (2005) The relative capabilities of the upper and lower visual hemifields. Vision Res 45:2820 –2830.
Li X, Zhu Q, Janssens T, Arsenault JT, Vanduffel W (2019) In vivo identifi-cation of thick, thin, and pale stripes of macaque area V2 using submilli-meter resolution (f)MRI at 3 T. Cereb Cortex 29:544 –560.
Liu T, Heeger DJ, Carrasco M (2006) Neural correlates of the visual vertical meridian asymmetry. J Vis 6:1294 –1306.
Marshall JA, Burbeck CA, Ariely D, Rolland JP, Martin KE (1996) Occlusion edge blur: a cue to relative visual depth. J Opt Soc Am A Opt Image Sci Vis 13:681– 688.
Mather G, Smith DR (2000) Depth cue integration: stereopsis and image blur. Vision Res 40:3501–3506.
Minini L, Parker AJ, Bridge H (2010) Neural modulation by binocular dis-parity greatest in human dorsal visual stream. J Neurophysiol 104:169 – 178.
Nasr S, Tootell RB (2012a) A cardinal orientation bias in scene-selective visual cortex. J Neurosci 32:14921–14926.
Nasr S, Tootell RB (2012b) Role of fusiform and anterior temporal cortical areas in facial recognition. Neuroimage 63:1743–1753.
Nasr S, Tootell RBH (2018) Visual field biases for near and far stimuli in disparity selective columns in human visual cortex. Neuroimage 168: 358 –365.
Nasr S, Liu N, Devaney KJ, Yue X, Rajimehr R, Ungerleider LG, Tootell RB (2011) Scene-selective cortical regions in human and nonhuman pri-mates. J Neurosci 31:13771–13785.
Nasr S, Echavarria CE, Tootell RB (2014) Thinking outside the box: recti-linear shapes selectively activate scene-selective cortex. J Neurosci 34: 6721– 6735.
Nasr S, Polimeni JR, Tootell RB (2016) Interdigitated color- and disparity-selective columns within human visual cortical areas V2 and V3. J Neu-rosci 36:1841–1857.
Neri P, Bridge H, Heeger DJ (2004) Stereoscopic processing of absolute and relative disparity in human visual cortex. J Neurophysiol 92:1880 –1891. Niebauer CL, Christman SD (1998) Upper and lower visual field differences in categorical and coordinate judgments. Psychon Bull Rev 5:147–151. O’Craven KM, Downing PE, Kanwisher N (1999) fMRI evidence for objects
as the Us of attentional selection. Nature 401:584 –587.
Pelli DG (1997) The VideoToolbox software for visual psychophysics: transforming numbers into movies. Spat Vis 10:437– 442.
Polimeni JR, Fischl B, Greve DN, Wald LL (2010) Laminar analysis of 7T BOLD using an imposed spatial activation pattern in human V1. Neuro-image 52:1334 –1346.
Polimeni JR, Bhat H, Witzel T, Benner T, Feiweier T, Inati SJ, Renvall V, Heberlein K, Wald LL (2016) Reducing sensitivity losses due to respira-tion and morespira-tion in accelerated echo planar imaging by reordering the autocalibration data acquisition. Magn Reson Med 75:665– 679. Previc FH (1990) Functional specialization in the lower and upper visual
fields in humans: its ecological origins and neurophysiological implica-tions. Behav Brain Sci 13:519 –575.
Rajimehr R, Devaney KJ, Bilenko NY, Young JC, Tootell RB (2011) The “parahippocampal place area” responds preferentially to high spatial fre-quencies in humans and monkeys. PLoS Biol 9:e1000608.
Robertson LC, Egly R, Lamb MR, Kerth L (1993) Spatial attention and cuing to global and local levels of hierarchical structure. J Exp Psychol Hum Percept Perform 19:471– 487.
Sasaki Y, Rajimehr R, Kim BW, Ekstrom LB, Vanduffel W, Tootell RB (2006) The radial bias: a different slant on visual orientation sensitivity in human and nonhuman primates. Neuron 51:661– 670.