IJE TRANSACTIONS A: Basics Vol. 30, No. 7, (July 2017) 945-954
Please cite this article as: Y. Menasri, M. S. Nouaouria, M. Brahimi, Probabilistic Approach to the Seismic Vulnerability of Reinforced Concrete Frame Structures by the Development of Analytical Fragility Curves, TRANSACTIONS A: Basics Vol. 30, No. 7, (July 2017) 945-954
International Journal of Engineering
J o u r n a l H o m e p a g e : w w w . i j e . i rProbabilistic Approach to the Seismic Vulnerability of Reinforced Concrete Frame
Structures by the Development of Analytical Fragility Curves
Y. Menasri*a, M. S. Nouaouriaa, M. Brahimib
a Laboratory of Civil Engineering and Hydraulics, University of Guelma, Algeria b Mechanical Engineering Technology Department at City Tech, New York, USA
P A P E R I N F O
Paper history:
Received 11 January 2017
Received in revised form 15 April 2017 Accepted 21 April 2017
Keywords: Fragility Curves Seismic Vulnerability Nonlinear Analysis Performance Levels Seismic Response Spectrum Pushover
A B S T R A C T
Fragility curves are very useful in quantifying the physical and economic damage of buildings that have undergone an earthquake. This paper presents the development of analytical fragility curves representative of mid-rise residential structures built with reinforced concrete, taking into account the specific structural characteristics of Algerian buildings. The derivation of the analytical fragility curves is based on the capacity spectrum method (CSM), which combines a non-linear static analysis (pushover) with a response spectrum analysis. Observation of the consequences of earthquakes of a given intensity shows that the damage to buildings is not identical, even though their construction is similar. This variability of damage can be explained by the variability of a large number of factors such as the local intensity of the hazard, the heterogeneity of the terrain, and the mechanical and geometrical characteristics of the constructions. The materials and patterns of demand spectra were considered as random variables using the Latin Hypercube Sampling Technique. Most of the existing methods that model the damage to structures accept a log-normal distribution hypothesis, where the log-normal law is a model controlled by two parameters: its mean value and its standard deviation. To set these parameters, Monte Carlo simulations (MCS) are performed to generate 1000 samples. The resulting fragility curves following these analyses were applied to two real-life cases of buildings affected by the earthquake of Beni-Ilmane 2010 (Msila, Algeria), so as to assess the damage.
doi: 10.5829/ije.2017.30.07a.03
NOMENCLATURE
dy
S Displacement at yielding (cm) P[ds /Sd] Probability of obtaining a given level of damage
du
S Ultimate displacement (cm) Sd,ds Median value of spectral displacement (cm)
de
S Elastic pseudo displacement spectrum (cm) ds Standard deviation of the natural logarithm of spectral displacement
ae
S Elastic pseudo acceleration spectrum %g ds Damage state (cm)
T Natural period (s) Φ Standard normal cumulative distribution function
SRA Spectral reduction factor of acceleration βC Standard deviation of resistance
SRV Spectral reduction factor of velocity βD Standard deviation of seismic stress
eff
Effective viscous damping R Lateral strength ratio -
k
Damping modification factor - CSM Capacity spectrum methoddy Spectral displacement at yielding (cm) MCS Monte Carlo simulations method
ay Spectral acceleration at yielding %g PDF Probability density function
dpi Displacement at performance point %g POA Pushover analysis
api Acceleration at performance point (m/s2) MDOF Multiple degrees of freedom
g Gravity (m/s2) SDOF Single degree of freedom
1. INTRODUCTION
Algerian seismic regulations RPA 99 version 2003 [1] specify an acceptable level of safety for new structures located in a seismic zone and experiences of post-seismic analyses show that the protection of human lives has been ensured since the regulatory paraseismic references have been applied to seismic constructions. However, the existing buildings still pose significant safety problems in the event of strong earthquakes. Given the number of constructions existing prior to RPA 99 version 2003, and in particular structures with reinforced concrete (RCC) moment resisting frames that make up the largest category in number in Algerian cities, the experience of the 2003 Boumerdes earthquake (MW=6.8) shows that this type of structure, which represents between 80 and 90% of all the buildings affected, suffered significant damage [2]. In addition, the earthquake of Beni-Ilmane 2010 (MW= 5.2), despite its moderate seismicity, shows that buildings constructed before the implementation of RPA 99 version 2003 are particularly sensitive. Therefore, it is essential to be concerned about the issue of the seismic vulnerability of this type of structure. An efficient and powerful tool for the evaluation of the seismic vulnerability of structures is the use of fragility curves. These are fundamental components of the methodology of seismic risk assessment and the probabilistic tools used to assess the potential damage to structures at a given level of seismic hazard [3]. Different methods can be used to construct the fragility curves, and these methods can be classified into four main categories: empirical methods, methods based on expertise, analytical methods and hybrid methods. The analytical curves are defined from statistical data obtained from structural damage models [4-7]. Damage distributions from nonlinear dynamic analysis are indeed observed when the models are subjected to earthquakes with increasing amplitudes. This method of analysis can be limited by the computing time required to obtain the results of a comprehensive model. Therefore, to reduce the computation time, simplified analytical models are also available. Several researchers have proposed, instead of a nonlinear dynamic analysis, the use of nonlinear static pushover analysis procedures (POA) [4-9].
This study is focused on the development of analytical fragility curves representative of reinforced concrete moment-resisting frames structures, taking into account the specific structural characteristics of the Algerian type of building for residential buildings of medium height (mid-rise) of a high seismic level (High-Code) and moderate seismic level (moderate-code).
2. METHODOLOGY
The methodology used to develop the analytical fragility curves with respect to the seismic hazard is based on two sets of curves: capacity curves and fragility curves. The first category of curves indicates the behavior of a building facing any excitation of a seismic type. The second type of curves, i.e. fragility curves, indicates the probability of achieving a given level of damage [3]. The full methodology step by step is shown below:
Identification of the seismic excitation and selection of a seismic intensity parameter;
Structural model selection (base model);
Generation of mechanical properties by Latin Hypercube Sampling;
Development of a reduced number of buildings variants derived from the basic model;
Implementation of the capacity spectrum method (CSM) on each variant and statement of the limit states of spectral displacements and spectral acceleration corresponding to the damage levels; Construction of the probability density function
(PDF);
Generation of N capacity curves by the Monte Carlo simulations method (MCS) using the probability density function;
Calculation of the mean capacity curve and parameter estimation of the fragility function; Construction of the fragility curve (log-normal
model law).
3. CAPACITY SPECTRUM METHOD (CSM)
947 Y. Menasri / IJE TRANSACTIONS A: Basics Vol. 30, No. 7, (July 2017) 945-954
If the structure reacts elastically to the earthquake, the two curves intersect in the linear portion of the capacity curve. If damage begins, the peformance point is obtained differently, and two main approaches are proposed, one using the damping, as in ATC 40, and the other using the ductility, as in Eurocode 8 [14]. The capacity spectrum method (CSM) has been used by many researchers for the development of fragility curves. Figure 1 (a) shows an example of the capacity and demand spectrum taking into account the inherent variability of the structural behavior and soil movement. The fragility curves can be generated from these spectra to evaluate the predefined values of limit states. The probability of failure is calculated as the intersection of the demand and capacity distributions for different levels of intensity measurement [15-17].
The simplified form of the capacity spectrum is the equivalent bilinear representation (Figure 1 (b)) of the actual capacity spectrum diagram (Figure 1 (a)).This bilinear representation obtained by the idealization allows us to compute the displacements and acceleration limits (levels of damage), the ductility ratio μ and the equivalent damping, which includes viscous damping and hysteretic damping [11, 18].
3. 2. States of Damage The construction of fragility curves consists in defining a damage criterion. The damage states can be characterized in three ways: (1) maximum deformation (maximum displacement, ductility ratio, or inter-story drift), (2) cumulative damage and (3) a combination of the maximum deformation and the cumulative damage (model of Park and Ang) [3]. The capacity spectrum method (CSM) that was adopted in our study offers four levels of damage [19] which are defined as follows: slight, moderate, extensive (near collapse), and complete (collapse). Because of its simplicity, we use the Risk-EU project [20], which links the displacements in the elastic state limit state Sdy and the ultimate
displacements Sdu in the states of damage for an RC
frame (see Table 1 and Figure 1 (b)).
Figure 1.a) Statistical representation of demand and capacity spectra [16] and b) bilinear capacity spectrum and damage levels
Figure 2. Capacity spectrum procedure A to determine performance point [11]
TABLE 1. Predefined values of damage thresholds for RC frame [20]
Damage Threshold
Slight Sd10.7Sdy
Moderate Sd2Sdy
Extensive Sd3Sdy0.25
SduSdy
Complete Sd4Sdu
3. 3. Demand Spectrum The capacity spectrum method (CSM) is based on the displacements. The seismic action is also shown by the elastic design acceleration–displacement response spectra (ADRS) format. These elastic demand spectra are obtained using the following formula [11]:
ae de T S
S 2 2
4
(1)
The inelastic demand spectra are obtained by multiplying the reduction factors SRA and SRVfor the
range of constant spectral peak acceleration and constant spectral peak velocity, respectively, as follows [11]:
12 . 2
) ( ln 68 . 0 21 .
3 eff
A
SR (2)
65 . 1
) ( ln 41 . 0 31 .
2 eff
v
SR (3)
where βeff is the effective viscous damping including an assumed 5% structural viscous damping.
4. FRAGILITY CURVES
The fragility curves define the probability of reaching or exceeding a certain level of damage, either structural or non-structural, for a given value of displacement corresponding to the point of demand. Most existing
Specral displacement
S
pe
ctr
al
ac
ce
ler
ati
on
b)
a) Specral displacement
Sau
Mediandemand
Median Capacity
Idealized capacity
S
pe
ctr
al Sdy
Sdu
S
pe
ctr
al
ac
ce
ler
ati
on
methods which model the damage accept an assumption of a cumulative normal distribution. The model log-normal distribution, which represents the result of random variables well, is controlled by two parameters: the median value and standard deviation.
The fragility curve is expressed through the following formula [19]:
ds d
d ds d
s
S S S
d P
,
ln 1 ] / [
(4)
where P[ds /Sd] is the probability of obtaining a given level of damage ds for a spectral displacement Sd, Φ is the standard normal cumulative distribution function, the median value of spectral displacement at which the building reaches the threshold of the damage state, and β𝑑𝑠 is the standard deviation of the natural logarithm of
spectral displacement for damage state ds expressed through the following formula:
2 2 2
M D c
ds
(5)
where βC is the standard deviation of resistance (variability in capacity curves).
βM is the threshold of the standard deviation of a level of damage ds (variability in the estimation of the median value of the damage state) equal to 0.40, regardless of the level of damage and the typology of the considered building [19]; βD is the standard deviation of seismic stress (demand variability) calculated by Equation (7) [21]:
1 exp 0.739 1
957 . 1 1 . 0 749 . 11
1 876
. 5
1
R T
D
(6)
R is estimated using the following relation:
S T1
F m S S
R ae
y ay ae
(7)
5. DESCRIPTION OF THE BASIC MODELS
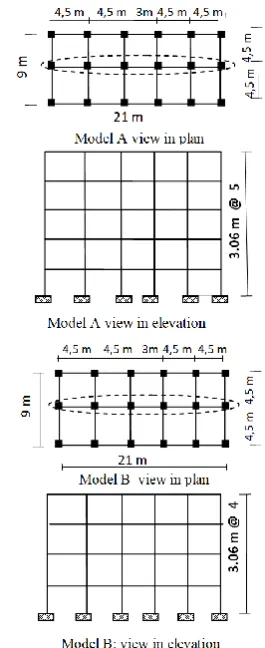
This study is focused on the development of analytical fragility curves of reinforced concrete residential framed buildings of medium height. Two fundamental types of structures were retained for the paraseismic conception: buildings from after 2003 called Model A of a high seismic level (High-Code) and buildings from before 2003 referred to as Model B of moderate seismic level (Moderate-Code).
The first basic model (Model A) is a regular reinforced concrete building of 5- storey (G + 4), where the height of each story is 3.06 m. Main beams have dimensions (30×45) cm2 and secondary beams (30×40) cm², while columns have sections of (45×45) cm2. The
second basic model (Model B) is a regular reinforced concrete building with 4-storey (G+3), where the height of each story is 3.06 m. The dimensions of the principal and secondary beams are (30×40) cm2, while columns have sections of (35×35) cm2. Both models stand on an isolated foundation system and are connected by stringers. For the superstructure, the floors are constructed with slabs of 20 cm thickness (hollow elements + compression table) with an area of (21×9) m² constant over the building height. The bracing system for both models is composed of load-bearing structures, six in the transversal direction and three in the longitudinal direction (see Figure 3). The description of the reinforcement of columns and beams for two basic models is presented in Table 2.
In order to take account of the actual variability that exists within a group of buildings of the same type, we have developed a series of variants derived from the basic models. The generated variants retain the same architectural dimensions as the base models but exhibit variations in the mechanical properties of the materials. Thirty-six (36) representative variants of the properties dispersion of each model were generated using the Latin Hypercube Sampling technique [22].
949 Y. Menasri / IJE TRANSACTIONS A: Basics Vol. 30, No. 7, (July 2017) 945-954
TABLE 2. Reinforcement of columns and beams
Reinforcement Model A Model B
Columns 10 ∅ 16 8∅ 14
Beams (cm²) Top Botton Top Botton
Principal beams 4.62 6.03 3.4 4.62
Secondary beams 3.4 4.62 3.4 4.62
Table 3 shows the properties variations of materials for the two basic models, such as the compressive strength of the concrete fcc, the modulus of elasticity of the concrete Ec and the tensile strength of the steel fy. Once the variants were generated, nonlinear static analyses were performed on each variant. The number of 36 analyzed variants is insufficient in the context of a feasibility study, but it still provides limit states (spectral displacements (PDF). From the latter, the Monte Carlo simulations (MCS) [23, 24] are performed to generate 1,000 capacity spectra for each model in order to achieve satisfactory and accurate results. These generated capacity spectra allow us to obtain average capacity spectra, from which the two parameters S̅d,dS
and βds controlling the fragility function are deduced.
5. 1. Modelling of Generated Variants For the 36 generated variants of each model, structural elements (beams and columns) are modulated themes to beam elements. The floors are considered as rigid diaphragms. To determine the capacity curves of the structure, two types of analysis were performed [11]: (1) modal analysis for gravity loads is required, and is performed in the linear elastic case. This analysis allows us to deduce the elements necessary for the conversion of capacity curves into capacity spectra. (2) Nonlinear static analysis (pushover) is performed on the same model of the structure.
The model is subjected first to the vertical forces, then to a system of horizontal forces simulating seismic forces, which are increased until the collapse of the structure, or until the maximum displacement is reached. To perform this analysis, we used the comprehensive law behavior in deformation that is defined in ATC40 and FEMA 356 [11, 18].
TABLE 3. Material properties variations for the two models Model parameter Average (MPa) Distribution COV (%)
Model A
fcc 23.5 Normal 15
Ec 31630 Normal 5
f y 448 Normal 5
Model B
fcc 17.5 Normal 14
Ec 28493 Normal 6
f y 420 Normal 5
Each beam element is discretized into three finite elements. The first element located in the center follows a elastic law characterized by a constant bending rigidity EI, while the other two located at the extremities act as plastic hinges along a rigid plastic law characterized by a bending stiffness αEI, which is the result of multiplying the stiffness EI in the uncracked state by a coefficient α that takes account of the reduction in stiffness due to cracking. We used the stiffness values given by FEMA 356 (FEMA, 2000) which are 0.7 EIc and 0.5 EIb for the columns and beams, respectively.
6. RESULTS AND DISCUSSION
The hazard programs such as Hazus and Risk-EU classify both four-storey and five-storey buildings in medium-rise buildings and have the same capacity spectra and the same fragility curves, therefore, the two models can be compared.
6. 1. Capacity Spectra Figures 4 and 5 show the capacity spectra for the 36 generated variants obtained for both Models A and B.
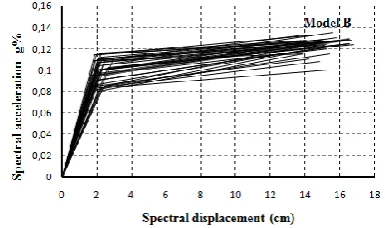
6. 2. Mean Capacity Spectra Figures 6 and 7 show the dots cloud for the 1000 generated variants obtained by Monte Carlo simulation (MCS) for both Models A and B.
Figure 4.Capacity spectra of 36 generated variants, Model A
Figure 6. Mean spectra of capacity, Models A
Figure 7. Mean spectra of capacity, Models B
In the same figure we present the mean capacity spectra (spectral accelerations-spectral displacements). For the four levels of damage (slight, moderate, extensive and complete), the values of the medians and standard deviations obtained from the two models based on spectral displacement are given in Table 4.
The comparison of the mean capacity spectra of the two studied models is best expressed through a single representation (see Figure 8). Model A has a greater resistance than Model B. In addition, Model A, dimensioned according to the new paraseismic regulations RPA99 version 2003, has an ultimate displacement capacity of 23.7 cm for a maximum acceleration equal to 0.15 g.
TABLE 4. Values of medians and standard deviations of fragility curves as a function of spectral displacement (cm)
Domage Model A Model B
ds
S ds Sds ds
Slight 2.58 0.69 1.81 0.67
Moderate 3.68 0.74 2.59 0.75
Extensive 8.58 0.74 5.87 0.73
Complete 23.5 0.63 15.64 0.66
However, Model B, which is dimensioned to resist moderate earthquakes, has an ultimate displacement capacity of 15.68 cm for a maximum acceleration equal to 0.12 g. The difference in ultimate displacement between the two models is 34%, whereas the maximum spectral acceleration is 20%.
6. 3. Fragility Curves Results Based on the median values (𝑆̅𝑑,𝑑𝑠) and standard deviations (𝛽𝑑𝑠)
obtained (Table 4) and using Equation (4) already mentioned above, we can establish a fragility curve for each model of building and for the four levels of damage. Figures 8 and 9 show the fragility curves of both Models A and B, respectively.
The comparison of fragility curves for each level of damage of both models is shown in Figure 10. It can be clearly observed that for each level of damage, the average damage in Model A is less than that of Model B, and the fragility curves of Model A, due to the weakness of the model, are always declared to the right. However, for Model B, the curves are declared to the left. This is consistent with the fact that Model B is more vulnerable than Model A. The difference between the fragility curves of Model A and Model B is due to two main parameters influencing the overall behavior of both models. These two parameters are the mechanical properties of the materials, and the reinforcement of the structural elements.
Figure 8. Fragility curves for model B
Figure 9. Fragility curves for model A
Spectral displacement (cm)
S
p
ec
tr
a
l
a
cc
el
er
a
ti
o
n
g
%
0,00 0,04 0,08 0,12 0,16 0,20 0,24
0 2 4 6 8 10 12 14 16 18 20 22 24
SD1 SD2 SD3 SD4
Model A
Spectral displcement (cm)
S
p
ec
tr
a
l
a
cc
el
er
a
ti
o
n
g
%
0,00 0,04 0,08 0,12 0,16
0 1 2 3 4 5 6 7 8 9 10 11 12 13 14 15 16 17 18
SD1 SD2 SD3 SD4 Model B
Spectral displacement Sd (cm)
p
>
d
s/
S
D
0,0 0,2 0,4 0,6 0,8 1,0
0 2 4 6 8 10 12 14 16 18 20 22 24
Slight
Moderate Extensive
Complete
Spectral displacement Sd (cm)
P
(>
d
s/
S
D
)
0,0 0,1 0,2 0,3 0,4 0,5 0,6 0,7 0,8 0,9 1,0
0 2 4 6 8 10 12 14 16 18 20
Slight
Modrate Extensive
951 Y. Menasri / IJE TRANSACTIONS A: Basics Vol. 30, No. 7, (July 2017) 945-954
Figure 10. Comparison of mean spectra of capacity for models A and B
7. CASE STUDY: IMPLEMENTATION OF FRAGILITY CURVES
Two real cases of buildings affected by the earthquake of Beni-Ilmane (Msila, Algeria) in 2010 are selected for the implementation of the fragility curves obtained previously. The choice of buildings was based on the availability of a study estimating damage to 21 buildings in Beni Ilmane. This application allows us to perform the comparison of our results of the fragility curves with damage really observed. To assess the damage rate of each type of building, two earthquake scenarios are considered. The first is the Beni-Ilmane earthquake of 14 May 2010, which corresponded to an earthquake with a PGA of about 0.10 g (MW = 5.2), where the site was 7 km from the epicenter. The second scenario is that of the reference earthquake, including the PGA of 0.15 g, because the buildings are located in zone IIa and located on a soil type S3 according to RPA99 version 2003 [1].
7. 1. Description of the Studied Buildings The first building (B1), considered for the application of the fragility curves developed in this study is a five-storey R.C. frame structure built in 2005 and designed according to RPA99 version 2003, with a concrete resistance to compression of fcc = 24 MPa, and steel of fy = 400 MPa. The reinforcement of columns is 10∅16,
the upper and lower reinforcement beams are 3∅14 and 3∅16, respectively. During the earthquake of Beni-Ilmane, the building suffered the following damage: horizontal cracks across and angled deep on the outside walls, shallow cracks in all directions on the walls, peeling exterior and interior coatings.
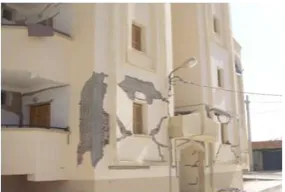
The second case study (B2) is a four-story R.C. frame structure, built in 2000 and designed according to an earlier RPA 99 (before 2003). The building is constructed with a compressive strength of concrete fcc = 19.5 MPa, and steel of fy = 400 MPa. The columns reinforcement is 8∅14, the upper and lower reinforcement beams are 3∅12 and 3∅14, respectively. The construction suffered the following damage: collapsed filling walls, cracks at nodes of columns on the ground floor. The plans of the two buildings are indicated in Figures 11 and 12.
Figure 11. View of building B1
(d) Complete
Spectral displacement Sd (cm)
P
(>
d
s/
S
D
)
0,0 0,2 0,4 0,6 0,8
0 2 4 6 8 10 12 14 16 18 20 22 24
Model A High-Code Model B Moderate-Code
(a) Slight
Spectral displacement Sd (cm)
P
(>
d
s/
S
D
)
0,0 0,2 0,4 0,6 0,8 1,0
0 2 4 6 8 10 12 14 16 18 20 22 24
Model A High-Code Model B Moderate-Code
(c) Extensive
Spectral displacement Sd (cm)
P
(>
d
s/
S
D
)
0,0 0,2 0,4 0,6 0,8 1,0
0 2 4 6 8 10 12 14 16 18 20 22 24
Model A High-Code Model B Moderate-Code
(b) Moderate
Spectral displacement Sd (cm)
P
(>
d
s/
S
D
)
0,0 0,2 0,4 0,6 0,8 1,0
0 2 4 6 8 10 12 14 16 18 20 22 24
Figure 12. View of building B2
8. RESULTS
Applying the capacity spectrum method (CMS) and the modeling of structural elements described in paragraphs 2.1 and 3.1 on the two buildings, it is possible to obtain the maximum spectral displacements (Sd) of the two
buildings B1 and B2, for PGA = 0.10 g and PGA = 0.15 g, respectively. From the results obtained from spectral displacements, we can determine the probability of damage to the buildings studied on the fragility curves (see Figures 13 and 14). For each level of damage, this figure shows the probability percentage for each building undergoing this level of damage.
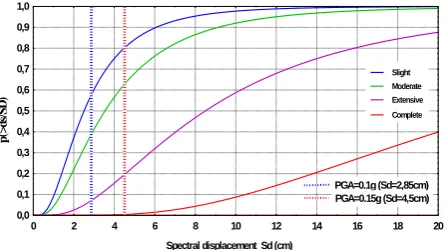
Figure 13. Estimated damage for building B1, PGA = 0.10 g and PGA = 0.15 g
Figure 14. Estimated damage for building B2, PGA= 0.10 g and PGA = 0.15 g
One can clearly see the rate of probable damage that can occur to building B1 for PGA = 0.10 g and PGA = 0.15 g. For the earthquake scenario of Beni-Ilmane, with PGA = 0.10 g corresponding to Sd = 2.85 cm, the results indicate that the building is at a level of minor damage. In general, the same damage was observed following the earthquake of Beni-Ilmane. For the reference scenario earthquake (PGA = 0.15 g) corresponding to (Sd = 4.5 cm), the results indicate that the building is at a moderate level of damage. As far as building B2 is concerned, for the Beni-Ilmane earthquake scenario with PGA = 0.10 g corresponding to Sd = 5.1 cm, the results show that the building is at a level of moderate to major damage. As for the reference scenario earthquake (PGA = 0.15 g) corresponding to Sd = 10.08 cm, the results show that the building suffered quite extensive damage. By comparing the behavior of the two buildings, one can easily note that building B2 is more vulnerable than building B1.
9. CONCLUSIONS
In this work, a simplified methodology based on the capacity spectrum method (CMS) for` the development of analytical fragility curves was presented. The probabilistic approach of the seismic vulnerability by capacity spectra, based on nonlinear static analysis (pushover), has been used by many researchers because of its simplified analytical models and reduced computation time compared to a nonlinear dynamic analysis. Two basic models of typical residential buildings of medium height (mid-rise) of a high seismic level (High-Code) and moderate seismic level (moderate-code) were investigated for the development of analytical fragility curves expressed in terms of spectral displacement. The fragility curves obtained show that buildings designed in accordance with the new seismic regulations (RPA99 version 2003) are less fragile than buildings constructed earlier (previous RPA 99 versions). Two real cases of buildings affected by the earthquake of Beni-Ilmane 2010 (Msila, Algeria) were chosen for the application of the developed fragility curves. The results of damage levels from the fragility curves are quite close to the results actually observed in the two studied cases. Finally, the fragility curves are of great use in the quantification of physical damage to buildings on the scale of a structure and the scale of a city
.
10. REFERENCES
1. DTR, B., 2 48 regles parasismiques algeriennes. (2003), RPA
99/Version.
2. Davidovici, V., "Rapport preliminaire seisme de boumerdes 21
mai 2003", Alger, Juin, (2003).
Spectral displacement Sd (cm)
p
(>
d
s/
S
D
)
0,0 0,1 0,2 0,3 0,4 0,5 0,6 0,7 0,8 0,9 1,0
0 2 4 6 8 10 12 14 16 18 20
Slight
Moderate Extensive
Complete
PGA=0.1g (Sd=2,85cm) PGA=0.15g (Sd=4,5cm)
Spectral displacement Sd (cm)
p
(>
d
s/
S
d
)
0,0 0,1 0,2 0,3 0,4 0,5 0,6 0,7 0,8 0,9 1,0
0 2 4 6 8 10 12 14 16 18 20 22 24
Slight Moderate Extensive Complete
953 Y. Menasri / IJE TRANSACTIONS A: Basics Vol. 30, No. 7, (July 2017) 945-954
3. Dang, C.-T., "Methodes de construction des courbes de fragilite
sismique par simulations numeriques", Universite Blaise Pascal-Clermont-Ferrand II, (2014),
4. Singhal, A. and Kiremidjian, A.S., "Method for probabilistic
evaluation of seismic structural damage", Journal of Structural
Engineering, Vol. 122, No. 12, (1996), 1459-1467.
5. D’ayala, D.F., "Force and displacement based vulnerability
assessment for traditional buildings", Bulletin of Earthquake
Engineering, Vol. 3, No. 3, (2005), 235-265.
6. Rossetto, T. and Elnashai, A., "A new analytical procedure for
the derivation of displacement-based vulnerability curves for
populations of rc structures", Engineering Structures, Vol. 27,
No. 3, (2005), 397-409.
7. Borzi, B., Pinho, R. and Crowley, H., "Simplified
pushover-based vulnerability analysis for large-scale assessment of rc
buildings", Engineering Structures, Vol. 30, No. 3, (2008),
804-820.
8. Rezaiee-Pajand, M., Bambaeechee, M. and Sarafrazi, S., "Static
and dynamic nonlinear analysis of steel frame with semi-rigid
connections", International Journal of
Engineering-Transactions A: Basics, Vol. 24, No. 3, (2011), 203.
9. Yazdani, A., Razmyan, S. and Hossainabadi, H.B.,
"Approximate incremental dynamic analysis using reduction of
ground motion records", International Journal of
Engineering-Transactions B: Applications, Vol. 28, No. 2, (2014), 190.
10. Freeman, S., "Evaluations of existing buildings for seismic risk-a crisk-ase study of puget sound nrisk-avrisk-al shipyrisk-ard", in Proc. 1st US Nrisk-at. Conf. on Earthquake Engrg., Bremerton, Washington, 1975., (1975), 113-122.
11. ATC, A., "40, seismic evaluation and retrofit of concrete
buildings", Applied Technology Council, report ATC-40.
Redwood City, (1996).
12. Fajfar, P. and Fischinger, M., "N2-a method for non-linear seismic analysis of regular buildings", in Proceedings of the ninth world conference in earthquake engineering. Vol. 5, (1988), 111-116.
13. Standard, E.B.C., "Design of structures for earthquake
resistance", Ministry of Works and Urban Development, Addis
Ababa, Ethiopia, (1995).
14. Mouroux, P. and Negulescu, C., "Comparaison pratique entre les méthodes en deplacement de l’atc 40 (en amortissement) et de l’eurocode 8 (en ductilite), 7eme Colloque National AFPS., (2007).
15. Mander, J.B. and Basoz, N., "Seismic fragility curve theory for highway bridges", in Optimizing post-earthquake lifeline system reliability, ASCE., (1999), 31-40.
16. Siqueira, G.H., "Evaluation de la vulnerabilite sismique des ponts routiers au quebec rehabilites avec l'utilisation d'isolateurs en caoutchouc naturel", Citeseer, (2013),
17. Tariverdilo, S., Farjadi, A. and Barkhordary, M., "Fragility curves for reinforced concrete frames with lap-spliced columns",
International Journal of Engineering-Transactions A: Basics,
Vol. 22, No. 3, (2009), 213-220.
18. Council, B.S.S., "Prestandard and commentary for the seismic
rehabilitation of buildings", Report FEMA-356, Washington,
DC, (2000).
19. FEMA, H.-M., "Mr3 technical manual", Multi-hazard Loss
Estimation Methodology Earthquake Model, (2003).
20. Vacareanu, R., Lungu, D., Aldea, A. and Arion, C., An advanced approach to earthquake risk scenarios with applications to different european towns, report wp7: Seismic risk scenarios handbook. European commission, brussels. (2004).
21. Ruiz‐García, J. and Miranda, E., "Probabilistic estimation of maximum inelastic displacement demands for performance‐
based design", Earthquake Engineering & Structural
Dynamics, Vol. 36, No. 9, (2007), 1235-1254.
22. McKay, M.D., Beckman, R.J. and Conover, W.J., "Comparison of three methods for selecting values of input variables in the
analysis of output from a computer code", Technometrics, Vol.
21, No. 2, (1979), 239-245.
23. Rubinstein, R.Y. and Kroese, D.P., "Simulation and the monte carlo method, John Wiley & Sons, Vol. 10, (2016).
24. Popescu, D.E., Popescu, C. and Gabor, G., "Monte carlo simulation using excel for predicting reliability of a geothermal
Probabilistic Approach to the Seismic Vulnerability of Reinforced Concrete Frame
Structures by the Development of Analytical Fragility Curves
Y. Menasria, M. S. Nouaouriaa, M. Brahimib
a Laboratory of Civil Engineering and Hydraulics, University of Guelma, Algeria b Mechanical Engineering Technology Department at City Tech, New York, USA
P A P E R I N F O
Paper history:
Received 11 January 2017
Received in revised form 15 April 2017 Accepted 21 April 2017
Keywords: Fragility Curves Seismic Vulnerability Nonlinear Analysis Performance Levels Seismic Response Spectrum Pushover ديكچ ه نحنم ی اه ی گدننکش ی ارب ی گ هزادنا یری سآ بی اه ی ف یکیزی داصتقا و ی اه نامتخاس یی دنراد رارق هلزلز ضرعم رد هک
سب رای فم دی ا رد .دنتسه نی نحنم هعسوت هلاقم ی اه ی گدننکش ی لحت یلی رگنایب هک اهراتخاس ی نوکسم ی ن همی هدش هتخاس دنلب
و هب هجوت اب ،حلسم نتب اب یگژی اه ی راتخاس ی خ صا اه نامتخاس ی زجلا ،دنتسه هری .تسا هدش هئارا ندروآ تسد هب
نحنم ی اه ی دننکش یگ لحت یلی ط شور ساسا رب فی
فرظ تی (
CSM
کرت هک ،) یبی زجت زا هی لحت و لی تاتسا کی غ ری طخ ی ( pushover ) زجت اب هی لحت و لی ط فی تسا خساپ دشاب یم . هدهاشم یبایزرا و پ یاهدمای اه هلزلز ی دش دی م ناشن ی دهد سآ هک ی اه نامتخاس هب ب ناسکی
ن ،تسی ا .تسا هباشم اهنآ تخاس دنچره نی
سآ عونت بی م ار ی ز دادعت عونت اب ناوت یدای
لحم تدش دننام لماوع زا ی نوگمهان ،رطخ ی مز نی و و یگژی اه ی ناکم یکی سدنه و ی ضوت هزاس حی اهوگلا و داوم .داد ی
ط فی غتم ناونع هب اضاقت یاهری
فداصت ی ا هدافتسا اب ز نکت کی رادرب هنومن ی تلا نی Hypercube
.دنتفرگ رارق هجوت دروم
اه شور رثکا ی
سآ هک دوجوم بی
م لدم ار اه هزاس هب ی ضرف دننک هی زوت عی لامرن -گول م ار ی ذپ ،دنری لاح رد ی ق هک نونا لامرن -کی گول م لرتنک رتماراپ ود طسوت هک تسا لدم ی
م :دوش نیگنای ب .نآ درادناتسا فارحنا و نآ یار ظنت می ا نی بش ،اهرتماراپ هی زاس ی ( ولراک تنوم
MCS ارب ) ی لوت دی 1000 م ماجنا هنومن ی نحنم .دوش ی اه ی گدننکش ی هدمآ تسد هب زا ا نی لحت لی اه رد عقاو دروم ود ی زا نامتخاس سآ بی د هدی نب هلزلز زا ی -نملیا 2010 سم( ،هلی ازجلا ری ) یارب زرا یبای تراسخ
.دش هتفرگ راک هب
![Figure 2. Capacity spectrum procedure A to determine performance point [11]](https://thumb-us.123doks.com/thumbv2/123dok_us/207125.2015047/3.595.65.266.620.709/figure-capacity-spectrum-procedure-determine-performance-point.webp)