RESEARCH NOTE
A COMPREHENSIVE MODEL FOR R AND D PROJECT
PORTFOLIO SELECTION WITH ZERO-ONE LINEAR
GOAL-PROGRAMMING
M. Rabbani*,R. Tavakkoli Moghaddam,F. Jolai and H.R. Ghorbani
Department of Industrial Engineering, Faculty of Engineering University of Tehran, Tehran, Iran
[email protected] – [email protected] – [email protected] – [email protected]
*Corresponding Author
(Received: April 5, 2004 – Accepted in Revised From: August 9, 2006)
Abstract Technology centered organizations must be able to identify promising new products or process improvements at an early stage so that the necessary resources can be allocated to those activities. It is essential to invest in targeted research and development (R and D) projects as opposed to a wide range of ideas so that resources can be focused on successful outcomes. The selection of the most appropriate projects is the aim of R and D project selection models. The project selection is complicated by many factors, such as vision and preferences of decision makers, allocating the right human resources, interrelationships between projects, and changes over time and success factors that are difficult to measure. In this article we formulate essential factors in R and D project portfolio selection by a mathematical model, which consider a multi- objective function for maximizing corporate benefit through quantitative and qualitative criteria as well as insight and preferences of decision makers and human resource allocation which does not exceed organization’s constraints such as planning horizon, available resources and interrelationships between projects.
Key Words Mathematical Programming, Project Management, R and D Project Portfolio Selection
ﻩﺪﻴﮑﭼ
ﺎﻣﺯﺎﺳﺮﺘﺸﻴﺑﺭﺩ ﻥ
ﻩﮊﻭﺮﭘﻱﺩﺎﻳﺯﺩﺍﺪﻌﺗﻦﻴﺑﺯﺍﺕﺎﻣﺪﺧﺎﻳﻝﻮﺼﺤﻣﻪﻌﺳﻮﺗﻭﻖﻴﻘﺤﺗﻱﺎﻫﻩﮊﻭﺮﭘﺏﺎﺨﺘﻧﺍﺎﻫ
ﻻﻮﻤﻌﻣ ﻪﻛ ﻱﺩﺎﻬﻨﺸﻴﭘ
"
ﻲﻣ ﻲﻘﻠﺗ ﻢﻬﻣ ﺭﺎﻴﺴﺑ ﻭ ﻲﺗﺎﻴﺣ ﻲﻤﻴﻤﺼﺗ ،ﺪﻧﺮﻳﺬﭘ ﻥﺎﻜﻣﺍ ﻪﻌﺳﻮﺗ ﺎﻳ ﺶﻫﻭﮋﭘ ﻱﺍﺮﺑ ﺩﺩﺮﮔ
.
ﻲﻣﺍﺭﻪﻌﺳﻮﺗﻭﻖﻴﻘﺤﺗﻱﺎﻫﻩﮊﻭﺮﭘﺪﺒﺳﺏﺎﺨﺘﻧﺍﺪﻨﻳﺁﺮﻓﺭﺩﻲﻠﺻﺍﺕﻼﻜﺸﻣ ﺩﺎﻳﺯﺩﺍﺪﻌﺗﺩﻮﺟﻭﺭﺩﻥﺍﻮﺗ
ﻲﻤﻛﻑﺍﺪﻫﺍ
ﺪﻧﺭﺎﮔﺯﺎﺳﺎﻧﺮﮕﻳﺪﻜﻳﺎﺑﺐﻠﻏﺍﻪﻛﻲﻔﻴﻛﻭ ،
ﺭﺩﻊﺒﻨﻣﺭﺍﺪﻘﻣﻥﺩﻮﺒﻧﺖﺧﺍﻮﻨﻜﻳ،ﺮﮕﻳﺪﻜﻳﻪﺑﺎﻫﻩﮊﻭﺮﭘﺯﺍﻲﻀﻌﺑﻲﮕﺘﺴﺑﺍﻭ
ﺱﺮﺘﺳﺩ ، ﺼﺨﺘﻣ ﻲﻧﺎﺴﻧﺍ ﻱﻭﺮﻴﻧ ﺩﺍﺪﻌﺗ ،ﻑﺮﺼﻣ ﻥﺍﺰﻴﻣ ﺺ
ﻪﺑﺮﺠﺗ ،ﺶﻨﻴﺑ ،ﺏﺮﺠﻣ ﻭ ،
ﻢﻴﻤﺼﺗ ﻭﻥﺍﺮﻳﺪﻣ ﺕﺎﺤﻴﺟﺮﺗ
ﻚﺴﻳﺭ ﺭﺩ ﻥﺯﺍﻮﺗ ﻱﺭﺍﺮﻗﺮﺑ ،ﻥﺍﺮﻴﮔ ،
ﺖﺴﻧﺍﺩ ﻱﺪﻨﺒﻧﺎﻣﺯ ﻭ ﻞﻴﻤﻜﺗﻥﺎﻣﺯ
.
ﻝﺪﻣ ﻚﻳﺶﻫﻭﮋﭘ ﻦﻳﺍﺭﺩ ﻩﺪﺷﻪﺋﺍﺭﺍ ﻝﺪﻣ
ﺮﻔﺻ ﻑﺪﻫﻱﺰﻳﺭ ﻪﻣﺎﻧﺮﺑ
-ﻲﻣﻲﻄﺧ ﻚﻳ
ﻲﻣﺵﻼﺗﻪﻛﺪﺷﺎﺑ ﻥﺎﮔﺪﻧﺮﻴﮔﻢﻴﻤﺼﺗ ﻪﺑﻪﻨﻴﻬﺑ ﻱﺎﻫﻞﺣ ﻩﺍﺭ ﻪﻳﺍﺭﺍ ﺎﺑﺪﻨﻛ
ﺪﻳﺎﻤﻧﻚﻤﻛ
.
1. INTRODUCTION
R and D project portfolio selection is a critical interface between the product development strategy of an organization and the process of managing projects. There are many different techniques that can be used to estimate, evaluate, and choose project portfolios. Some of these techniques are not widely used because they
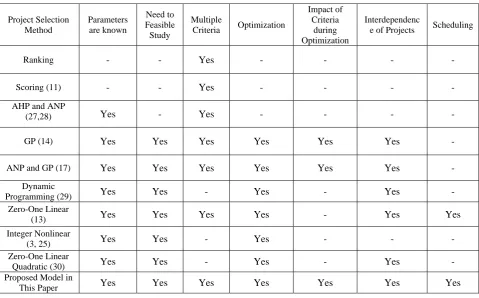
TABLE 1. Suitability of Project Selection Methods for Various Problem Characteristics.
Project Selection Method
Parameters are known
Need to Feasible Study
Multiple
Criteria Optimization
Impact of Criteria
during Optimization
Interdependenc
e of Projects Scheduling
Ranking - - Yes - - - -
Scoring (11) - - Yes - - - -
AHP and ANP
(27,28) Yes - Yes - - - -
GP (14) Yes Yes Yes Yes Yes Yes -
ANP and GP (17) Yes Yes Yes Yes Yes Yes -
Dynamic
Programming (29) Yes Yes - Yes - Yes -
Zero-One Linear
(13) Yes Yes Yes Yes - Yes Yes
Integer Nonlinear
(3, 25) Yes Yes - Yes - - -
Zero-One Linear
Quadratic (30) Yes Yes - Yes - Yes -
Proposed Model in
This Paper Yes Yes Yes Yes Yes Yes Yes
selection methods can usually be placed into one of the following categories:
• Unstructured peer review;
• Scoring;
• Mathematical programming, including integer programming (IP), linear programming (LP), nonlinear programming (NLP), goal programming (GP), and dynamic programming (DP);
• Economic models, such as internal return rate (IRR), Net present value (NPV), return on investment (ROI), Cost-benefit analysis, and option pricing theory;
• Decision analysis, including multi-attribute utility theory (MAUT), decision trees, risk analysis, and the Analytic hierarchy process (AHP);
• Interactive methods, such as Delphi, Q-sort, Behavioral decision aids (BDA), and Decentralized hierarchical modeling (DHM);
• Artificial intelligence (AI), including expert systems and fuzzy sets;
•
Portfolio optimization.organizations make good project portfolio selection. However, these methodologies have some limitations and do not provide a tool to combine all of the relevant R and D project selection criteria into a single model. In this paper a comprehensive model has been introduced which considers all critical issues (which embrace all common R and D project portfolio selection) that are undertaken in a set of typical R and D project portfolio. Table 1 shows a list of prior research and their suitability in problem situation.
2. PROPOSED MODEL
Our proposed model is focusing on solving the mentioned problems and tries to pay attention to them as they are in the real world. Characteristics of this model are:
• Both quantitative and qualitative objectives are considered–There are quantitative and qualitative objectives in every socioeconomic system. For decision makers, ability for implementation of both types of objectives is critical.
• Needs, vision and preferences of decision makers
• Allocation of skilled human resource
• Project scheduling
• Finishing all of the selected projects within the planning horizon
• Variations of consumed resources in different periods
• Sensitivity analysis tools for decision makers
• Projects interdependencies
• Rapid re-calculations to aim decision makers in evaluation of the effects of changes on optimal project portfolio
• Mutually exclusive–in some programs selecting one project removes other projects from portfolio
We describe these characteristics in the next section.
2.1 Model Characteristics Because of its
discrete ‘select or not select’ nature, choosing a project portfolio is inherently a ‘zero-one’ problem. For decision makers rapid re-calculations in evaluation of the effects of changes on an optimalproject portfolio is vital. They must rapidly evaluate and analyze the optimal portfolio on some parameters such as risk and duration. This speed is not currently possible with non-linear optimization algorithms [4].
One of the most critical problems, which the decision makers face, is multiple objectives and multi-criteria in project portfolio selection. They are often conflicting and are not measured in the same unit. The GP technique has already been identified as a promising model for project selection [5] The general goal programming model typically has two sets of constraints: goal constraints and system constraints [6]. Goal constraints represent objectives that are to be fully or partially achieved in a given decision environment. In R and D portfolio selection, goals would reflect objectives such as “maximize the benefits”, “minimize risk or likelihood of failure” and “minimize the cost of a portfolio” etc. System constraints in a GP model limit the decision variables and typically reflect real world restrictions imposed on a given problem. In the R and D project portfolio selection, system constraints would reflect mandatory projects, scarce resources, project interdependencies and etc. These constraints will ensure that the selection provides a feasible set of projects for development. Objective function in a model is a minimum deviation from desired amounts, which is represented in objective constraints. Generally we can say the goal-programming model provides an integrated framework to select a set of projects that are consistent with the goals of the organization [7].
In our model, objective is to select an optimal project portfolio from N proposed projects in the planning horizon with T periods in which we have the least deviation from the following objectives: Minimize total costs which is expressed in each period for every project, Maximize benefits from successful projects, Minimize risk or probability of fail of portfolio in planning horizon, Maximize the qualitative value of portfolio, and Minimize deviation from decision maker’s preferences.
importance in organizing for future success, required by regulations, customer satisfaction, and etc. Meanwhile some objectives are quantitative but the organization could not use them because of lacking sufficient experiments or data. In this case they can estimate them or give them scores. For example NPV or IRR calculations may be a difficult task in organization then they may estimate or rank.
Needs, vision and preferences of decision makers are vital in R and D project portfolio selection. Algorithms should not be used to prescribe solutions without allowing for the judgment, experience, and insight of the decision makers [4]. Consideration of decision makers’ preferences plays an important role in the success of portfolios and acceptance of models.
In research and development organizations human knowledge is the most important and most scarce resource. Allocating the right human resources to a project is vital [8]. In the proposed model we consider a separate constraint for allocation of human resource to R and D project portfolios.
For scheduling at commencement of each project, each project in the model can start in a period t that belongs to planning horizon T. With this feature decision makers can start projects when they have enough resources. If this feature is not considered, all projects must start at the beginning of planning horizon or never start. Since the sources are scarce, some projects might be chosen at other periods.
Finishing all selected projects in planning horizon: All of the selected R and D projects should finish within the planning horizon. With this constraint, decision makers can balance the optimal project portfolio.
Variations of consumed resources in different periods: The amount of resources available to carry out a set of projects may vary over time. Almost none of R and D projects consume resources linearly over their life cycle [15]. This is true for progress and cost deviation of R and D projects.
There are some projects based on special considerations in a portfolio that may not be neglect. In addition decision makers and need a tool for considering some projects in portfolio in a balancing and sensitive fashion. So they may want to omit one or more of them to see the results.
We consider the projects that are being developed. These projects are in progress and consuming organizational resources. Of course with this option decision makers can perform sensitive analysis and balance in the portfolio.
One of the most important issues in R and D project portfolio is projects a interdependency. In the real world some projects are pre-requirement of others. These requirements may be economic, technological, etc. Assumption of independency between all projects in a project portfolio usually is not true.
In some programs we have several alternatives for achieving the target then selecting one project removes other projects from the portfolio projects. In our model the decision maker can define as many as mutually exclusive projects he wants.
2.2 Zero-One Linear GP Model
In regard to model characteristics, we develop a model that covers all constraints and can be considered as a comprehensive model. The model is defined as follows.Decision variables
:
ijX Decision variables 1
Xij= if project
i
is included in portfolio and starts in period j0
Xij= if project
i
in period jis not selected N Total number of projects being proposed T Planning horizon is divided into Tperiodsk
AF Permitted amount of cost for each period k 1
j k i,
C −+ Financing required by project
i
in period k B Expected benefit or income fororganization thorough project portfolio i
b Expected benefit or income from project i RB Maximum benefit under risk that can be
tolerated i
r Risk or chance of failure of project
i
M Total number of skilled human resource inR and D Department i
m Number of skilled people in project i Q Minimum expected value from qualitative
objectives i
q Qualitative weight or score of project i i
i
p The overall preference of decision makers about project
i
P Right-hand-side of preference equation
Goal constraints
The first goal constraint is minimizing total costs where the allowed cost in each period k is AFk and Ci,k−j+1 is the financingrequired by project iin period k − j+1of selected project. T ..., 1, k for N 1 i T 1 j k AF 1 d 1 d ij X 1 j k i, C = ∑ = ∑= = − − + + +
− (1)
i
b is expected benefit or income from project iand expected benefit or income for organization thorough project portfolio is B then the second goal constraint is to maximize benefits from successful projects N 1 i T 1 j B 2 d 2 d ij X i b ∑ = ∑= = − − +
+ (2)
B could also be set to equal a large number that exceeds the sum of the individual benefits.
There is probability of fail for every R and D project due to technical or management-related problems. Risks in R and D have several sources, such as technical, financial, market-related, and administrative. The levels of these risk components typically vary from project to project. Many researchers suggest that the risk level of each project be assessed and the risk profile of selected projects be minimized [9]. In third goal constraint risk of each project i is calculated between zero to one and formulated as below. RB is the maximum risk (in terms of monetary unit) that can be tolerated by company.
B N 1 i T 1 j R 3 d 3 d ij X i b i r ∑ = ∑= = − − +
+ (3)
In R and D projects human resource is crucial. We consider this goal constraint in our model and formulate it to minimize from M-Total number of skilled human resource in Rand D Dept.
N 1 i T 1 j M 4 d 4 d ij X i m ∑ = ∑= = − − + + (4)
Qualitative objectives are our fifth goal constraint. Score
q
i for each projecti
can be obtained by AHP or other appropriate techniques.N 1 i T 1 j Q 5 d 5 d ij X i q ∑ = ∑= = − − +
+ (5)
Sixth goal constraint is overall preference of decision makers and we would like to minimize deviation from decision maker’s preferences. If rank n (n > 1) is the best preferred, for example in Likert scale n is 5, the right-hand-side may be set to a large number.
∑ = ∑= = − − + + N 1 i T 1 j P 6 d 6 d ij X i
p (6)
System constraints
A constraint for ensuring that each project, if selected, will only start once during the planning horizon.
T 1 j N ..., 1, i for 1 ij X ∑
= ≤ = (7)
All of selected projects should finish within the planning of the planning horizon. The following constraints refer to this issue.
N ..., 1, i for T 1 j 1 T i D ij jX = ∑
= + ≤ + (8)
Mandatory projects come in the model by what comes after. Sm is the set of mandatory projects.
∑ = = ∈ T 1 j m S i for 1 ij
X (9)
And similar constraint for ongoing projects which in that So is the in progress projects
o S i for 1 1 i
X = ∈ (10)
constraint. Sd is a set of ongoing projects. d S i for 0 T 1 j ij
X = ∈
∑
= (11)
In some cases, a project cannot be developed unless a related project can be implemented. These situations are to be included as contingency constraints to ensure that the dependent projects are chosen only if its related project is also selected [6]. In the model the implementation of a given project iis contingent upon the implementation of all of the projects in the set Siwhere Si is the number of elements in the set Si. H is set of dependent projects.
∑
∈Si ∑= ≥ ∑= ∈
l T 1 j H i for T 1 j ij X i S lj
X (12)
and constraint 13 guarantees that all of the precursor projects in set of
S
i will be finishedbefore the successor project starts.
H i for i S l all for T 1 j lj X l D T 1 j lj jX Max i
Y ⎟⎟ ∈
⎠ ⎞ ⎜ ⎜ ⎝ ⎛ ∈ ∑ = + ∑ = = H i for i Y ) T 1 j ij X 1 )( 1 T ( T 1 j ij
jX ∑ ≥ ∈
= − + + ∑
= (13)
When we have some versions of one project or there are several solutions for one program we must select one version or solution within several projects. In such cases the following constraint must be added.
p
S is the P th set of mutually exclusive projects.
P ..., 1, p for 1 p S i T 1 j ij
X ≤ =
∑
∈ ∑= (14)
Depending on the situation at hand, we can add several other types of constraints to this model. For example project type, investment type, sponsor(s) of project, number of ongoing or proposed projects, high technology and etc.
The objective function The objective function
will attempt to minimize the sum of the deviations associated with the constraints in the model.) 6 d 12 w 6 d 11 w ( 6 P ) 5 d 10 w 5 d 9 w ( 5 P ) 4 d 8 w 4 d 7 w ( 4 P ) 3 d 6 w 3 d 5 w ( 3 P ) 2 d 4 w 2 d 3 w ( 2 P ) 1 d 2 w 1 d 1 w ( 1 P Min Z
− + + + − + + + − + + + − + + + − + + + − + + = (15) 6
1,...,P
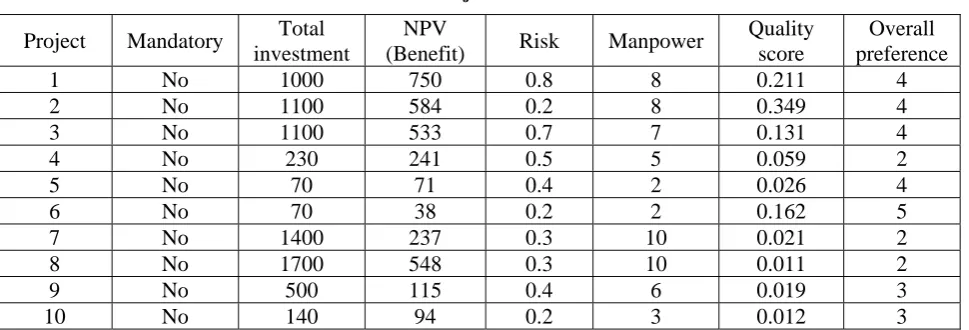
TABLE 2. Projects Information. Overall preference Quality score Manpower Risk NPV (Benefit) Total investment Mandatory Project 4 0.211 8 0.8 750 1000 No 1 4 0.349 8 0.2 584 1100 No 2 4 0.131 7 0.7 533 1100 No 3 2 0.059 5 0.5 241 230 No 4 4 0.026 2 0.4 71 70 No 5 5 0.162 2 0.2 38 70 No 6 2 0.021 10 0.3 237 1400 No 7 2 0.011 10 0.3 548 1700 No 8 3 0.019 6 0.4 115 500 No 9 3 0.012 3 0.2 94 140 No 10
TABLE 3. Projects Information, Costs.
Project 10 Project 9 Project 8 Project 7 Project 6 Project 5 Project 4 Project 3 Project 2 Project 1 Period 25 50 150 200 15 10 25 150 150 90 1 50 125 250 350 25 30 75 400 200 160 2 35 125 350 350 - 20 70 350 300 220 3 30 100 350 300 - 10 60 200 300 220 4 - 100 300 200 - - - - 150 150 5 - - 175 - - - - - - 160 6 - - 125 - - - - - - - 7 - - - - - - - - - - 8
given in1000 in monetary unit. Quality score for each project is calculated by AHP method.
Other information is shown in Table 2 and Table 3.
Our analysis of the problem situation in team reveals the goals cannot be ranked on the basis of preemptive priorities. Therefore a weighted GP model was used for our problem. But the goals are expressed in different measurement units and hence the integration of various goal-deviations in
their original form has no practical significance. For this case we utilized a simple approach of dividing each goal constraint by its target value [5]. Team members and some other exterior experts were our respondents.
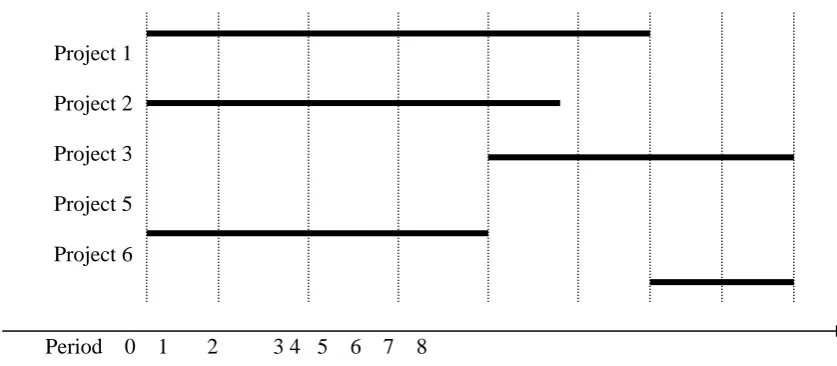
Figure 1. Project 1, 2, 3, 5, and 6 were selected by model as optimal project portfolio and other projects have been removed. Projects 3 and 6 don’t start immediately after planning and they start at periods 5 and 7 respectively. In addition all of them will be finished at the end of planning horizon.
For sensitivity analysis and getting a balanced portfolio we can keep some projects or delete some others thorough constraints 9, 10, and 11.
2.3.1. Discussion
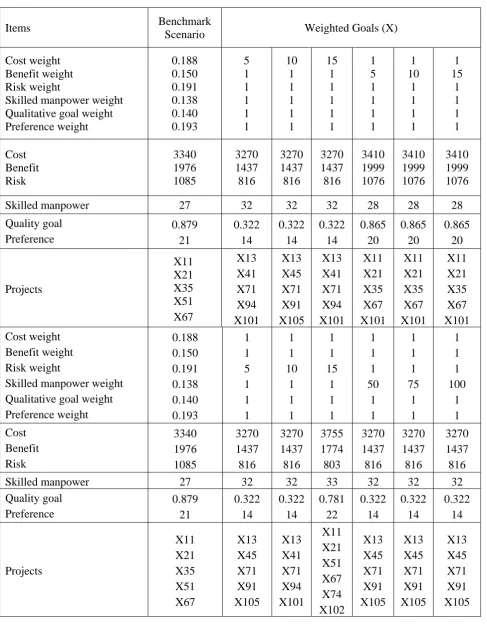
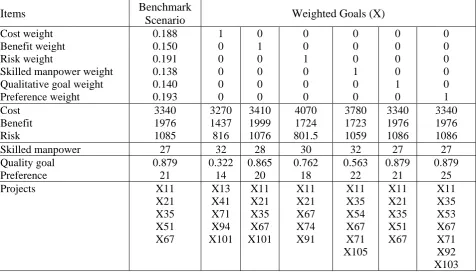
…Since essential factors or goals are distinct, the model provides an appropriate tool for decision makers to reach a consensus due to the changing of each weight hence several modes can be distinguished. The results are shown in table 4. A monetary unit is expressed in 1000. The first column is associated with the basic or benchmark scenario. For this mode total cost is 3340 monetary unit with total benefit of 1976 monetary unit. In addition, qualitative goals and preference satisfaction is fulfilled at almost a maximum possible amount. Also, all employees in R and D section are not put to use.An attempt has further been made to generate some alternative plans, so that the company executives may recognize the most acceptable and appropriate solution depending on current
situation. The following plans or scenarios have been generated.
In the first, plan cost weight has been increased to some degrees while other weights have stayed unchanged. In the first step most projects have been changed, reduction in total benefit has occurred more than total cost and risk. Achievement in qualitative and preference goals has been decreased but numbers of employees are in maximum. As shown in table 4 when the weight of cost has been increased no change occurred. In these situations the beginning of each project is changed.
In the next plan, benefit weight has been increased to some degree while other weights have been stayed unchanged.
In regard to benchmark scenario, total benefit has been increased and other parameters have not changed considerably and increasing the weight of benefit has no effect on the result.
In third plan, weight of risk has changed. The Risk is almost decreased to target value and total benefit is decreased substantially. A noticeable point is the number of projects that have increased to 6 proposals. This may cause an unbalanced project portfolio.
Changing in weight of skilled manpower has no change on solution, as well as two other goals, qualitative and preference.
Project 1
Project 2 Project 3
Project 5
Project 6
Period 0 1 2 3 4 5 6 7 8
TABLE 4. No Preemptive Priorities Results.
Items Benchmark
Scenario Weighted Goals (X)
Cost weight Benefit weight Risk weight
Skilled manpower weight Qualitative goal weight Preference weight 0.188 0.150 0.191 0.138 0.140 0.193 5 1 1 1 1 1 10 1 1 1 1 1 15 1 1 1 1 1 1 5 1 1 1 1 1 10 1 1 1 1 1 15 1 1 1 1 Cost Benefit Risk 3340 1976 1085 3270 1437 816 3270 1437 816 3270 1437 816 3410 1999 1076 3410 1999 1076 3410 1999 1076
Skilled manpower 27 32 32 32 28 28 28
Quality goal Preference 0.879 21 0.322 14 0.322 14 0.322 14 0.865 20 0.865 20 0.865 20 Projects X11 X21 X35 X51 X67 X13 X41 X71 X94 X101 X13 X45 X71 X91 X105 X13 X41 X71 X94 X101 X11 X21 X35 X67 X101 X11 X21 X35 X67 X101 X11 X21 X35 X67 X101 Cost weight Benefit weight Risk weight
Skilled manpower weight Qualitative goal weight Preference weight 0.188 0.150 0.191 0.138 0.140 0.193 1 1 5 1 1 1 1 1 10 1 1 1 1 1 15 1 1 1 1 1 1 50 1 1 1 1 1 75 1 1 1 1 1 100 1 1 Cost Benefit Risk 3340 1976 1085 3270 1437 816 3270 1437 816 3755 1774 803 3270 1437 816 3270 1437 816 3270 1437 816
Skilled manpower 27 32 32 33 32 32 32
In addition, the team examined the results on each individual goal. The results are shown in table 5. At first glance, it can be seen that the number of selected proposals may be larger than 5. In this situation management must pay attention to portfolio balancing. Moreover these results make clear the importance of each goal. For example, when we only notice the management preference goal, the company may be suffered too many projects while the benefit is as equal as the benchmark scenario.
Each of the above plans or scenarios represents a unique situation. These outcomes may be offered to the management for providing information for helping them to make a decision about this problem. Management may also select the most appropriate plan for each portfolio.
3. SUMMARY AND CONCLUSIONS
Project selection is a vital activity in today’s companies. When a variety of promising
alternatives exist, the difficulty in carrying out this task can usually be traced to budgetary constraints, time constraints, risk, and a limited number of personnel and facilities. In addition, each project must be assessed on the basis of multitude of technical and commercial criteria, some of which may not be easily quantifiable.
Some of the features of the goal programming model presented in our paper include the implicit consideration of resource limitations, the ranked consideration of multiple conflicting goals, the ability to combine both quantitative and qualitative criteria, and the intuitive comfort in which the model can be understood by decision makers. A zero-one linear goal-programming model is presented for R and D project portfolio selection and scheduling. The proposed model focuses on the major issues that must be considered in project portfolio selection. For decision makers the model provides a tool to better understand the nature of trade-offs between the different elements that influence the R and D project portfolio.
Further research is required for resource TABLE 5. The Results on Each Individual Goal.
Items Benchmark
Scenario Weighted Goals (X)
Cost weight Benefit weight Risk weight
Skilled manpower weight Qualitative goal weight Preference weight
0.188 0.150 0.191 0.138 0.140 0.193
1 0 0 0 0 0
0 1 0 0 0 0
0 0 1 0 0 0
0 0 0 1 0 0
0 0 0 0 1 0
0 0 0 0 0 1 Cost
Benefit Risk
3340 1976 1085
3270 1437 816
3410 1999 1076
4070 1724 801.5
3780 1723 1059
3340 1976 1086
3340 1976 1086
Skilled manpower 27 32 28 30 32 27 27
Quality goal Preference
0.879 21
0.322 14
0.865 20
0.762 18
0.563 22
0.879 21
0.879 25 Projects X11
X21 X35 X51 X67
X13 X41 X71 X94 X101
X11 X21 X35 X67 X101
X11 X21 X67 X74 X91
X11 X35 X54 X67 X71 X105
X11 X21 X35 X51 X67
interdependencies. In some industries, such as IT, the sharing of hardware and software resources among several projects is common. Incorporating this issue and level of resource interdependencies in the model for some cases is essential.
4. REFERENCES
1. Ghasemzadeh, F. and Archer, N. P., “Project portfolio selection through decision support”, Decision Support Systems, Vol. 29, (2000), 73-88.
2. Henriksen, A. D. and Traynor, A. J., “A practical R and D project-selection scoring tool”, IEEE Transactions on Engineering Management, Vol. 46, No. 2, (May 1999), 279-292.
3. Greiner, M. A., Fowler, J. W., Shunk, D. L., Carlyle, W. M and McNutt, R. T., “A hybrid approach using the analytic hierarchy process and integer programming to screen weapon systems projects”, IEEE Transactions on Engineering Management, Vol. 50, No. 2, (May 2003), 702-715.
4. Loch, C. H., Pich, M. T., Terwiesch, C. and Urbschat, M., “Selecting R and D projects at BMW: a case of adopting mathematical programming models”, IEEE Transactions on Engineering Management, Vol. 48, No. 1, (February 2001), 428-443.
5. Mukherjee, K. and Bera, A., “Application of goal programming in project selection decision – a case study from the Indian coal mining industry”, European Journal of Operational Research, 82, (1995), 18-25. 6. Santhanam, R. and Kyparisis, J., “A multiple criteria
decision model for information system project selection”,
Computers and Operations Research, Vol. 22, No. 8, (1995), 807-818.
7. Badri, M. A., Davis, D. and Davis, D., “A comprehensive 0-1 goal programming model for project selection”,
International of Project Management, Vol. 19, (2001), 243-252.
8. Hendriks, M. H. A., Voeten, B. and Kroep, L., “Human resource allocation in a multi-project R and D environment resource capacity allocation and project portfolio planning in practice”, International Journal of Project Management, Vol. 17, No. 3, (1999), 181-188. 9. Coffin, M. A. and Taylor, B. W., “Multiple criteria R and
D project selection and scheduling using fuzzy logic”,
Computers and Operations Research, Vol. 23, No. 3, (1996), 207-220.
10. Bard, J. F., Balachandra, R., Kaufmann, P. E., “An interactive approach to R and D project selection and termination”, IEEE Transactions on Engineering Management, Vol. 35, No. 3, (August 1988), 420-433. 11. Loch, C. H., Pich, M. T., Terwiesch, C. and Urbschat,
M., “Selecting R and D projects at BMW: a case of adopting mathematical programming models”, IEEE Transactions on Engineering Management, Vol. 48, No. 1, (February 2001), 262-276.
12. Hall, D. L. and Nauda, A., “An interactive approach for
for selecting IR and D projects”, IEEE Transactions on Engineering Management, Vol. 37, No. 2, (August 1990), 395-414.
13. Kim, G. C. and Emery, J., “An application of zero-one goal programming in project selection and resource planning-a case study from the Woodward Governor Company”, Computers and Operations Research, Vol. 27 (2000), 1389-1408.
14. Dickinson, M. W., Thornton, A. C. and Graves, S., “Technology portfolio management: optimizing interdependent projects over multiple time periods”,
IEEE Transactions on Engineering Management, Vol. 48, No. 4, (November 2001), 514-530.
15. Lee, J. W., Kim, S. H., "An integrated approach for interdependent information system project selection",
International Journal of Project Management, Vol. 19, (2001), 111-118.
16. Pillai, S., Joshi, A. and Srinivasa R. K., "Performance measurement of R and D projects in a multi-project, concurrent engineering environment", International Journal of Project Management, Vol. 20, (2002), 165-177.
17. Jin W. L., Soung H. K., "Using analytic network process and goal programming for interdependent information system project selection", Computers and Operations Research, Vol. 27, (2000), 367-382.
18. Kyparisis, G. J., Gupta S. K. and Chi-Ming I., “Project selection with discounted returns and multiple constraints”, European Journal of Operational Research, Vol. 94, (October 1996), 87-96.
19. Tobin, R. L., "Continuious optimization relief period optimization under budget constraints", European Journal of Operational Research, Vol. 139, (2002), 42-61.
20. Steuer, R. E. and Paul N., “Multiple criteria decision making combined with finance: A categorized bibliographic study”, European Journal of Operational Research, Vol. 150, (2003), 496-515.
21. Taru A., “Strategies and methods for project portfolio management”, TU-22.451 Seminar in Project Management, Helsinki University of Technology March 7th, (2000).
22. Cooper, R. G., Edgett S. J. and Kleinschmidt, E. J., "New product portfolio management: practices and performance", Journal of Production and Innovation Management, Vol. 16, (1999), 333–351.
23. Spradlin, C. and Kutoloski, D., “Action-oriented portfolio management”, Research Technology Management, Vol. 42, (1999), 26-32.
24. Archer, N. P. and Ghasemzadeh, F., "An integrated framework for project portfolio selection", International Journal of Project Management, Vol. 17, No. 4, (1999), 207-216.
25. Cooper, R. G., Edgett, S. J. and Kleinschmidt, E. J., "Portfolio management for new product development: results of industry practices study", R and D Management, Vol. 31, No. 4, (2001), 403-420.
26. Jiang, J. J. and Klein, G., “Information system project-Selection criteria variations within Strategic classes”,
IEEE Transactions on Engineering Management,
27. Calantone, R. J., Di Benedetto, C. A. and Schmidt, J. B., "Using the analytic hierarchy process in new product screening", Journal of Product Innovation Management, Vol. 16, (1999), 65-76.
28. Kocaoglu, Dundar F. and Guven Iyigun, M., "Strategic R and D program and resource allocation with a decision support system application", IEEE, Vol. 5, (1994), 321-336.
29. Veronica Chu, Pin-Yu. and Michael Fehling, Yeh-Liang, "A decision support system for project portfolio selection", Computers in Industry, Vol. 32, (1996), 141-149.
30. Rice, R. S., "Discrete optimizing solution procedures for linear and nonlinear integer programming problems",
Management Science, (1966), 829-850.
31. Pasek, Zbignew J., “R and D project portfolio allocations in an engineering research center planning process”,
Portland International Conference on Management of Engineering and Technology, Vol. 3, No. 3, (2004), 240-251.