TECHNICAL NOTE
A COMPARISON OF UNDERGROUND OPENING SUPPORT
DESIGN METHODS IN JOINTED ROCK MASS
M. Gharavi*
College of Civil Engineering, Iran University of Science and Technology P.O. Box 16846, Tehran, Iran
N. Shafiezadeh
Department of Civil and Environment Engineering, University of Alberta P.O. Box T6G 2W2, Edmonton, Canada
*Corresponding Author
(Received: January 9, 2008 – Accepted in Revised Form: May 9, 2008)
Abstract It is of great importance to consider long-term stability of rock mass around the openings of underground structure, during design, construction and operation of the said structures in rock. In this context, three methods namely, empirical, analytical and numerical have been applied to design and analyze the stability of underground infrastructure at the Siah Bisheh Pumping Storage Hydro-Electric Power Project (HEPP) in Iran. The geological and geotechnical data utilized in this article were selected and based on the preliminary studies of this project. In the initial stages of design, it was recommended that, two methods of rock mass classification Q and RMR should be utilized for the support system of the underground cavern. Next, based on the structural instability, the support system was adjusted by the analytical method. The performance of the recommended support system was reviewed by the comparison of the ground response curve and rock support interactions with surrounding rock mass, using FEST03 software. Moreover, for further assessment of the realistic rock mass behavior and support system, the numerical modeling was performed utilizing FEST03software. Finally both the analytical and numerical methods were compared, to obtain satisfactory results complimenting each other.
Keywords Empirical Method, Analytical Method, Numerical Method, Ground Response Curve, Design, Stability Analysis
ﻩﺪﻴﮑﭼ
ﻩﺯﺎﺳ ﻚﻳ ﻱﺭﺍﺪﻳﺎﭘ ﻞﻴﻠﺤﺗ ﻭ ﻲﺣﺍﺮﻃ ﻱﺩﺪﻋ ﻭ ﻲﻠﻴﻠﺤﺗ ،ﻲﺑﺮﺠﺗ ﺵﻭﺭ ﻪﺳ ﻲﺳﺭﺮﺑ ﻪﺑ ﻖﻴﻘﺤﺗ ﻦﻳﺍ ﺭﺩ
ﺖﺳﺍ ﻩﺪﺷ ﻪﺘﺧﺍﺩﺮﭘ ﻲﻨﻴﻣﺯﺮﻳﺯ ﮒﺭﺰﺑ .
ﻱﺎﻨﺒﻣ ﺮﺑ ﻪﻟﺎﻘﻣ ﻦﻳﺍ ﺭﺩ ﻩﺩﺎﻔﺘﺳﺍ ﺩﺭﻮﻣ ﻲﻜﻴﻨﻜﺗﻮﺋﮊ ﻭ ﻲﺳﺎﻨﺷ ﻦﻴﻣﺯ ﺕﺎﻋﻼﻃﺍ
ﺖﺳﺍ ﻩﺪﺷ ﺏﺎﺨﺘﻧﺍ ﻪﺸﻴﺑ ﻩﺎﻴﺳ ﺡﺮﻃ ﻩﺎﮔﻭﺮﻴﻧ ﺭﺎﻐﻣ ﻩﺎﮕﺘﺧﺎﺳ ﻪﻴﻟﻭﺍ ﺕﺎﻌﻟﺎﻄﻣ .
ﺘﺑﺍ ﺭﺩ ﻭﺩ ﺎﺑ ﺭﺎﻐﻣ ﻱﺭﺍﺪﻬﮕﻧ ﻢﺘﺴﻴﺳ ،ﺍﺪ
ﻲﺳﺪﻨﻬﻣ ﻱﺪﻨﺑ ﻪﻘﺒﻃ ﺵﻭﺭ
RMR
ﻭ
Q
ﻲﻣ ﺩﺎﻬﻨﺸﻴﭘ ﺩﻮﺷ
. ﻱﺭﺍﺪﻳﺎﭘﺎﻧ ﻝﺮﺘﻨﻛ ﺱﺎﺳﺍ ﺮﺑ ،ﻲﻠﻴﻠﺤﺗ ﺵﻭﺭ ﺎﺑ ﺲﭙﺳ ﻱﺎﻫ
ﻲﻣ ﻪﺘـﺧﺍﺩﺮﭘ ﻱﺭﺍﺪﻬـﮕﻧ ﻢﺘﺴﻴﺳ ﺢﻴﺤﺼﺗ ﻭ ﻞﻳﺪﻌﺗ ﻪﺑ ﻱﺭﺎﺘﺧﺎﺳ ﻲﻨﺤﻨﻣ ﻢﺳﺭ ﺎﺑ ﻱﺩﺎﻬﻨﺸﻴﭘ ﻢﺘﺴﻴﺳ ﺩﺮﻜﻠﻤﻋ ﻭ ﺩﻮﺷ
ﺭﺍﺰﻓﺍ ﻡﺮﻧ ﺯﺍ ﻩﺩﺎﻔﺘﺳﺍ ﺎﺑ ﻦﻴﻣﺯ ﺭﺎﺘﻓﺭ ﻪﺼﺨﺸﻣ
FEST03
ﮓﻨﺳ ﻩﺩﻮﺗ ﻭ ﺩﻮﺟﻮﻣ ﻱﺭﺍﺪﻬﮕﻧ ﻢﺘﺴﻴﺳ ﺶﻨﻛﺭﺪﻧﺍ ﻦﻴﻴﻌﺗ ﻭ
ﻲﻣ ﺭﺍﺮﻗ ﻲﺳﺭﺮﺑ ﺩﺭﻮﻣ ﻩﺯﺎﺳ ﻑﺍﺮﻃﺍ ﺩﺮﻴﮔ
. ﻖﻴﻗﺩ ﻲﺳﺭﺮﺑ ﺭﻮﻈﻨﻣ ﻪﺑ ﻪﻣﺎﻧﺮﺑ ﺎﺑ ﻱﺩﺪﻋ ﻝﺪﻣ ،ﮓﻨﺳ ﻩﺩﻮﺗ ﺭﺎﺘﻓﺭ
FEST03
ﻲﻣ ﻪﻌﻟﺎﻄﻣ ﻱﺮﺘﺸﻴﺑ ﺖﻗﺩ ﺎﺑ ﻱﺭﺍﺪﻬﮕﻧ ﻢﺘﺴﻴﺳ ﻭ ﮓﻨﺳ ﻩﺩﻮﺗ ﺭﺎﺘﻓﺭ ﻭ ﻩﺪﺷ ﻪﺘﺧﺎﺳ ﺩﺩﺮﮔ
. ﻦﻴﺑ ﻱﺍ ﻪﺴﻳﺎﻘﻣ ﺰﻴﻧ ﺎﻬﺘﻧﺍ ﺭﺩ
ﻭﺭ ﻭﺩ ﻲﻣ ﻡﺎﺠﻧﺍ ﻱﺩﺪﻋ ﻭ ﻲﻠﻴﻠﺤﺗ ﺵ ﺖﻳﺎﺿﺭ ﻲﻧﺎﺷﻮﭙﻤﻫ ﻭ ﻕﺎﺒﻄﻧﺍ ﺯﺍ ﻲﻛﺎﺣ ﻪﻛ ﺩﻮﺷ
ﻭﺩ ﻦﻳﺍ ﺯﺍ ﻞﺻﺎﺣ ﺞﻳﺎﺘﻧ ﺶﺨﺑ
ﻲﻣ ﺵﻭﺭ ﺪﺷﺎﺑ .
1. INTRODUCTION
Generally, for the stability analysis of underground
methods is very important and essential, due to reasons relative to increased accuracies that are versatile in the applied methods i.e. empirical to numerical. In the preliminary design phase, the empirical method is used and analytical approach is considered in the following phase. In the final stage of study, the numerical method is applied. In fact, these three methods are in a way associated and in the process can accomplish an appropriate underground structural design. In the preliminary stage of design, a complete and accurate data cannot be accessed. The preliminary stage is undertaken with a quick assessment of a simple empirical method. The surrounding rock mass behaviour and support system are considered, along with primary appraisal. The designing process continues in a more complex analysis after careful observation of rock mass behaviour and support system, with the application of obtained data. In this article, a case study of the Pumping Storage HEPP Project is presented in support of the adopted design philosophy.
2. SIAH BISHE PUMP STORAGE PROJECT
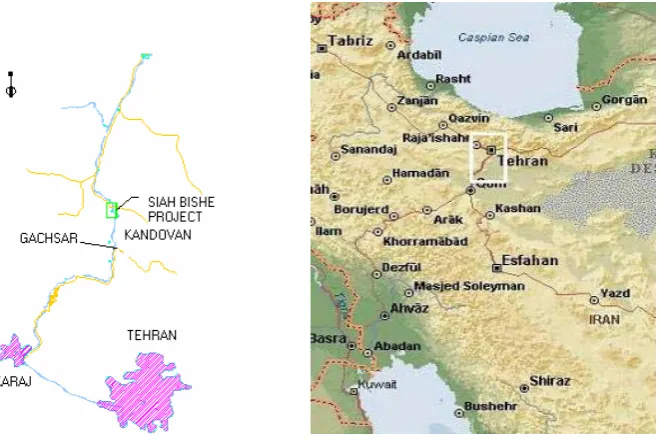
The Siah Bishe pump storage HPP is located 125 km north of Tehran-Iran in the elevations ranging from 1900 to 2400 m from sea level (Figure 1). The aims of the project are:
Hydropower generation of 1000 MW (4*250 MW) during peak load.
Energy saving during base load by pumping storage.
Frequency control and stabilization of grid and
A prominent consumer during low load.
The geological features and geotechnical characteristics of the rock mass in the powerhouse location are described in the following section.
2.1. Regional Geology of Project Site
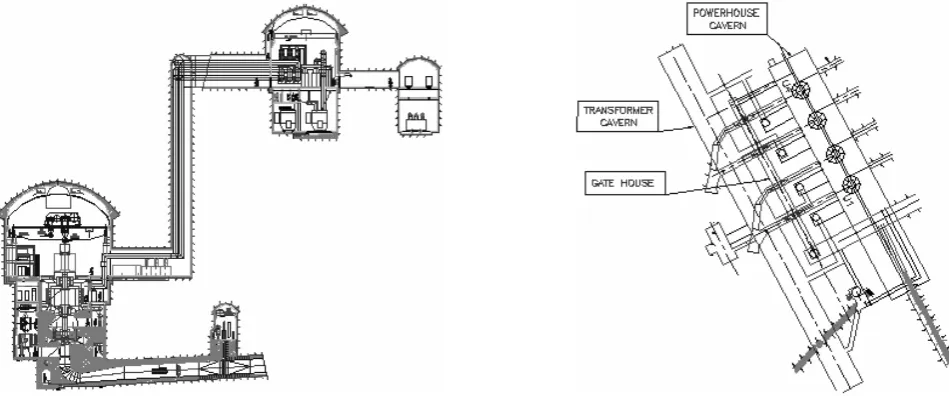
Thisproject comprises of two dams that are to be constructed at the upper and lower elevation of the Chalus River. The underground power plant and the appurtenance structures are; the headrace, inclined and tailrace tunnels, power and
transformer caverns and the bus duct galleries. The geometrical specifications of these structures are presented in Table 1 [1].
According to Iranian geological classifications, the foundation of the project is categorized under the Alborz structure block. The block is formed in the Alpian orogensis phase and its boundaries are distinguished by steep faults. According to structural features, Siah Bisheh is located in the elevated northern foothills of the Alborz mountain range. The most considerable characteristics of this region are the geological series that have been intercepted by steep faults. Geological studies have shown that the formation at the locations of the caverns belong to the Permian period. Both the transformer and main cavern are located in the Dorood formation, which consists of sedimentary rocks, namely, quartzitic sandstone, shale, mudstone and limestone. There are three types of igneous rocks in the region, such as, dacite spilitic basalt (Melaphir) and latite. The underground power plant location is shown in the Figure 2. As per performed statistical analysis, the measured dip, and dip direction of discontinuities in the region, the major discontinuities, amount of medium dip and their dip direction were determined. In general, five series of dominant discontinuities have been distinguished in the location of underground powerhouse structures, and their geometrical features are presented in Table 2 [2].
2.2. Geotechnical Parameters of Intact Rock
and Discontinuities
The requiredgeomechanical parameters were determined for various existing layers affecting the underground powerhouse structure and are presented in Table 3 [3]. The specific weight (density) of quartzitic sandstone, shale and melaphir were determined as 0.0275, 0.0265 and 0.029 MN/m3 respectively.
3. EMPIRICAL DESIGN
Figure 1. Location of the Siah Bishe pump storage project.
TABLE 1. Geometrical Specification of Underground Power Plant.
Underground Structures Dimensions(m)
(length×width×heigth) Elevation(m)
Powerhouse Cavern 130×22×41 1876
Transformer Cavern 182×13×22 1909.5
Cable Gallery 25×7×7 1902.75
Gate Gallery 100×4.5×8 1851
Generally, during the primary stages of design and subsequent phases of studies, these two methods are applicable. The RMR method was first presented by Bieniawski, et al [4]. The rock mass quality is considered by six parameters. These parameters include Uniaxial compressive strength of intact rocks, rock quality designation (RQD), and spacing of discontinuities, condition of discontinuities, ground water conditions and the orientation of discontinuities in relation to the orientation of the structure.
The Q method recommended by Barton, et al [5],
Figure 2. Configuration of the underground power complex structures.
TABLE 2. Geometrical Features of Dominant Discontinuity Systems in Siah Bisheh Powerhouse Complex [2].
Discontinuities Dip/Dip Direction Spacing(m)
Bedding 60/188 0.32
J1-1 38/028 3
J1-2 56/048 2.24
J1-3 65/330 2 J2 90/082 3
TABLE 3. Mechanical Properties and Elastic Parameters of Various Intact Rocks and Dominating Discontinuities.
Mechanical Parameters Elastic Parameters Lithologes and
Joints (MPa) C
σ σt(MPa) c(MPa) φ(o) ψ(o) E(MPa) υ
Sandstone 100 6 18 50 25 15000 0.25
Shale 50 3 12 40 20 7500 0.3
Melaphir 100 6 18 50 25 15000 0.25
Bedding - 0 0 25 12.5 - -
J1-1 - 0 0.05 27.5 14 - -
J1-2 - 0 0.05 27.5 14 - -
J1-3 - 0 0.05 27.5 14 - -
TABLE 4. The results of rock mass classifications.
RMR Q
Rate Rate
Parameters
Sandstone Shale Melaphir Parameters Sandstone Shale Melaphir
UCS 9.5 5.5 9.5 RQD 100 100 100
RQD 20 20 20 Jn 15 15 15
Joint Spacing 20 20 20 Jr 3 2 3
Condition of
Discontinuities 12 8 14 Ja 1 1 1
Ground Water Condition 10 10 15 Jw 0.66 0.66 0.66 Correlation with Structural
Orientation -5 -5 -5 SRF 1 2 1
RMR 66.5 58.5 71.5 Q 13.2 4.4 13.2
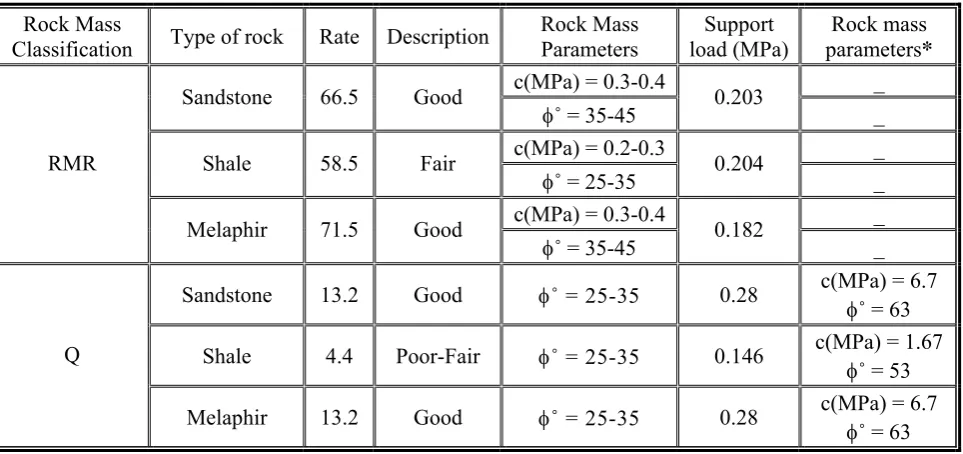
TABLE 5. Parameters of Rock Mass for the Design of Cavern Structure.
Rock Mass
Classification Type of rock Rate Description
Rock Mass Parameters
Support load (MPa)
Rock mass parameters*
c(MPa) = 0.3-0.4 _
Sandstone 66.5 Good
φ˚ = 35-45 0.203 _
c(MPa) = 0.2-0.3 _
Shale 58.5 Fair
φ˚ = 25-35 0.204 _
c(MPa) = 0.3-0.4 _
RMR
Melaphir 71.5 Good
φ˚ = 35-45 0.182 _ Sandstone 13.2 Good φ˚ = 25-35 0.28 c(MPa) = 6.7
φ˚ = 63 Shale 4.4 Poor-Fair φ˚ = 25-35 0.146 c(MPa) = 1.67
φ˚ = 53 Q
Melaphir 13.2 Good φ˚ = 25-35 0.28 c(MPa) = 6.7 φ˚ = 63 *According to Ramamurthy [6]
)(MPa) 100ci
σ )( SRF
1 )( Js RQD ( j0
c = (1)
) a J
w J r J ( 1 tan
j= −
ϕ (2)
Where, Js is joint set number (Barton uses Jn instead) [6]. The last column of Table 6, specified for the evaluation of these two important geotechnical parameters that are according Ramamurthy’s suggestion.
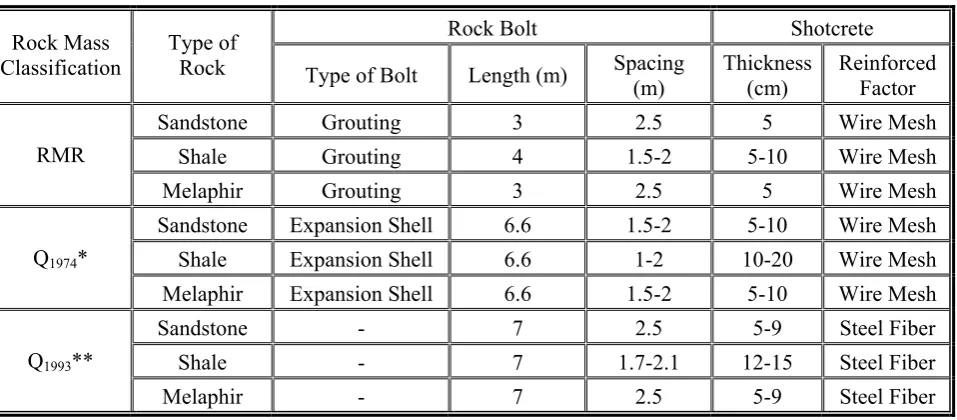
TABLE 6. Recommended Engineering Support Systems Using RMR and Q Methods.
Rock Bolt Shotcrete
Rock Mass Classification
Type of
Rock Type of Bolt Length (m) Spacing (m)
Thickness (cm)
Reinforced Factor
Sandstone Grouting 3 2.5 5 Wire Mesh
Shale Grouting 4 1.5-2 5-10 Wire Mesh
RMR
Melaphir Grouting 3 2.5 5 Wire Mesh
Sandstone Expansion Shell 6.6 1.5-2 5-10 Wire Mesh Shale Expansion Shell 6.6 1-2 10-20 Wire Mesh
Q1974*
Melaphir Expansion Shell 6.6 1.5-2 5-10 Wire Mesh
Sandstone - 7 2.5 5-9 Steel Fiber
Shale - 7 1.7-2.1 12-15 Steel Fiber
Q1993**
Melaphir - 7 2.5 5-9 Steel Fiber
According to Barton* [4], ** [7]
classification is also presented in Table 6 for further reference.
The advantages of RMR as a system of rock mass classification are as follows:
• It almost has all the features of rock mass classification and is very easy to use,
• It has found wide applications in various type of engineering projects, not only for underground structures but also for slopes and foundations,
• Enables an estimation of rock supporting system,
• Assesses a stand-up time and the maximum stable rock span,
The disadvantages of this system are:
• In this method, the in-situ stress has not been considered,
• It is assumed to be applicable to elastic condition and not for dynamic circumstances (like seismic loads),
• For portals and intersections, modification in the support system has not been considered, • The suggested support system is for specific
shape and not to be used for all shapes,
• If several underground openings are excavated near each other, the intersections of the structures crossing each other have not been taken into account.
The advantages of Q system are:
• Some characterizations of a good classification system are considered,
• This system has a suggestion for considering the effect of dynamic loading,
• For different spans and class of rocks, the necessary support can be evaluated,
• For portals, intersections and structure wall, it suggests separate supports,
• The relationship between the index Q and the equivalent dimension of an excavation, it determines an appropriate measure for support.
• The maximum unsupported span can be obtained by this system, and
• The discontinuities and their condition are considered better.
The disadvantages of Q system are:
• The effect of strike and dip of discontinuities on the orientation of tunnels have not been considered,
• Because of high probable error in identification of parameters and the relation between these parameters in estimating Q, can cause an increase or decrease of Q value to many times of its real value; many categories of rock support system are likely to be gained.
The Limitations of the RMR and Q systems in predicting the strength and modulus of rock mass have been adequately discussed by Ramamurthy, et al [6].
It must be mentioned that the recommended support system using the RMR method is considered for a horseshoe tunnel with a width of 10 m outlet and a vertical stress of less than 25MPa, excavated by drilling and blasting. Consequently, the supporting structure needs to be adjusted according to its performance and the response of rock mass. In addition to which, the suggested support system, is the least support system and it also is the primary estimation. In the subsequent design phases, it is modified per other applicable methods of stability analysis.
4. ANALYSIS
In the analysis both induced stresses and structural instability of an underground excavation are considered.
For the design of a support system for an underground structure, the use of an analytical method is based on the analysis of a structural instability and rock-support interaction analysis. In the analysis of a structural instability, the size and the shape of an unstable wedge of a rock mass surrounding the structure, size and shape, orientation of structure and discontinuity directions dominant in the region have to be considered. The three-dimensional geometrical calculation of the structure is time consuming and frustrating. Although the calculations can be carried out manually, in spite of a great waste of time; In order to obtain better efficiency and competency, it is advisable to use the related software. There are
packages designed for underground structures based on the block theory, entitled “KB Tunnel” and “Unwedge”. Although the unwedge has an overestimation of block weight due to a simplification of its assumptions, it also overestimates the safety factor taking into consideration the shotcrete as a support, because of its formulation for calculating this parameter. For the present study only this software was available and was used for structural instability analysis. The required parameters for the analysis are presented in Section 2. Due to the longitudinal axis of the power house cavern orientated in N150E and also due to the existence of five series of discontinuities dominant in the region, the characteristics of the largest wedge with a probable potential of falling block or sliding is expected. The characteristics and the potentials of the largest unstable wedges in the surroundings of the cavern structure are also presented in Figure 3 and Table 7.
The design parameters of rock bolt in the roof and the walls of the powerhouse cavern are determined on the basis of the relative operational mechanisms i.e. hidden arch mechanism, falling blocks and sliding blocks mechanisms. The parameters considered include bolt length, bolts spacing, support pressure, bolt load, bolt diameters and bolt load capacity.
The same process is repeated in other structures of the powerhouse complex. The results define the rock bolt support system design in the underground powerhouse structures comprised of four power house and transformer caverns, gate and cable galleries, Table 8.
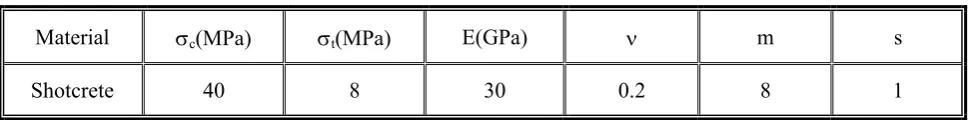
Generally, in the design of an underground infrastructure support system, a combined method of rock bolt and shotcrete is applied. In order to design the required shotcrete, a thickness of 20 cm was calculated for two powerhouse and transformer caverns and 10 cm for two gates and cable galleries using the existing equations and shotcrete parameters. It must be noted that the types of shotcrete in use are SFRS (steel fiber reinforced shotcrete) and dry mix.
(a) (b) (c)
Figure 3. Characteristics of largest wedge potentially unstable around cavern powerhouse in N150E orientation (a) Roof, (b) Western wall and (c) Eastern wall.
TABLE 7. Characteristics of Largest Wedge Potentially Unstable Around Cavern Powerhouse in N150e Orientation.
Wedge Weight(ton) Area(m2) FOS location Type of Failure
Wedge Number 1 2979 272.5 0 Roof Fall
Wedge Number 2 926 279 0.27 Western Wall Slide on J1-2 Wedge Number 3 12770 878 0.7 Eastern Wall Slide on Bedding
house cavern can not be defined or is non-symmetric in stress distribution (K0 = 0.85) in the jointed media, then the ground response curve is considered, using a numerical analysis with FEST03 code.
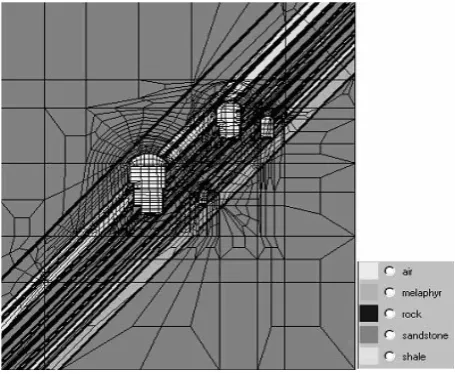
Figure 4 represents the pseudo three-dimensional numerical model for the roof, walls and floor displacement in the powerhouse cavern and stability analysis of the structures. The dimensions of each underground space of the Siah Bisheh Powerhouse Complex are indicated in Table 1.
According to the above, Figure 4 depicts one of the quasi-three dimensional models which have been used in this study, to obtain the ground response curve and stability analysis. The external boundaries of the model were selected with regard to the influence of each on the formation.
The overburden was modeled by distributed
loading, which acts on top of the model. The maximum height of the overburden is 256 meters on the power house cavern and 205 meters on the transformer roof. Results of over coring tests indicated that the KO ratio (the ratio of horizontal to vertical stress) is 0.85. The load applied by underground water was simulated by a linear loading distribution which acts on the lateral boundaries of the model. The linear load is increased with increasing depth. All the nodes in the computational section are fixed in Y = 0 and Y = 1 planes, and the entire bottom nodes are fixed in the Z direction.
TABLE 8. Geometrical Features of Dominant Discontinuity Systems in Siah Bisheh Powerhouse Complex [2].
Location Type Length* (m) Spacing (m) Diameter (mm) Capacity (ton) Final Loading Pretension Rate (ton)
Roof Pretension Grouted Bolt
12 4
1 * 1 1.5 * 1.5
28 28 30 30 23 23 Western
Wall Grouted Bolt Pretension 12 4 2.5 * 2.5 1.5 * 1.5 28 28 30 30 23 23 Powerhouse Cavern Eastern Wall Pretension Grouted Bolt 12 4
1.5 * 1.5 1.5 * 1.5
28 28 30 30 23 23 Roof Grouted Bolt Pretension 9 3 1.1 * 1.1 1.5 * 1.5 28 28 30 30 23 23 Western Wall Pretension Grouted Bolt 9 3
2.6 * 2.6 1.5 * 1.5
28 28 30 30 23 23 Transformer Cavern Eastern Wall Pretension Grouted Bolt 9 3 1.5*1.5 1.5*1.5 28 28 30 30 23 23 Roof Grouted Bolt Pretension 6 1.5 * 1.5 28 30 23 Western
Wall
Pretension
Grouted Bolt 6 2.3 * 2.3 28 30 23
Cable Gallery
Eastern Wall
Pretension
Grouted Bolt 6 1.75 * 1.75 28 30 23
Roof Pretension
Grouted Bolt 6 2 * 2 28 30 23
Western Wall
Pretension
Grouted Bolt 6 2.75 * 2.75 28 30 23
Gate Gallery
Eastern Wall
Pretension
Grouted Bolt 6 2 * 2 28 30 23
(*) Bolt installation is considered in such a way that one-third length of hole is injected prior to installation and after installation of bolt, the residual span is injected.
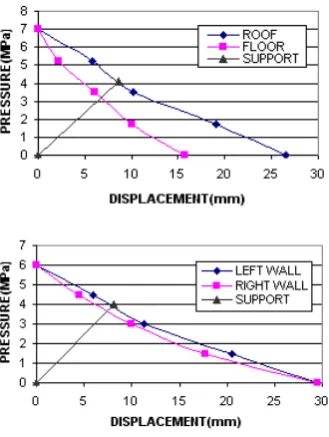
With respect to in-situ stresses on regional structures, a vertical stress of 7MPa for roof and floor, and a horizontal stress of 6MPa for the eastern and western walls of the powerhouse cavern were considered (where K0 = 0.85). In addition, the roof, walls and floor displacement were recorded. The curves indicate the rate of displacement from applied stresses and ground response. Figure 5 presents the curves from the analysis.
Figure 4. Constructed numerical model.
(a)
(b)
Figure 5. Ground response curves on (a) roof and floor and (b) walls.
KC = 576 MPa psmax = 0.72 MPa
The stiffness and maximum pressure of pretension grouted bolts are also easily calculated. The calculated parameters are briefed according to Table 10.
Kb = 24.76 MPa psmax = 0.24 MPa
For the combined rock bolt and shotcrete method for the support system, the calculated parameters can not be considered in isolation and the maintenance of calculations is obligatory for further verifications. Based on the available equations, the rate of displacement is then calculated.
Umax 1 = 0.014 m for Shotcrete Umax 2 = 0.1 m for Bolt
U12 = 0.13 m
for Combined support system The following equation for support line for the combined support system is used [8].
smax12 p 2 k 1 k ir max1 u
+
= (3)
Figure 6 indicates the assimilation of ground response curve and the available support line for the combined support.
The point where ground response curve intersects the support system, (Figure 6) is assumed as a system equilibrium point and displacement halt. Therefore, it can be concluded that a combined support system of shotcrete and rock bolt is quite a convenient application.
5. NUMERICAL ANALYSIS AND FEST03 SOFTWARE
TABLE 9. Properties of Applied Shotcrete.
Material σc(MPa) σt(MPa) E(GPa) ν m s
Shotcrete 40 8 30 0.2 8 1
TABLE 10. Designed Data of Rock Bolt System.
Parameter Type L(m) D(m) Eb(MPa) Tbf(MN) Q(m/MN) SC(m) SL(m) Pretension Grouted bolt 12 0.028 2 * 105 0.55 0.1 1.5 1.5
the application of the appropriate theories and adopt the design method. This is also adopted in the modeling of engineering projects in jointed rock mass. When the “sample” of a rock mass being considered is as such that, only a few joints are contained in its volume, its behaviour is likely to be highly anisotropic, and it is considered as discontinuous. If the sample size is many times larger than the size of the individual fragment, the effect of each particle (and hence the joints) is statistically leveled out, and the sample may be considered continuous. Deere, et al has linked the “sample” size to the size of an opening from its stability consideration. Whereas, the stability of an opening in a continuous material can be related to the intrinsic strength and deformation properties of the bulk material, stability in a discontinuous material depends primarily on the character and spacing of the discontinuities. In this connection they have found that the size of the “sample” related to an opening should be considered discontinuous when the ratio of the fracture spacing to an opening diameter is between the approximate limits of 1/5 and 1/100. For a range outside these limits, the rock may be considered continuous, though possibly anisotropic [9].
Considering the number and spacing of the existing discontinuities in the Siah Bisheh Powerhouse Complex, the rock mass behaviour was considered to be continuous. Consequently, in the modeling and numerical analysis a finite element
software package was used. FEST03 software was first developed by Wittke, et al [10,11] to distinguish the stress- strain behaviour of jointed rock masses. Therefore, the stability analysis of series of discontinuities became feasible. In this model, it is assumed that the medium in discontinuities and the relative mechanical parameters indicate a series of existing discontinuities in each rock mass region. When utilizing a homogeneous model, in the case where the dimensions of study area under, or the engineering structures in comparison with discontinuities and spaced restrained blocks are macro, which results in a substantiated coherent conclusion. The package allows stresses, displacement calculations in pseudo-three dimensional rock engineering problems with stress-strain behaviour, linear elastic-viscoplastic and anisotropic assumptions. In addition, desired boundary conditions and stage sequencing of structure and execution of underground infrastructures are available.
Figure 6. Interactions of support system with rock mass in powerhouse cavern surrounding.
Figure 7. Sequence of excavation of underground structures.
Figure 8. Implemented shotcrete and rock bolt support
system.
The modeling of shotcrete/rock bolt support system was as such that, after excavation; the designed support system is installed immediately. The shotcrete support system simulation was done using special elements incorporated specifically in FEST03 [12]. The rock bolt support system was implemented by calculating the equivalent
distributed load on the boundary. Figure 8 presents the cavern in the implemented support system. In each stage of excavation, the main stress conditions and plastic zone surrounding the cavern in addition to nodal point, displacements were presented by computer outputs. Furthermore, the time versus displacement curve observed in the roof and walls of the cavern (analogous with dislocation point of the ground response curve in previous section) can be reviewed. In all stages of implementation, the recent curve describes a displacement of equilibrium in the observed points. Ultimately, the calculated curve dislocation from stages 2-18 of observations was drawn in the west and east of cavern roof and walls in correlation with iterative time of each repeated stage. Curves in Figure 9 demonstrate the trend.
(a)
(b)
(c)
Figure 9. Calculated total displacements from stages 2-18 in observed points (a) Cavern roof (b) Western wall of the cavern, and (c) Eastern wall of the cavern (IT [-] mention to the maximum number of iteration in time-step analysis for performing viscoplastic iteration in any calculation step).
6. CONCLUSION
This paper provided an expert introduction to review important methods of stability analyses.
Comprehensive coverage of observational and analytical methods and also numerical modeling techniques for solving problems related to underground excavations in fractured rock masses is given. The techniques can take into account the influence of discontinuities, time dependent behaviour and the phenomena introduced by the construction method. The numerical modeling deals with the finite element based approach for simulating jointed rock masses which provides solutions for the deformation and strength equivalence treatment of single, collinear and multiple discontinuities.
The stability of the Siah Bishe Pumping Storage Hydro-Electric Power Project (HEPP) was analyzed through different approaches using these Methods. The comparison of results obtained by these analyses indicates the following.
A single stability analysis and design method cannot be applied in the design of a support system for an underground structure. On the contrary, multiple approaches are advisable. Empirical methods can only provide primary estimations of structural stability and is the general indicator of the type and quantity of required support system. Amongst various stability analyses, numerical methods, which are considered as a complement to the empirical method, have found a distinctive place in underground structures stability analysis and design.
To prove the accuracy of the ground response curve using the numerical method, it is recommended to monitor the behaviour of the rock mass, around the underground structures during construction phase, to obtain the actual ground response curve and compare it with numerical result.
7. NOMENCLATURE
RMR Rock Mass Rating
RQD Rock Quality Designation
Q Rock Mass Quality Rating
(Range 10-3 to 103)
ν Poisson Ratio
γ (MN/m3) Rock Mass Density c (MPa) Cohesion of Rock Mass
Φ (degrees) Friction Angle
σC (MPa) Uniaxial Compression Strength
σt (MPa) Tension Strength
Ψ (degrees) Dilation Angle E (MPa) Young Modulus
Jr Rating for Joint Surface
Roughness (of Least Favorable Set or Discontinuity)
Ja Rating for Joint Alteration, Discontinuity Filling (of Least Favorable or Discontinuity) Jw Rating for Water Softening,
Inflow and Pressure Effects SRF Rating for Faulting, Strength/
Stress Ratios, Squeezing, Swelling
m Intact Rock Constant s Intact Rock Constant
K0 Ratio of Horizontal to Vertical Stresses
FOS Factor of Safety
Jn Rating for Number of Joint Sets L(m) Length
D(m) Diameter
Eb(MPa) Modulus of Elasticity of Bolt Steel
Tbf (MN) Ultimate Strength of Bolt System Q (m/MN) Anchor/Head Deformation
Constant
Sc(m) Circumferential Bolt Spacing
SL(m) Longitudinal Bolt Spacing K(MPa) The Maximum Support Stiffness
pmax (MPa) The Maximum Pressure
8. REFERENCES
1. Engineering Report, “Engineering Geology and Geotechnical Investigations-Phase II”, Lameyer and Moshanir, Vol. I, No. 3, (1986).
2. Shafiezadeh, N., “Design, Stability Analysis and support System Design Siah Bisheh Cavern Powerhouse Project”, M. S. Final thesis of Rock Mechanics Faculty of Technical, Tarbiat Modarres University, Tehran, Iran, (2003).
3. Soil and Rock Laboratory Investigation Report, Lameyer and Moshanir, Vol. I, (1986), Totally Used. 4. Bieniawski, Z. T., “Engineering Rock Mass
Classification”, John Wiley and Sons, Pennsylvania, U.S.A., (1989).
5. Barton, N., “Some New Q-Value Correlations to Assist in Site Characterization and Tunnel Design”,
Int. J. Rock Mech. Min. Sci., Vol. 39, (2002),
185-216.
6. Ramamurthy, T., “A Geo-Engineering Classification for Rocks and Rock Masses”, Int. J. Rock Mech. Min. Sci.,
Vol. 41, (2003), 89-101.
7. Hoek, E., “Rock Engineering”, Course Notes, E-Book, www.rocsience.com, ( September, 1998).
8. Hoek, E. and Brown, E., T., “Underground Excavation in Rock”, Institute of Mining and Metallurgy, London, U.K., (1980).
9. Palmstorm, A., “RMI-A Rock Mass Classification System for Rock Engineering Purpose”, Ph. D Thesis, Oslo University, Norway, (1995).
10. Wittke, W., “Rock Mechanics”, Springer, New York, U.S.A., (1990).
11. Wittke, W., “Stability Analysis for Tunnels”, Springer, New York, U.S.A., (2000).

![TABLE 8. Geometrical Features of Dominant Discontinuity Systems in Siah Bisheh Powerhouse Complex [2]](https://thumb-us.123doks.com/thumbv2/123dok_us/241076.2018820/9.595.58.539.102.510/geometrical-features-dominant-discontinuity-systems-bisheh-powerhouse-complex.webp)
![Figure 9. Calculated total displacements from stages 2-18 in observed points (a) Cavern roof (b) Western wall of the cavern, and (c) Eastern wall of the cavern (IT [-] mention to the maximum number of iteration in time-step analysis for performing viscopla](https://thumb-us.123doks.com/thumbv2/123dok_us/241076.2018820/13.595.58.285.74.557/calculated-displacements-observed-eastern-iteration-analysis-performing-viscopla.webp)