TECHNICAL NOTE
APPLICABILITY OF ELASTIC ANALYSIS FOR PREDICTING
THE SETTLEMENT DISTRIBUTION AROUND TUNNELING
IN SOFT GROUND
M. Vafaeian and S. Mirmirani
Civil Engineering Department, IUT Isfahan, Iran, [email protected]
(Received: September 16, 2002 – Accepted in Revised Form: June 25, 2003)
Abstract In this article a brief review of the literature on the subject is cited. The method of analysis by a finite element program is discussed in which the effect of different influential parameters are examined. The results of these computations are then compared to the corresponding empirical data and two other existing formulae for two dimensional cases. The comparisons show quite reliable and acceptable agreement between the results of the present computations and the results obtained by other recently published formulae, and also with the existing observational data. Finally some prepared design diagrams are presented for predicting the maximum values of surface settlement and the maximum settlement of the tunnel crown.
Key Words Soft Ground Tunneling, Settlement, Elastic Analysis, Finite Element
ﻩﺪﻴﮑﭼ
ﻩﺪﻴﮑﭼ
ﻩﺪﻴﮑﭼ
ﻩﺪﻴﮑﭼ
ﻦﻴﻣﺯﻱﺎﻬﻴﻠﮑﺷﺮﮔﺩ ﺮﺑﻞﻧﻮﺗ ﺮﻔﺣﺮﻴﺛﺄﺗ ﺔﻨﻴﻣﺯ ﺭﺩ ﻲﻟﺎﻤﺟﺍ ﻲﺨﻳﺭﺎﺗﻲﺳﺭﺮﺑﮏﻳ ﺯﺍ ﺪﻌﺑ،ﻪﻟﺎﻘﻣ ﻦﻳﺍ ﺭﺩ
ﻲﺳﺭﺮﺑ ﺭﺩﺩﻭﺪﺤﻣ ﻱﺍﺰﺟﺍ ﺭﺍﺰﻓﺍ ﻡﺮﻧ ﺯﺍﻩﺩﺎﻔﺘﺳﺍ ﺵﻭﺭ ،ﻥﺁﻑﺍﺮﻃﺍ ﺮﻴﺛﺄﺗ ﻭﻪﺘﻓﺮﮔ ﺭﺍﺮﻗ ﺚﺤﺑﺩﺭﻮﻣ ﻉﻮﺿﻮﻣ ﻦﻳﺍ
ﺖﺳﺍ ﻩﺪﺷﻩﺪﻴﺠﻨﺳﻥﺁﺮﺑﺮﺛﺆﻣﻱﺎﻫﺮﺘﻣﺍﺭﺎﭘ .
ﻩﺩﺮﺑﺭﺎﮐﻪﺑ ﺺﺨﺸﻣﻲﻳﺍﺮﺟﺍﺩﺭﻮﻣﺪﻨﭼﻱﺍﺮﺑ ﺕﺎﺒﺳﺎﺤﻣﻦﻳﺍ ﺲﭙﺳ
ﻪﺴﻳﺎﻘﻣ ﺩﻮﺟﻮﻣﻲﻠﻴﻠﺤﺗﻝﻮﻣﺮﻓ ﺩﺭﻮﻣﻭﺩ ﺎﺑ ﻭﻲﺑﺮﺠﺗﻱﺎﻫ ﻱﺮﻴﮔ ﻩﺯﺍﺪﻧﺍﺯﺍ ﻞﺻﺎﺣ ﻡﺎﻗﺭﺍﺎﺑ ﻞﺻﺎﺣﺞﻳﺎﺘﻧ ﻭﻩﺪﺷ ﻪﮑﻨﻳﺍﻪﺑ ﻪﺟﻮﺗﺎﺑﻭﺖﺳﺍ ﻩﺪﻳﺩﺮﮔ
ﻲﻣﻲﺒﺳﺎﻨﻣﺭﺎﻴﺴﺑﻲﮕﻨﻫﺎﻤﻫﺓﺪﻨﻫﺩﻥﺎﺸﻧﺎﻫﻪﺴﻳﺎﻘﻣ ﻦﻴﻤﻫﺱﺎﺳﺍﺮﺑﺍﺬﻟ،ﺪﻨﺷﺎﺑ
ﺯﺍﻲﺼﺨﺸﻣﻂﻳﺍﺮﺷﻱﺍﺮﺑﻞﻧﻮﺗﺝﺎﺗﺖﺴﺸﻧﻭﻦﻴﻣﺯﺢﻄﺳﺖﺴﺸﻧﻲﻨﻴﺑﺶﻴﭘﻱﺍﺮﺑﻲﺣﺍﺮﻃﻱﺎﻫﺭﺍﺩﻮﻤﻧ،ﺕﺎﺒﺳﺎﺤﻣ ﺖﺳﺍﻩﺪﻳﺩﺮﮔﻪﻴﻬﺗﻦﻴﻣﺯﺕﺎﺼﺨﺸﻣﺯﺍﻲﻨﻴﻌﻣﺮﻳﺩﺎﻘﻣﻭﻞﻧﻮﺗﻖﻤﻋ،ﺮﻄﻗ .
1. INTRODUCTION
Study of the effect of shallow tunneling within the soft ground has been a matter of wide range of research during the last decades. This subject may be discussed within at least five topics as follows: (1) What will be the pattern of settlement distribution
at the ground surface, and also the limiting shape of deformation region due to tunneling?
(2) What kind of relationships exists between the settlement distribution (particularly surface settlement) and the tunnel depth and tunnel diameter?
(3) What relationships can be found between the ground deformations and the physico-mechanical properties of soil, such as the unit
weight, strength parameters, elasticity modulus, lateral earth pressure coefficient, water content, type of soil, etc.
(4) Which factors may control the pattern of deformations around the opening perimeter? (5) What would be the effect of tunneling on the
surface and subsurface civil structures like piles, piers, lifelines, etc.?
During last 40 years, many efforts have been made on this subject, which resulted in some theoretical and analytical answers to the problems mentioned. It is worthwhile here to classify all of these efforts in the following groups:
simple or sophisticated, some of them based on initial assumptions, and some based on empirical data. Some of the articles in this group are as follows:
Peck [1], Atkinson et al. [2], Muir-Wood [3], Attewell et al. [4], Sagaseta [5], Verruijt and Booker [6], Lo et al.[7] and Loganathan and Poulos [8,9].
The application of finite element programs can also be classified in this group.
(b) Real observational data from the measurements in full scale tunnels during boring or after that in the long time. This type of results is considered as the most reliable ones, but they cannot be used as versatile results because of the differences between physical and geometrical properties from a given site to another one. Some of these types of empirical achievements are by the following authors: Terzaghi [10], Peck [1], Attewell [11], Butler and Hampton [12], Glossop and Farmer [13], Hamsmir and Cording [14], Schlosser [15], Lo et al. [7] and Selby [16].
(c) The laboratories studies (including centrifuge tests), based on small models. In this type of experiments, the effect of some parameters can be well evaluated, though the effect of scale problem is somehow unknown.
2. PRESENT FINITE ELEMENT COMPUTATION
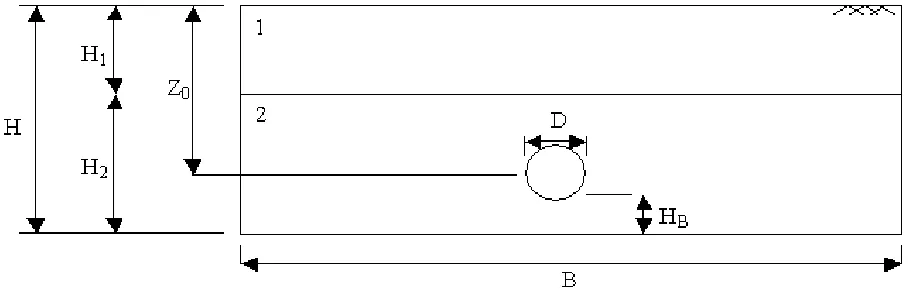
For the present study, an elastic finite element
program was used in which a rectangular domain of width B and height H (or H1+H2) was chosen and a circular tunnel with diameter D = 2a was assumed at the depth of Z0, and the base layer of
thickness HB, as shown on the Figure 1.
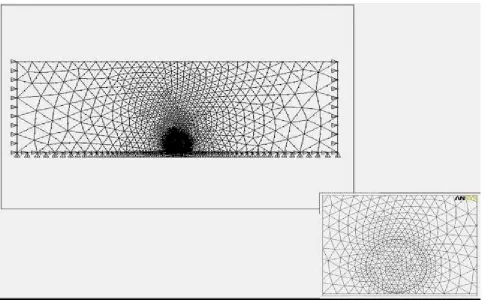
The computations have been carried out in the plane strain conditions, in which the domain boundaries are fixed in both x and y directions at the bottom, and fixed only in horizontal direction at both sides. The mesh generation was selected by the automatic option of six nodded triangular elements (Figure 2). In this study only the circular section was examined.
The geometrical and physico-mechanical properties considered primarily were:
E = 40 MPa; ρ = 1800 kg/m3; ν = 0.25; D = 10 m; Z0 = 50 m; HB = 0.25 m; H*B =
75*150 m
In order to simulate the procedure of tunnel excavation in a finite element computation, two different procedures may be used as follows: (1) The method of compulsory deformations by
which the nodal points of the elements around the tunnel perimeter are forced to have some given and predetermined deformations. These given deformations should be logically in coincidence to the displacement pattern observed empirically. (2) The method of eliminating the elements
from inside a circle that models the tunnel excavation within a weighted medium. In the present study, the procedure of eliminating
the elements was used.
Figure 3 shows the displacement vectors around the model tunnel based on the present finite element computation. Also the contour lines of equal displacements corresponding to this computation are illustrated in Figure 4.
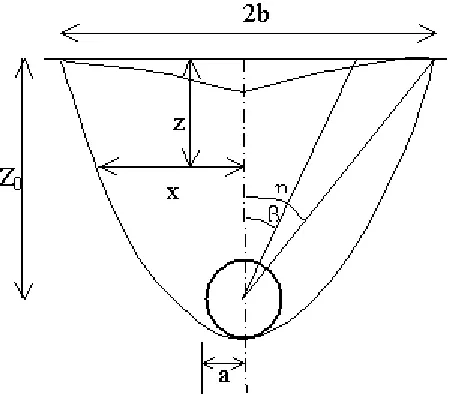
It seems reliable to adopt a parabolic shape to assume a limiting boundary for the deformation region. The mathematical formula for this parabolic curve can be simply expressed by the following relationship [16]:
x= b[1-z/(z0+a)] 0.5
(1-a) where the parameters in the above formula are
illustrated in the Figure 5. This relationship can be extended to the cases in which the deformation region extends beneath the tunnel to some depths. If the thickness of the soft layer beneath the tunnel is assumed as m = HB/a, then the above formula
can be rearranged as:
x= b{1-z /[ z0+a(1+m)]}0.5 (1-b)
3. PARAMETERS INFLUENCING THE DEFORMATIONS CHARACTERISICS
The main computational parameters which may affect the final results of ground behavior due to tunnel excavation may be classified into three groups, i.e.: (1) the geometrical variables such as Z0, D, B, H, and HB; (2) the physico-mechanical
variables like E, ν, and ρ; and (3) the shear strength parameters as c, φ and ψ.
In an elastic solution, the shear strength properties are not involved, and though the possibility of an elastic –plastic behavior is not ignored, it can normally be accepted that the magnitude of deformations due to tunneling are not so large as to develop the plasticity deformations. Nevertheless, the inward displacements of the
tunnel perimeter may exceed beyond the elastic deformations, but this would be yet limited to a short distance around the opening perimeter and not to a far distance. As a whole, it is a prerequisite assumption for the authors that the differential
settlements (or strains) in any individual small domain do not reach such a critical amount as to be sufficient for mobilizing the shear strength of soil; consequently the plastic behavior will not be happened.
Detailed parametric computations have been carried out to examine the effect of the above-mentioned variables on the deformation characteristics. The deformation characteristics in the present study are: Sc (the settlement at the tunnel crown), Smax
(the maximum settlement at the ground surface on the vertical axis), λ = Smax/Sc (the settlement
ratio), the distribution form of the settlement on the horizontal levels including the ground surface, and the distribution shape of the horizontal component of deformation along the vertical sections The effect of different factors on the settlement characteristics could be investigated by applying the elastic solution, from which the following
Figure 3. The pattern of soil movements due to tunneling in an elastic medium.
Figure 4. Contour lines of equal movements due to tunneling.
Figure 5. Assumed parabolic shape for the limitation of soil movements around and above the tunnel and the simple form of surface settlement.
Figure 6a. Contours of equal deformations for a two layered soil of E1/E2 = 100.
results could be concluded:
(1) The ground deformation is directly dependent on the amount of E, but the settlement ratio, λ,
remains independent of E. For a multi-layered ground with different modulus of elasticity, the pattern of equal deformations will be influenced by the ratio of the moduluae of the
Figure 7. The effect of changing ν values on the distribution of horizontal movements along the vertical section through the sidewall.
layers. An example of this phenomena is shown in the Figures 6a and 6b for the cases of E1/E2 =100 and E1/E2=0.01 respectively.
These two cases can be compared to the
condition of homogenous case shown in Figure 4.
(2) The deformation components and the settlement ratio are all dependent on the
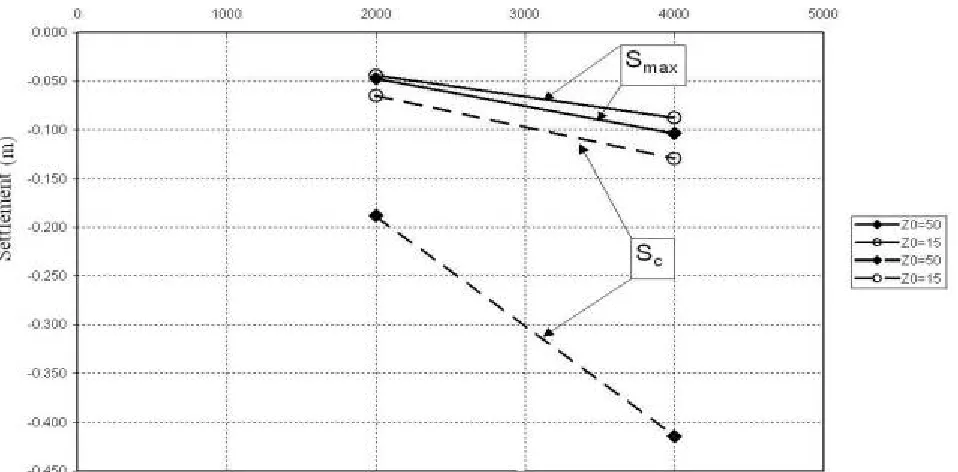
Figure 9a. The effect of depth and the tunnel diameter on the values of settlements: Sc: settlement at the tunnel roof, and Smax :
maximum settlement at the surface.
selected amounts of the Poisson ratio (which can be varied from 0 to 0.45). Computations showed that increasing the amounts of ν from 0 to 0.45 decreases the values of λ by about 20%, while the effect of changing ν on the horizontal deformations is much more expressive. Example of this effect is shown on the Figure 7.
(3) The deformation components are dependent linearly on the amounts of the unit weight as shown on the Figure 8, while the settlement ratio is independent of it.
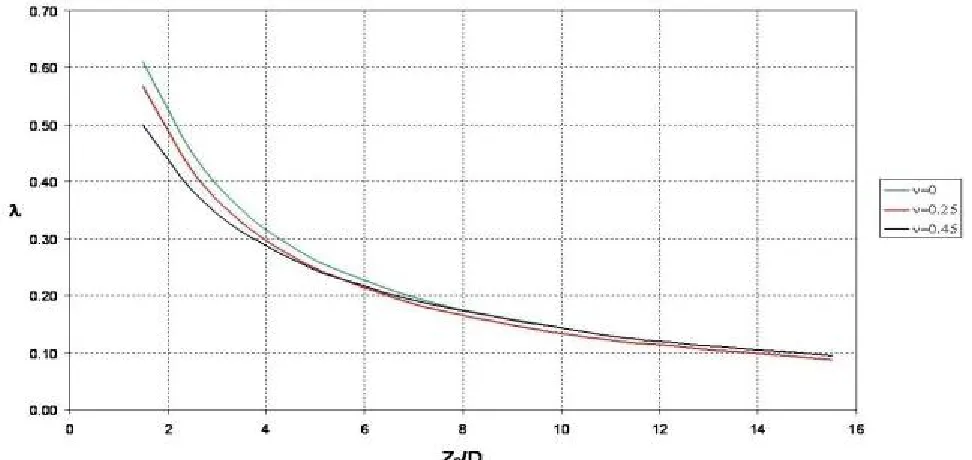
(4) The deformation components are dependent on the magnitude of depth and diameter of the tunnel as shown on the Figure 9a, which can also be shown as a function of the depth ratio Z0/D in
Figure
9b.4. DISCUSSIONS AND VERIFICATION
The reliability of an analytical solution may usually be verified by comparing the results of computations with some known empirical data. For this purpose, five cases of available actual data were chosen. These cases are the data obtained from the metro tunnels of Heathrow (England), Tunder Bay (Canada), Green Park (England), Barcelona (Spain), and Taipei (Taipei).
Loganathan and Poulos quoted the ground properties of these cases and the observational data for settlements from the papers [8 and 9] in which they used these data for verification of their proposed formulae. For the sake of this comparison, the physico-mechanical properties and the relative dimensions used in the present computation were accordingly chosen as to match with the actual amounts in each case (quoted from the same reference).
T h e r e l a t i o n s h i p s p r o p o s e d b y Loganathan and Poulos [8] for the vertical and horizontal deformations due to tunneling are as follows:
(
)
2 2(
)
22 2 x z , x x
z
H
x
4
3
z
H
x
1
R
U
+
+
ν
−
+
−
+
ε
−
=
(
)
(
)
[
]
+
+
+
−
2 2 2z
H
x
H
z
z
4
(2-a)(
)
(
)
(
)
(
)
[
]
+
+
+
−
−
+
+
+
ν
−
+
−
+
−
ε
=
2 2 2 2 2 2 2 2 2 2 z , x zz
H
x
]
H
z
x
[
z
2
z
H
x
)
H
z
)(
4
3
(
H
z
x
z
H
R
U
(2-b) Where εx,z is calculated from:]} H z 69 . 0 ) R cot . H ( x 38 . 1 [ exp{ R 4 g gR 4 2 2 2 2 2 2 z ,
x ⋅ − β+ +
+ = ε =
(2-c) in which β is the angle at the side wall of tunnel
between the vertical section and the line passed through the point of end of settlement at the surface , and g is the gap parameter discussed in their paper [8,9].
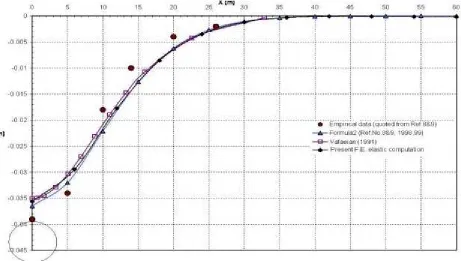
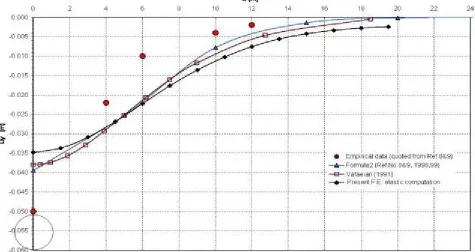
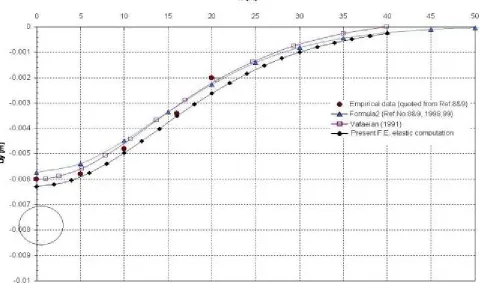
Figure 10a shows the ground properties and the relative dimensions of Heathrow tunnel (data from Refrences 8 and 9). The comparisons between the empirical data points, the output of the present computations and the curve obtained by Loganathan and Poulos’s formulas are illustrated on Figures 10b to 10d.
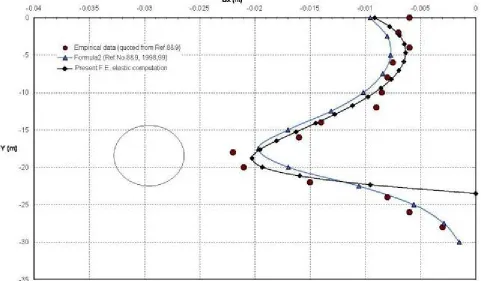
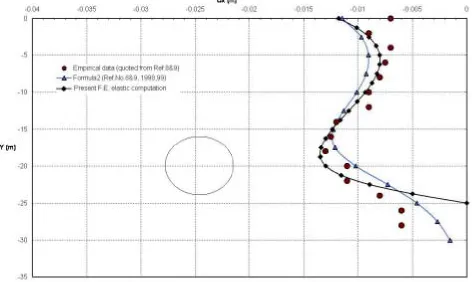
These comparisons are respectively for the distribution of ground surface settlement (Figure 10b), the settlement distribution along the vertical axis (Figure 10c) and the horizontal deformation along a vertical section beside the tunnel wall (Figure 10d). As it is seen on the Figure 10b, the comparison is also made with the simple formula proposed by Vafaeian [17] for the settlement trough curve for the surface.
The mentioned simple proposed formula is:
S= Smax cos 2β . cos (90β/η) (3)
Figure 10a. Schematic properties of Heathrow tunnel.
Figure 10 b. Comparison between the results obtained by elastic solution with available empirical data of Heathrow tunnel, and also with the results of
Figure 10c. Similar to Figure b, but for the distribution of settlement along vertical axis.
the surface, in which the angle η should be considered as tan η = x /(z0- z).
Similar comparisons are shown on the Figures 11 to 14 for the cases of Thunder Bay, Green Park, Barcelona and Taipei tunnels, respectively.
As these comparisons indicate, the result of a finite element analysis based on the elastic solution is quite acceptable and reliable, in sense that the results could be verified well by some empirical data.
5. DESIGN CHARTS
As discussed in the last sections, the reliability of the results obtained by the present computations based on an elastic finite element program could be verified by some available experimental data corresponding to different cases of ground properties and geometrical dimensions. Therefore it can be useful to have some design charts for predicting
the probable settlement at the tunnel roof and the maximum settlement at the surface. For this purpose the graphs have been prepared for some selected values of E, ν,γ, D and Z0, as follows:
E = 40 MPa; ν = 0, 0.25 and 0.45; γ = 16 and 20 kN/m3; D = 2, 4, 6, 8 and 12 m and Z0 = D to 40 m.
These charts are shown on the Figures 15 to 17 on which the amounts of variables are indicated. These figures are illustrated in the appendix. In each of these figures part “a” shows the amount of Smax and part b shows the amounts of Sc. It is clear
that for the cases, which are not found directly on the figures, the answer can be obtained by the interpolation and computation.
6. CONCLUSION
By means of an elastic finite element program, a
detailed study for obtaining the ground behavior around and above tunneling in soft ground has
Figure 11a. Schematic properties of the Thunder Bay tunnel.
Figure 12a. Schematic properties of the Green Park tunnel.
been carried out. The reliability of this computation has been verified by comparing the output for 5 different cases for which their empirical data were available. These comparisons exhibited excellent agreement. Also the results of these computations have been compared with the distribution curves of settlements proposed by Loganathan and Poulos for the same cases of
tunneling. These comparisons showed excellent agreement as well.
Comparing the values of settlement ratio, λ, as a function of depth ratio (z0/D) is another criteria
which showed acceptable compatibility.
Based on this study it is acceptable that if the ground properties are precisely known, then it is possible to predict the pattern of settlement and the
Figure 13. Comparison between the results obtained by elastic solution with available empirical data of Barcelona tunnel, and also with the results of analytical solutions for surface settlement.
Figure 14b. Comparison between the results obtained by elastic solution with available empirical data of Taipei tunnel, and also with the results of analytical solutions for surface settlement.
horizontal displacements around and above the excavations in most cases.
Furthermore, though the formulae proposed by Loganathan and Poulos are the precise and
promising formulae for this subject, but the advantage of using the finite element program is that it can be applied to any special cases as well, for example for a layered soil of different density or different elasticity modulus, or non-circular sections, etc.
Finally, some design charts have been prepared for estimating the maximum amount of surface settlement and the crown settlement for different values of D, Z0, E, ν and γ.
7. APPENDIX
Figures 15 to 17.
8. REFERENCES
1) Peck, R., “Deep Excavations and Tunneling in Soft Ground”, Proc. of 7th Int. Conf. on Soil Mechanics
and Foundation Eng., (1969), 225-290.
2) Atkinson, J. H. and Potts, D. M., “Subsidence Above Shallow Tunnel in Soft Ground”, Proc. ASCE, Vol. 103, No. GT4, (1977), 307-375.
3) Muir-Wood, A. M., “The Circular Tunnel in Elastic Ground”, Geotechnique, Vol. 25, No. 1, (1973), 115-127.
4) Attewell, P. B., Yeates, J. And Selby, A. R., “Soil Movements Induced by Tunneling and Their Effect on Pipeline and Structures”, Chapman and Hall, New York, (1986).
5) Sagaseta, C., “Analysis of Underground Soil Deformation Due to Ground Loss”, Geotechnique, Vol. 37, No. 3, (1987), 301-330.
6) Verruijt, A. and Booker, J. R., “Surface Settlements
Due to Deformation of A Tunnel in An Elastic Half Plane”, Geotechnique, Vol. 46, No. 4, (1996), 753-766.
7) Lo, K. Y., Ng, M. C., and Rowe, R. K., “Predicting Settlement Due to Tunneling in Clayes”, Proc. Of
Two Sessions at Geotechnics, 84, Atlanta, (1984),
46-76.
8) Loganathan, N. and Poulos, H. G., “Analytical P r e d i c t i o n f o r T u n n e l i n g I n d u c e d G r o u n d Movements in Clay”, Journal of Geotechnical and
Geoenvironmental Eng., Vol. 124, No. 9, (1998),
846-856.
9) Loganathan, N. and Poulos, H. G., “Tunneling Induced Ground Deformations and Their Effects on Adjacent Piles”, Proc. of 10th Australian Tunneling Conf., Melbourne, (1999), 1-34.
10) Terzaghi, K., “Liner Plate Tunnel on the Chicago Subway”, Proc. ASCE, Vol. 68, No. 6, (1942), 862-899.
11) Attewell, P. B., “Ground Movements Caused by Tunneling in Soil”, Int. Conf. Large Ground
Movement and Structures, Cardiff, (1977),
812-848.
12) Butler, R. A. and Hampton, D., “Subsidence Over Soft Ground Tunneling”, Proc. ASCE, Vol. 104, No. Gt1, (1975), 35-49.
13) Glossop, N. H. and Farmer, I. W., “Settlement Associated with Removal of Compressed Air Pressure During Tunneling in Alluvial Clay”, Geotechnique, 29, No. 1, (1979), 67-72.
14) Hamsmir, W. H. and Cording, E. J., “Soil Tunnel Test Suction, Case History Summary”, Proc. ASCE, No. 111, GT11, (1985), 67-72.
15) Schlosser, F., “Tunneling in Urban Aria and Ground Reinforcement”, Proc. 3rd Iranian Seminar on
Tunneling, (1987), 311-352.
16) Selby, A. R., “Tunneling in Soil Ground Movements and Damage to Buildings in Workington, UK”, Geotechnical
and Geological Engineering, Vol. 17, (1999), 351-371.
17) Vafaeian, M., “Analysis of Soil Behavior During Excavation of Shallow Tunnels”, Journal of Geotechnical