*Corresponding author:Ariel Polonsky
ISSN: 0976-3031
Research Article
EFFECTS OF GESTATIONAL WEIGHT CHANGES ON THE DURATION OF FIRST
AND SECOND STAGES OF LABOR
Ariel Polonsky*
Department of Obstetrics and Gynecology, 355 Grand Street, Jersey City, New Jersey 07302, USA
DOI: http://dx.doi.org/10.24327/ijrsr.2017.0811.1176
ARTICLE INFO ABSTRACT
Objective: Obesity is a growing epidemic. Our study concentrates on weight changes from the beginning of pregnancy to labor and how it affects progression during first and second stages of labor. Methods: Data collected prospectively from 204 singleton full term laboring patients was analyzed. The need for epidural, fetal weight, parity and the need for labor augmentation were included as coefficients. Student t-tests were used for continuous variables and chi-square tests for binary variables. Results: Statistically significant effect was observed when comparing the para 0 coefficient in all categories of weight. It was emphasized in the results that for every increase in any weight category, either by a BMI unit or a kilogram, there would be an increase in the first stage of labor. The most influential weight category was found to be BMI before pregnancy as the measurement coefficient, which included all coefficients, demonstrated statistical significance. Parity showed statistical significance for every weight category as well. It could be concluded that for every unit or kilo increase in weight, there would be prolongation of the second stage of labor amongst nulliparous women. Conclusion: Our study shows that changes in maternal weight before or during pregnancy do influence labor progression, both the first and second stages of labor. These changes might influence the way we manage laboring patients.
INTRODUCTION
Obesity has become a global problem in the last few decades. It is known to be a major cause of increased morbidity and mortality. According to the National Health and Nutrition Examination Survey conducted in 2011-2012, the prevalence of obesity in women of reproductive age (20-39 years) in the United States is 31.8%. If overweight women are included, the rate increases to 58.5 %. Obesity is also known to affect the reproductive health of women throughout pregnancy. In the first trimester of pregnancy, obesity is associated with an increase in spontaneous abortion and recurrent miscarriages. As pregnancy progresses, obesity increases antepartum, intrapartum and postpartum complications. Antepartum complications include cardiac dysfunction, nonalcoholic fatty liver, gestational diabetes (GDM) and preeclampsia. Intrapartum complications include an increase in the rate of cesarean sections, failed labor, and an increased incidence of endometritis, wound rupture/dehiscence and venous thrombosis. Postpartum complications include retained weight, metabolic syndromes and pre-gravid obesity in future pregnancies. There is growing evidence in the literature that supports the relationship between maternal obesity and labor
progression. Some studies have shown an inverse relationship between obesity and labor progression either in the first or second stages of labor. Other studies have reported that obesity affects either the first or second stage of labor in nulliparous women but not multiparous women. All studies investigated the ways in which obesity affects labor progression, but not changes in weight during pregnancy. Our study aimed to investigate any correlations between weight and BMI changes from pre-pregnancy to labor and its effects on labor progression in both nulliparous and multiparous women. We hope that this comparison shed light on appropriate management of patient of various weight groups and assess how various coefficients during labor affect its progression.
METHODS AND MATERIALS
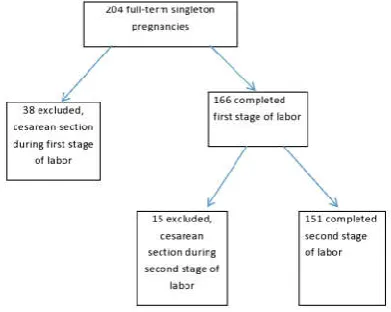
This study was a prospective observational study, we collected data on labor progression during the active phase (6cm-10cm dilation with regular contractions) and the second stage of labor (10cm dilation to fetal expulsion) in full term pregnancies (37-41weeks) of various BMI groups(6 categories) defined by the World Health Organization. The study included 204 laboring patients. During the first stage of labor, 38 women were excluded due to cesarean section delivery prior to 10cm
Recent Scientific
Research
International Journal of Recent Scientific Research
Vol. 8, Issue, 11, pp. 21982-21986, November, 2017
Copyright © Ariel Polonsky, 2017, this is an open-access article distributed under the terms of the Creative Commons Attribution License, which permits unrestricted use, distribution and reproduction in any medium, provided the original work is properly cited.
DOI: 10.24327/IJRSR
CODEN: IJRSFP (USA)
Article History:
Received 17th August, 2017 Received in revised form 12th September, 2017
Accepted 04th October, 2017
Published online 28th November, 2017
Key Words:
And Second Stages of Labor
dilation. During the second stage, 15 women were excluded due to cesarean section delivery. The flow chart showing inclusion and exclusion for this study is shown in figure 1.Labor progression curves were calculated for 151 laboring women. The data was collected as labor progressed. The objective of this study was to observe, whether weight changes either in BMI or kilos, from pre-pregnancy to labor, affected the duration of the first and second stages of labor taking into account multiple coefficients that exist during the normal labor process. The different weight measurements included BMI before pregnancy, BMI at delivery, weight in kilos before pregnancy and weight in kilos at delivery. In addition, the comparison included the difference in BMI and weight in kilos between pre-pregnancy and labor. BMI was calculated with the assistance of the formula weight (kilos)/ {height (meters)} 2. Patients were weighed before admission to labor and delivery and the BMI was calculated. Pre-pregnancy weight was obtained from the patient’s prenatal chart and BMI was calculated accordingly. The need for an epidural, fetal weight, parity and use of Pitocin augmentation were investigated. Their effect on the timing of first stage and second stage labor in the different weight categories was observed and included in statistical equations. This study was conducted on the labor and delivery floor of a single medical center over a 6 month period. Data were collected prospectively during the labor process. No interventions or changes were performed during the study. Inclusion criteria included women between the ages of 15 and 45 years, with a singleton pregnancy at term (37-41 weeks) and in labor. Active labor was considered when regular contractions were detected together with a 6cm -10 cm cervical dilation and 80% effacement. All BMI groups (6 categories) were included and all gravidity and parity groups were included as well. Women undergoing labor induction or augmentations were also included. Exclusion criteria included women over 45 years and below 15 years, women scheduled for cesarean section and those less than 6cm dilated or without regular contractions. Women trying labor after cesarean section were also excluded. Cases of severe fetal malformations and stillbirth were also excluded. A P value of less than 0.05 was considered statistically significant. The statistical tests used in this study were the chi-square test and t-test. A Chi-square test was used for binary variables and a t-test was used for continuous variables. The use of an epidural, parity, fetal weight and augmentation coefficients were applied in these tests, together with the weight categories and time to assess statistically significant differences. Western Institutional review board approved this study. Informed consents were not obtained. Considering the fact that this study was an observational prospective study and no interventions in patient management were performed, the IRB exempted the authors from obtaining informed consents.
RESULTS
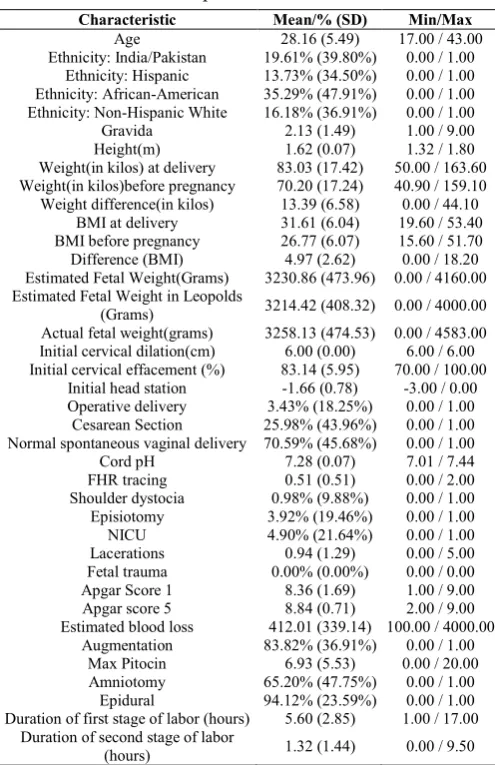
Table 1 summarizes the demographic characteristics of individuals included in this study. The average age was 28.2 year. Of the group, 35.3% were African-Americans, 19.61% were of Indian/Pakistani origin, 13.73% were of Hispanic origin and 16.18% of non-Hispanic white origin. The average weight gain was 13.39 kilograms and the average BMI increase was 4.97. Vaginal deliveries accounted for 70.59% of the
population and 25.98% were cesarean section. The percentage of patients who received an epidural was 94.1%.
The average duration of the first stage and second stages of labor were 5.6 hours and 1.32 hours, respectively. Table 2 shows the effects of BMI before pregnancy, BMI in labor, weight before pregnancy, weight in labor on the first stage of labor. Several coefficients were included in the analysis to assess their effects on the first stage of labor. The coefficients included were, need for epidural, fetal weight, parity and need for augmentation. Their combined effects were presented as measurement coefficients. The measurement coefficients were most significantly affected by BMI before pregnancy group (p=0.0429, CI 95% =0.08{0-0.16}; Table 2). Additionally, the parity coefficients were significantly different (Table 2). It was determined, any increase or change in any weight measurement increased the time to progress from 6cm dilation to 10 cm dilation during labor by about an hour in the para=0 patients (Table 2). On the other hand, the time to progress from 6cm dilation to 10 cm dilation decreased by about an hour in multiparous patients compared to the para=0 patients (Table 2). Table 3 shows how the six categories of weight measurements affected the duration of the second stage of labor. The six categories included BMI before pregnancy, BMI during labor, weight in kilos before pregnancy and weight in kilos during labor, the difference in BMI before pregnancy and during labor
Table 1 Population Characteristics
Characteristic Mean/% (SD) Min/Max
Age 28.16 (5.49) 17.00 / 43.00
Ethnicity: India/Pakistan 19.61% (39.80%) 0.00 / 1.00
Ethnicity: Hispanic 13.73% (34.50%) 0.00 / 1.00
Ethnicity: African-American 35.29% (47.91%) 0.00 / 1.00
Ethnicity: Non-Hispanic White 16.18% (36.91%) 0.00 / 1.00
Gravida 2.13 (1.49) 1.00 / 9.00
Height(m) 1.62 (0.07) 1.32 / 1.80
Weight(in kilos) at delivery 83.03 (17.42) 50.00 / 163.60
Weight(in kilos)before pregnancy 70.20 (17.24) 40.90 / 159.10
Weight difference(in kilos) 13.39 (6.58) 0.00 / 44.10
BMI at delivery 31.61 (6.04) 19.60 / 53.40
BMI before pregnancy 26.77 (6.07) 15.60 / 51.70
Difference (BMI) 4.97 (2.62) 0.00 / 18.20
Estimated Fetal Weight(Grams) 3230.86 (473.96) 0.00 / 4160.00
Estimated Fetal Weight in Leopolds
(Grams) 3214.42 (408.32) 0.00 / 4000.00
Actual fetal weight(grams) 3258.13 (474.53) 0.00 / 4583.00
Initial cervical dilation(cm) 6.00 (0.00) 6.00 / 6.00
Initial cervical effacement (%) 83.14 (5.95) 70.00 / 100.00
Initial head station -1.66 (0.78) -3.00 / 0.00
Operative delivery 3.43% (18.25%) 0.00 / 1.00
Cesarean Section 25.98% (43.96%) 0.00 / 1.00
Normal spontaneous vaginal delivery 70.59% (45.68%) 0.00 / 1.00
Cord pH 7.28 (0.07) 7.01 / 7.44
FHR tracing 0.51 (0.51) 0.00 / 2.00
Shoulder dystocia 0.98% (9.88%) 0.00 / 1.00
Episiotomy 3.92% (19.46%) 0.00 / 1.00
NICU 4.90% (21.64%) 0.00 / 1.00
Lacerations 0.94 (1.29) 0.00 / 5.00
Fetal trauma 0.00% (0.00%) 0.00 / 0.00
Apgar Score 1 8.36 (1.69) 1.00 / 9.00
Apgar score 5 8.84 (0.71) 2.00 / 9.00
Estimated blood loss 412.01 (339.14) 100.00 / 4000.00
Augmentation 83.82% (36.91%) 0.00 / 1.00
Max Pitocin 6.93 (5.53) 0.00 / 20.00
Amniotomy 65.20% (47.75%) 0.00 / 1.00
Epidural 94.12% (23.59%) 0.00 / 1.00
Duration of first stage of labor (hours) 5.60 (2.85) 1.00 / 17.00
Duration of second stage of labor
and the difference in weights in kilos before pregnancy and during labor. The coefficients included in the analysis were the need for an epidural, fetal weight, parity and need for labor augmentation. Once again a statistical significance was observed in favor of the parity group in all weight measurement categories.
It could be concluded that for every BMI unit or kilo increase in weight, between before pregnancy and during labor, there was a prolongation of the second stage of labor by about three quarters of an hour in para=0 pregnancies. On the other hand, the time from 10 cm dilation to fetal expulsion in multiparous patients was 75% shorter. Table 4 shows the results of a comparison between nulliparous and multiparous pregnancies. Among the statistical significant findings, it was observed that nulliparous women had a higher chance of delivering via Table 2 Duration of First Stage of labor
Measure Measure Coefficient
(95% CI), P-value
Epidural Coefficient (95% CI), P-value
Fetal Weight Coefficient (95% CI, P-value
Para=0 Coefficient (95% CI), P-value
Augmentation Coefficient (95% CI), P-value
Implied Coefficient of Para>0 (95% CI), P-value
Weight( in kilos)before pregnancy
0.02 (0.00, 0.05), P=0.0924
0.62 (-1.25, 2.48), P=0.5155
0.0002 (-0.0009, 0.0012),
P=0.7614 1.26 (0.24, 2.28), P=0.0155 1.04 (-0.11, 2.19), P=0.0756
-1.26 (-2.28, -0.24), P=0.0155
Weight(in kilos) at delivery
0.01 (-0.01, 0.04), P=0.2901
0.69 (-1.18, 2.56), P=0.4677
0.0002 (-0.0009, 0.0012),
P=0.7686 1.18 (0.15, 2.21), P=0.0245 1.08 (-0.07, 2.24), P=0.0663
-1.18 (-2.21, -0.15), P=0.0245 Weight difference(in
kilos)
-0.02 (-0.09, 0.05), P=0.5684
0.72 (-1.15, 2.60), P=0.4476
0.0003 (-0.0008, 0.0014),
P=0.5721 1.01 (0.01, 2.00), P=0.0478 1.13 (-0.03, 2.28), P=0.0563
-1.01 (-2.00, -0.01), P=0.0478 BMI before
pregnancy
0.08 (0.00, 0.16), P=0.0429
0.54 (-1.32, 2.40), P=0.5674
0.0002 (-0.0009, 0.0012),
P=0.7389 1.32 (0.30, 2.33), P=0.0116 1.01 (-0.14, 2.15), P=0.0848
-1.32 (-2.33, -0.30), P=0.0116
BMI at delivery 0.07 (-0.01, 0.15),
P=0.0931
0.61 (-1.25, 2.47), P=0.5188
0.0001 (-0.0009, 0.0012),
P=0.7909 1.28 (0.26, 2.31), P=0.0146 1.03 (-0.13, 2.18), P=0.0807
-1.28 (-2.31, -0.26), P=0.0146
Difference (BMI) -0.01 (-0.18, 0.16),
P=0.8815
0.74 (-1.14, 2.62), P=0.4370
0.0003 (-0.0008, 0.0013),
P=0.6059 1.02 (0.02, 2.02), P=0.0452 1.12 (-0.03, 2.28), P=0.0568
-1.02 (-2.02, -0.02), P=0.0452
All models estimated using age, ethnicity (white/non-white) and gravida as controls Results significant at a 95% level are indicated by shading.
Table 3 Duration of Second Stage of labor
Measure Measure Coefficient
(95% CI), P-value
Epidural Coefficient (95%
CI), P-value
Fetal Weight Coefficient (95% CI,
P-value
Para=0 Coefficient (95% CI), P-value
Augmentation Coefficient (95% CI), P-value
Implied Coefficient of Para>0 (95% CI), P-value
Weight(kilo)before pregnancy
0.00 (-0.01, 0.01), P=0.7412
-0.02 (-0.93, 0.89), P=0.9656
0.0001 (-0.0003, 0.0006), P=0.5261
0.72 (0.25, 1.20),
P=0.0030 -0.02 (-0.59, 0.55), P=0.9483 -0.72 (-1.20, -0.25), P=0.0030
Weight(kilo) at delivery 0.00 (-0.01, 0.01),
P=0.8923
-0.03 (-0.94, 0.88), P=0.9523
0.0001 (-0.0003, 0.0006), P=0.5758
0.75 (0.28, 1.22),
P=0.0021 -0.03 (-0.60, 0.54), P=0.9132 -0.75 (-1.22, -0.28), P=0.0021
Weight difference(kilo) 0.02 (-0.01, 0.05),
P=0.1764
-0.01 (-0.92, 0.90), P=0.9880
0.0001 (-0.0003, 0.0005), P=0.7118
0.76 (0.30, 1.22),
P=0.0014 -0.03 (-0.60, 0.53), P=0.9124 -0.76 (-1.22, -0.30), P=0.0014
BMI before pregnancy -0.02 (-0.06, 0.01),
P=0.1930
0.01 (-0.90, 0.92), P=0.9824
0.0002 (-0.0003, 0.0006), P=0.4643
0.67 (0.20, 1.14),
P=0.0056 0.02 (-0.54, 0.59), P=0.9317 -0.67 (-1.14, -0.20), P=0.0056
BMI at delivery -0.01 (-0.05, 0.02),
P=0.4480
-0.01 (-0.92, 0.90), P=0.9801
0.0002 (-0.0003, 0.0006), P=0.4680
0.70 (0.23, 1.17),
P=0.0039 0.00 (-0.57, 0.57), P=0.9904 -0.70 (-1.17, -0.23), P=0.0039
Difference (BMI) 0.04 (-0.04, 0.12),
P=0.2919
-0.01 (-0.92, 0.90), P=0.9767
0.0001 (-0.0003, 0.0005), P=0.6773
0.76 (0.30, 1.22),
P=0.0013 -0.04 (-0.60, 0.53), P=0.8998 -0.76 (-1.22, -0.30), P=0.0013
All models estimated using age, ethnicity (white/non-white) and gravida as controls Results significant at a 95% level are indicated by shading.
Table 4 Characteristics according to Parity
Characteristic Para > 0:
Mean(SD)
Para=0: Mean(SD)
P-value of Difference
Age 30.07 (5.25) 27.35 (5.40) 0.0011
Ethnicity: India/Pakistan 11.48% (32.14%) 23.08% (42.28%) 0.056
Ethnicity: Hispanic 11.48% (32.14%) 14.69% (35.52%) 0.5419
Ethnicity: African American 45.90% (50.25%) 30.77% (46.32%) 0.0384
Ethnicity: Non-Hispanic White 9.84% (30.03%) 18.88% (39.27%) 0.1082
Gravida 3.74 (1.56) 1.44 (0.76) <.0001
Height(m) 1.62 (0.07) 1.62 (0.08) 0.8653
Weight(kilo) at delivery 89.54 (19.49) 80.25 (15.73) 0.0014
Weight(kilo)before pregnancy 77.13 (19.84) 67.24 (15.13) 0.0008
Weight difference(kilo) 13.51 (7.77) 13.34 (6.03) 0.873
BMI at delivery 33.97 (5.91) 30.60 (5.83) 0.0002
BMI before pregnancy 29.20 (6.25) 25.73 (5.70) 0.0001
Difference (BMI) 5.15 (3.26) 4.89 (2.31) 0.5739
Estimated fetal
weight(grams-ultrasound) 3223.90 (542.50) 3233.80 (444.10) 0.892
Estimated fetal weight in
leopolds(grams) 3219.80 (363.70) 3212.10 (427.00) 0.9035
Actual fetal weight(grams) 3250.00 (632.90) 3261.60 (390.60) 0.8946
Initial cervical dilation(cm) 6.00 (0.00) 6.00 (0.00) N/A
Initial cervical effacement (%) 81.80 (5.63) 83.71 (6.01) 0.0362
Initial head station -1.89 (0.73) -1.56 (0.78) 0.0061
Operative Delivery 0.00% (0.00%) 4.90% (21.65%) 0.0787
Cesarean Section 16.39% (37.33%) 30.07% (46.02%) 0.0414
Normal spontaneous vaginal delivery 83.61% (37.33%) 65.03% (47.85%) 0.0077
Cord pH 7.30 (0.05) 7.27 (0.08) 0.0012
FHR tracing 0.52 (0.50) 0.51 (0.52) 0.8573
Shoulder dystocia 1.64% (12.80%) 0.70% (8.36%) 0.5327
Episiotomy 1.64% (12.80%) 4.90% (21.65%) 0.2727
NICU 0.00% (0.00%) 6.99% (25.59%) 0.0342
Lacerations 0.48 (0.87) 1.13 (1.39) <.0001
Fetal trauma 0.00% (0.00%) 0.00% (0.00%) N/A
Apgar scores 1 8.66 (1.30) 8.24 (1.82) 0.0657
Apgar scores 5 8.82 (0.92) 8.85 (0.60) 0.8368
Estimated blood loss 403.30 (529.40) 415.70 (214.40) 0.8595
Augmentation 80.33% (40.08%) 85.31% (35.52%) 0.3759
Max Pitocin 6.15 (5.40) 7.27 (5.57) 0.1869
Amniotomy 68.85% (46.69%) 63.64% (48.27%) 0.474
Epidural 88.52% (32.14%) 96.50% (18.43%) 0.0266
Time of first stage(hours) 4.90 (2.30) 5.92 (3.03) 0.0186
Time of second stage(hours) 0.76 (0.60) 1.58 (1.63) <.0001
P-values were the result of t-tests for continuous variables, chi-square tests for binary; Values under 0.05 are considered significant at a 95% level and are highlighted
And Second Stages of Labor
cesarean section. In addition, epidurals were more common in nulliparous women. Differences in Weights in kilos and BMI before pregnancy and during delivery were significantly higher in multiparous women.
DISCUSSION
Very few studies have reported on intrapartum management of obesity or how weight changes influenced progression of labor. Our study observed how weight changes, either in BMI or kilos, affected the progression of the first and second stage of labor. The first stage of labor was found to be significantly longer in all weight categories for nulliparous women. For every increase in weight, the first stage of labor was longer by about an hour. Similar results were described by Nuthalapaty
et al. in 2004 (1). In that study, the author concentrated on weight change and labor progression but did not differentiate between pre-pregnancy and labor weight or between the first and second stages of labor. Our study concentrated on weight changes and BMI before pregnancy and during labor and analyzed how it affected labor progression. There was also separation between the first and second stages of labor and it was challenging to determine what part of labor was influenced by weight the most. In Nuthalapaty’s study, confounding factors such as infant birth weight, maternal age, initial cervical dilation, and diabetes were investigated (1). In contrast, our study concentrated on fetal weight, parity, the need for an epidural and augmentation in labor. In the above mentioned study, it was determined that an increase in weight prolonged labor with no differentiation of stage (1). Our study demonstrated the same when adjusting for cofounders. Our study demonstrated that the first stage of labor was influenced by any weight change, especially in the nulliparous population. The first stage of labor was found to be shorter in multiparous pregnancies. In addition, the measurement coefficient was found to be statistically significant in the BMI before pregnancy group. The P value was 0.0429 with a CI 95% of 0.08 (0-0.16). The above findings signify the importance of BMI before pregnancy.Multiple studies have reported that weight gain during pregnancy is an important consideration as it has multiple effects on pregnancy, labor, and the post-pregnancy period for the mother and the infant. In 2009, the Institute of Medicine published recommendations for weight gain during pregnancy according to initial BMI. For underweight pregnant women, the recommended weight gain should be between 12.5 and 18 kilos, and for women of normal weight, the recommended weight gain should be between 11.5 and 16 kilos. Overweight pregnant women should gain between 7 and 11.5 kilos and obese pregnant women of any class should gain between 5 and 9 kilos (2). Many studies have been conducted on weight in pregnancy and the outcomes. The most recent study was a meta-analysis published in JAMA on the association between gestational weight gain and maternal and infant outcomes. This meta-analysis included 5354 studies. Their conclusions were that 47% of gestational weights were greater than the IOM recommendations (3) and 23% were lower. Compared with the recommended gestational weight gain, gain below these guidelines is associated with a 5% higher risk of both small for gestational age (SGA) and preterm birth, and a 2% lower risk of both large for gestational age (LGA) and macrosomia. On the other hand, weight gain above
the recommended guidelines was associated with a 3% lower risk of SGA and a 2% lower risk of preterm birth, and a 4%, 6%, and 4% higher risk for LGA, macrosomia, and cesarean delivery, respectively. Similar results were published in ACOG’s Practice Bulletin in 2015 (4). Other complications were studied to assess their association with maternal weight and pregnancy loss was found to be increased either by spontaneous abortion, recurrent miscarriage, or stillbirth (5). Among antepartum maternal complications, it was observed that obese pregnant women had increased risk of cardiac dysfunction, proteinuria, sleep apnea, nonalcoholic fatty liver disease, GDMA, and preeclampsia (6). There was also an increased risk of fetal anomalies, predominantly neural tube defects (OR, 2.24; 95% CI, 1.86-2.69). It has been shown that women with a normal BMI prior to pregnancy have fewer complications during pregnancy and delivery. Complications such as stillbirth, gestation diabetes, preeclampsia and increased incidence of cesarean section could be avoided recommendations for weight gain during pregnancy according to initial BMI. For underweight pregnant women, the recommended weight gain should be between 12.5 and 18 kilos, and for women of normal weight, the recommended weight gain should be between 11.5 and 16 kilos. Overweight pregnant women should gain between 7 and 11.5 kilos and obese pregnant women of any class should gain between 5 and 9 kilos (2). Many studies have been conducted on weight in pregnancy and the outcomes. The most recent study was a meta-analysis published in JAMA on the association between gestational weight gain and maternal and infant outcomes. This meta-analysis included 5354 studies. Their conclusions were that 47% of gestational weights were greater than the IOM recommendations (3) and 23% were lower. Compared with the recommended gestational weight gain, gain below these guidelines is associated with a 5% higher risk of both small for gestational age (SGA) and preterm birth, and a 2% lower risk of both large for gestational age (LGA) and macrosomia. On the other hand, weight gain above the recommended guidelines was associated with a 3% lower risk of SGA and a 2% lower risk of preterm birth, and a 4%, 6%, and 4% higher risk for LGA, macrosomia, and cesarean delivery, respectively. Similar results were published in ACOG’s Practice Bulletin in 2015 (4). Other complications were studied to assess their association with maternal weight and pregnancy loss was found to be increased either by spontaneous abortion, recurrent miscarriage, or stillbirth (5). Among antepartum maternal complications, it was observed that obese pregnant women had increased risk of cardiac dysfunction, proteinuria, sleep apnea, nonalcoholic fatty liver disease, GDMA, and preeclampsia (6). There was also an increased risk of fetal anomalies, predominantly neural tube defects (OR, 2.24; 95% CI, 1.86-2.69). It has been shown that women with a normal BMI prior to pregnancy have fewer complications during pregnancy and delivery. Complications such as stillbirth, gestation diabetes, preeclampsia and increased incidence of cesarean section could be avoided
CONCLUSION
protocols. These changes may improve our management in order to prevent complications and decrease cesarean section rates.
Acknowledgments
Don Alderson contributed to the (statistical analysis). I would also like to thankRutgers University Biostatistics and epidemiology and the state University of New Jersey. Written permission was obtained.
Reference
1. Nuthalapaty FS, Rouse DJ, Owen J. The association of maternal weight with cesarean risk, labor duration and cervical dilation rate during labor induction. Obstet Gynecol 2004; 103: 452-6.
2. Institution of Medicine. National Research Council. Weight Gain during Pregnancy: Reexamining the Guidelines. Washington, DC: National Academies Press; 2009.
3. GoldsteinRF; Abellsk; Ranasinha S. Et al. Association of gestational weight gain with maternal and infant outcomes. A systematic Review and Meta-analysis.
JAMA. 2017; 317: 2207-25.
4. Practice Bulletin number 156, December 2015. Obesity
in pregnancy.
5. Lashen H, Fear K, Sturdee DW. Obesity is associated with increased risk of first trimester and recurrent miscarriage: matched case-control study. Hum Reprod
2004; 19: 1644-6.
6. Anderson NH, McCowan LM, Fyte EM, Chan EH, Taylor RS, Stewart AW, et al. The impact of maternal body mass index on the phenotype of pre-eclampsia: a prospective cohort study. SCOPE consortium. BJOG
2012;119:589-95.
7. Weiss JL, Malone FD, Emig D, Ball RH, Nyberg DA, Comstock CH, et al. Obesity, obstetric complications and cesarean delivery rate a population based screening study. FASTER Research Consortium. Am J Obstet Gynecol 2004;190:1091-7.
8. Robinson BK, Mapp DC, Bloom SL, Rouse DJ, Spong CY, Varner MW, et al. Increasing maternal body mass index and characteristics of the second stage of labor. Eunice Kennedy Shriver National Institute of Child Health and Human Development of the Maternal-Fetal Medicine Units Network. Obstet Gynecol 2011; 118: 1309-13.