Please cite this article as: M. Bashiri, M. Rezanezhad,A Reliable Multi-objective p-hub Covering Location Problem Considering of Hubs Capabilities, International Journal of Engineering (IJE), TRANSACTIONS B: Applications Vol. 28, No. 5, (May 2015) 717-729
International Journal of Engineering
J o u r n a l H o m e p a g e : w w w . i j e . i rA Reliable Multi-objective
p
-hub Covering Location Problem Considering of Hubs
Capabilities
M. Bashiri, M. Rezanezhad*
Department of Industrial Engineering, Shahed University, Tehran, Iran
P A P E R I N F O
Paper history:
Received 01 November 2014
Received in revised form 18 December 2014 Accepted 29 January 2015
Keywords:
P-hub Covering Hub Capability Reliability Multi Objective
A B S T R A C T
In the facility location problem usually reducing total transferring cost and time are common objectives. In the p-hub covering problem it is attempted to locate hubs and allocate customers to established hubs while allocated nodes to hubs are inside of related hubs covering radius. In this paper, we attempt to consider capability of established hubs to achieve a more reliable network. Also, the proposed model try to construct a network with more covering reliability by determining operating covering radius inside of nominal radius. Then, a sensitivity analysis is performed to analyze effect of
parameters in the model. The proposed multi objective model is solved by ε-constraint algorithm for
small size instances. For large scale instances a non-dominated sorting genetic algorithm (NSGA-II) is presented to obtain Pareto solutions and its performance is compared with results of ε-constraint algorithm. The model and solution algorithm were analyzed by more numerical examples such as Turkish network dataset. The sensitivity analysis confirms that the network extracted by the proposed model is more efficient than classic networks.
doi: 10.5829/idosi.ije.2015.28.05b.10
1. INTRODUCTION1
In the hub covering problems, it is tried to satisfy demand points with less cost. So some points should be located as hub facilities to transfer goods with a discount rate. Each located hub can cover demands inside its covering radius. Between established hubs, the amount of cargo is greater than usual transportation, so suitable vehicles for carrying the cargos is essential to decrease transportation time between hubs. Utilizing mentioned vehicles can lead to lower transportation cost but will increase fixed costs. Some services in the hub nodes such as switching, transshipment and sorting needs special technology and facility [1]. So, in the real world, during locating hubs, other characteristics of hub facilities should be determined according the hubs operations, number of nodes, zone condition and etc.
1*Corresponding Author’s Email: [email protected](M.
rezanezhad)
In this study, the model of mohammadi et al. [2] is extended and three characteristics of cargos preparation in hubs are considered which are named sorting time, sorting cost and reliability of hubs. In the real world, mentioned characteristics are usually desirable.
As one of applications of the proposed model, the networks can be mentioned that some finishing operations are implemented inside of hub nodes. For example in international trading, customs of each country can be considered as a hub node while some operations such as quality, document and legal controls should be done in such nodes. In mentioned networks, reliability is a fundamental aspect and should be considered. Kim et al. [3] considered the reliability computation formula in the hub location problem. In this paper reliability is considered during network design while the reliability has two dimensions in the proposed model:
1. Reliability of established hub nodes and their facility. 2. Covering reliability.
Therefor novelty of this paper can be summarized as follows:
· Four objective functions are considered to cover mentioned characteristics, so a reliable multi objective model for hub covering location
problem is presented.
· Technological hub facilities are considered while in previous studies all hub facilities are
assumed to be the same.
· Optimum type of facilities are determined according to their capabilities.
· The proposed model is solved by NSGA-II algorithm and Pareto solutions are identified. The remainder of this paper is organized as follows. Section 2 contains a review about the hub covering problem. In Section 3 the extended mathematical model is presented. In the section 4, NSGAII algorithm is defined to solve the problem. In the section 5 numerical examples and sensitivity analysis are presented. Finally, in the last section concluding remarks are defined.
2. LITERATURE REVIEW
O’Kelly [4] proposed the first mathematical formulation and solution method for the hub location problem.
Campbell [5] compared rectilinear distance
transportation costs for hub networks with two types of demands to investigate how well an idealized model predicts the cost for the real-world demand. Campbell [6] presented an integer programing formulation for four types of discrete hub location problems: the p-hub median problem, the uncapacitated hub location problem, p-center and covering problems.
Many papers have been published about application of hub location problems. Some applications in the hub location problem are airlines and airports industries, emergency services, supply chain management–logistic, transportation systems and so on. Toh [7], Shaw [8] and Alder et al. [9] discussed application of hub location network for airlines and aviation industry. Hakimi [10] and Berman et al. [11] studied application of hub location problem in emergency services and similarly Wang et al. [12] and Ishfaq et al. [13] studied it in the supply chain management–logistic. Don et al. [14], Cunha et al. [15], Takno et al. [16], Gelareh et al. [17] studied the hub problem in the transportation system.
Many researches tried to extend hub location problems. Campbell [5] and Campbell [6] studied the hub arc location problem, Baharet al. [18] studied the latest arrival hub location problem and Kim et al. [3], An et al. [19] and Azizi et al. [20] studied reliable hub location problem. They are some of recently extensions to the traditional hub location problem which are described more in the following. Bahar et al. [18] considered unloading, loading and sorting operators for
latest arrival hub location problem with stopovers and proposed nonlinear and linear integer programing. Kim et al. [3] presented a reliable p-hub location problem, which focuses on maximizing network performance in terms of reliability by locating hubs for delivering flows among city nodes. Karimi et al. [21] proposed a capacitated hub location problem by hierarchical approach. Yahyaei et al. [22] presented a multi-criteria logistic hub location problem and utilized a Meta-model to reduce uncertainty effect. Mohammadi et al. [2] present a stochastic multi-objective multi-mode transportation model for hub covering location problem under uncertainty.
Also the review of Zanjirani Farahani et al. [23] can be proposed as a comprehensive review of the hub location problems. To the best of our knowledge, there is no previous study to determine hub capability in the hub covering location problem while its consideration with other decisions simultaneously can improve network efficiency.
Also, about considering reliability in the hub network, An et al. [19] proposed a set of two-stage robust optimization models to design reliable p-median facility location networks subjected to disruptions. Azizi et al. [20] proposed a model for hub location problem that build reliable network by explicitly considering possible disruption at hub facilities in the design stage. They used a backup facility in hubs when they stops normal operating. The entire demand in that hub is initially served by the backup facility. Eghbalizarch et al. [24] studied carrying different cargo type in the hub network under various levels of services such as price, reliability and transit time and solve their model by different evolution algorithms. Hamidi et al. [25] proposed a new concept of hub location problem that called preventive reliable hub location problem. The another added three objective functions in the usual model to make model more reliable and save all common properties, called fake hub, fake allocation and fake follow. Kim et al. [3], Davari et al. [26], Zarandi et al. [27] are some examples of studies that considered path reliability in the hub location problem. Another studies about reliability prepared in Table 1. In the previous studies, covering reliability was never considered. Because of importance of covering reliability and path reliability we aim to consider mentioned dimensions of reliability in the proposed model and propose a more reliable network by trustworthy operating radius.
competitive algorithm for large instances. Ghodratnama et al. [29] compared three Meta-heuristics to solve p-hub location problem. Parvaresh et al. [30] formulated multiple allocation p-hub median problem by a bi-objective model and two bi-objective functions. They proposed a multi objective simulated annealing algorithm to solve their model. Geramianfar et al. [31] studied a multi-objective hub covering location problem. The authors considered two objective functions to minimize total cost and total waiting time in hubs and utilized NSGA-II algorithm to obtain Pareto solutions.
Eghbali et al. [32] proposed a Multi-objective reliable hub covering location. The author considered two objective functions to minimize total cost and maximize the customer convenience. They utilized NSGA-II algorithm to obtain Pareto solutions. In this paper, we propose NSGA-II algorithm to obtain Pareto solutions of the proposed model.
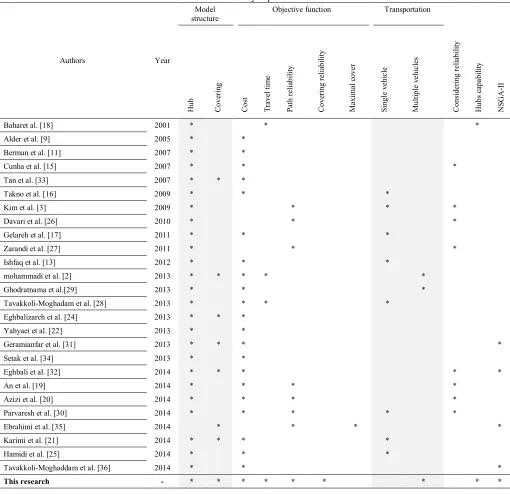
Finally, a summary of previous related works are compared with our proposed model which is presented in Table 1.
TABLE 1.Summary of previous studies.
Authors Year
Model
structure Objective function Transportation
C
on
si
de
ri
ng
r
el
ia
bili
ty
H
ub
s
ca
pa
bili
ty
N
SGA
-II
H
ub
C
ov
er
in
g
C
os
t
T
ra
ve
l ti
m
e
Pa
th
r
eli
ab
ilit
y
C
ov
er
in
g
re
lia
bilit
y
M
ax
ima
l c
ov
er
Si
ng
le
v
eh
ic
le
M
ulti
pl
e
ve
hi
cl
es
Baharet al. [18] 2001 * * *
Alder et al. [9] 2005 * *
Berman et al. [11] 2007 * *
Cunha et al. [15] 2007 * * *
Tan et al. [33] 2007 * * *
Takno et al. [16] 2009 * * *
Kim et al. [3] 2009 * * * *
Davari et al. [26] 2010 * * *
Gelareh et al. [17] 2011 * * *
Zarandi et al. [27] 2011 * * *
Ishfaq et al. [13] 2012 * * *
mohammadi et al. [2] 2013 * * * * *
Ghodratnama et al.[29] 2013 * * *
Tavakkoli-Moghadam et al. [28] 2013 * * * *
Eghbalizarch et al. [24] 2013 * * *
Yahyaei et al. [22] 2013 * *
Geramianfar et al. [31] 2013 * * * *
Setak et al. [34] 2013 * *
Eghbali et al. [32] 2014 * * * * *
An et al. [19] 2014 * * * *
Azizi et al. [20] 2014 * * * *
Parvaresh et al. [30] 2014 * * * * *
Ebrahimi et al. [35] 2014 * * * *
Karimi et al. [21] 2014 * * * *
Hamidi et al. [25] 2014 * * *
Tavakkoli-Moghaddam et al. [36] 2014 * * *
The review of previous studies about the hub location problem confirms that some extensions have been developed for the hub location problem according to the real world applications. As a best of our knowledge, there is no direct study of reliable hub location problem considering hub capabilities in previous studies, so in this study we try to formulate the reliable hub location problem when hubs have different capabilities in the network.
3. MATHEMATICAL FORMULATION
In this section sets, parameters and variables are introduced.
Sets:
{1... }
n= N Set of nodes.
1 {1... 1}
v= V Set of vehicles that can be used for pathway between hubs and non-hub nodes.
2 {1... 2}
v = V Set of special vehicles that can be used for pathway between two hubs.
{1... }
s= S Set of sorting facilities that can be assigned to
opened hubs. Parameters:
P Number of hubs that should be established at
the network.
,
s k
R Reliability rate of kth hub by using sth facility
in the hub.
,
i k
d Distance between nodes i and k.
1, ,
1v i k
C Unit transportation cost between nodes i and k using vehicle v1.
2, ,
2v k l
C Unit transportation cost between hubs k and l using vehicle v2.
1, ,
v i k
T Transportation time between nodes i and k using vehicle v1.
2, ,
v k l
T Transportation time between nodes k and l
using vehicle v2.
,
s k
TS Sorting time of facility s at hub k.
1v i k1, ,
r Risk factor at pathway i to k using vehicle v1.
2, , 2v k l
r Risk factor at pathway k to l using vehicle v2.
,
i j
W Flow to be sent from node i to node j.
1
v
F C Fixed cost of using vehicle v1.
2
v
FC Fixed cost of using vehicle v2.
,
s k
FS Sorting cost of facility s at hub k.
,
i k
F Fixed cost of constructing a pathway between nodes i and k.
k
F Fixed cost of opening a hub at node k.
k
G Capacity of hub k.
k
r
Covering nominal radius of hub k.1
v
C Capacity of vehicle v1.
2
v
C Capacity of vehicle v2.
1
maxv
NV Maximum available number of type v1
vehicles.
2 maxv
NV Maximum available number of type v2 vehicles.
i
O Total flow originating from node i.
i
D Total flow destined to node i.
b Maximum travel time between pair of nodes.
Variables:
1, ,
v i k
A Number of used vehicles type v1 in pathway
between node i to hub k
2, ,
v k l
B Number of used vehicles type v2 in pathway between hubs k and l
,
i k l
Y
Total flow from node i that is routed via hubs k and l,
i k
X
Is 1 if node i is allocated to hub k; otherwise, 0. Xkk= 1 shows that a hub is established at node k
,
k l
Z Is 1 if created a direct path between hub k and
l.
,
k s
Xs Is 1 if sorting facility s is allocated to hub k; otherwise, it is 0.
, , , 1i k l j
Y Is 1 if path i→k→l→jcreated.
, , , , , 2i k l j sk sl
Y Is 1 if path i→k→l→j created and sorting facility sk and sl assigned to hub k and l.
, ,
3i k s
Y Is 1 if node i allocated to hub k and sorting
facility s assigned to hub k. [0,1]
aÎ Time discount factor between two hubs.
M A large value.
The proposed model is defined as following.
Objective functions:
1, , 1, , , 1 , 1, ,
2, , 2, , , 2 , 2, ,
, , , ,
, ,
, , ,
1 ,
(2 1 1 )
( 2 2 )
+ i k
v i k v i k i k v i k v i k
v k l v k l k l v k l v k l
i k i k k l k l
i k k l
n
k k k s k k s
k k s
Min A C d FC X
B C d FC Z
F X F Z
F X FS Xs
¹ = + + + + + +
å
å
å
å
å
å
(i)Minb (ii)
, , , , , , ,
, , , , , , k l
2i k l j sk sl Rsk k Rsl l
i k l j sk sl
Max Y
¹
, , , ,
{ ( i k Y3i k s)/ Rs k } , , i k
Min Max d i k s
¹ " (iv)
Location and allocation constraints:
, 1 1 n i k k X i = = " å (1) , , ,
i k k k
X £X "i k (2)
, 1 n k k k X P = =
å
(3) , ,k s k k s
Xs =X "k
å
(4), , ,
i k i k k
d X £r "i k (5)
(6) (7) (8) Capacity constraints: , , , , , 1
1 , ,
n i
k l i k l j i j j
Y Y w i k l
=
=
å
" (9), , , ,
i
k l k k
Y £M X "i k l (10)
, , , ,
i
k l l l
Y £M X "i k l (11)
, 0 , ,
i k l
Y ³ "i k l (12)
, 1
( )
n
i i i k k i
O D X k
=
+ £ G "
å
(13)1
1 1
1 1, , max( , ) , , ,
V v
v v i k i i i k
C A O D X i k i k
=
³ " ¹
å
(14)2
2 2 , , ,
2 1 1
, ,
V n
i v v k l k l
v i
C B Y k l k l
= =
³ " ¹
å
å
(15)1, , max, 1 , , , 1
v i k v i k
A £NV X "i k v (16)
2, , max, 2 , , , 2
v k l v k l
B £NV Z "k l v (17)
Travel time constraints:
, , , , , , , , , ,
( ) 2
, , , , ,
i k k l l j s k s l i k l j sk sl
T T T TS TS Y
i k l j sk sl
a b
+ + + + £
" (18)
, , 1(1 , , 1) , , , , 1
i k v i k v i k i k
T +r X £T "i k v (19)
, , 2(1 , , 2) , , , , 2
i k v i k v i k i k
T +r X £T "i k v (20)
Linearization constraints:
(21)
(22)
(23)
(24)
, , ,
k l k k
Z £X "k l (25)
, , ,
k l l l
Z £X "k l (26)
(27)
(28)
(29)
(30)
Binary and integer constraints:
, , , , 1, , , 2, , , , , 3 , , {0,1}
, , , , ,
, , , ,
i k k sk k l i k l j i k l j sk sl i k s
X X Z Y Y Y
i k l j sk sl
Î
" (31)
1 , ,
,
2 , , i,k,l,v1,v2v i k v k l
A B " are integer variables (32)
The objective function of the proposed model consists of four parts. The part (i), minimizes total current investment costs including total transportation cost between all non-hub nodes to the hub nodes, total transportation cost between all hub links, total construction costs of pathways, total hubs establishment costs and finally total hiring cost of sorting facilities in hubs. The part (ii) of objective function, minimizes maximum traveling time between pair of nodes. The part (iii) of objective function maximizes total reliability of available paths. The part (iv) of objective function forces to allocate near nodes to more reliable hubs. Therefore, nodes will be covered by hubs with operating covering radius smaller than nominal covering radius. The mentioned operating covering radius try to appointment hub network in abnormal conditions. By utilizing objective (iv), a more reliable hub with acceptable operating covering radius is constructed to serve the nodes in most of conditions.
Constraints (1) and (31) together ensures single allocation strategy in the network. Constraint (2) assures that nodes can be allocated to only open hubs. Constraint
, , 1 3, , , ,
i k k s i k s X +Xs - £Y "i k s
, , ,
3i k s i k , , Y £ X "i k s
, , ,
3i k s k s , ,
Y £ Xs "i k s
, , 1 1, , , , , ,
i k j l i k l j
X +X - £Y "i k l j
, , , ,
1i k l j i k , , , Y £X "i k l j
, , , ,
1i k l j j l , , , Y £ X "i k l j
, , 1 , ,
k k l l k l X +X - £Z "k l
, , , , , , , , , ,
1 2 2
, , , , ,
i k l j k sk l sl i k l j sk sl
Y Xs Xs Y
i k l j sk sl
+ + - £ "
, , , , , , , ,
2i k l j sk sl 1i k l j , , , , , Y £Y "i k l j sk sl
, , , , , ,
2i k l j sk sl k sk , , , , ,
Y £ Xs "i k l j sk sl
, , , , , ,
2i k l j sk sl l sl , , , , ,
(3) assures that P hubs should be established in the network. Constraints (4) and (31) together enforce that a sorting facility have to be assigned for each established hubs. Constraint (5) makes sure that node i only can be allocated to hub k, if distance between i and k is less than the nominal covering radius. Constraints (6)-(8) make the product Y3 i k s, , = Xi k, ´Xsk s, to a linear form. Constraint (9) computes amount of flow from node i that is routed via hubs k and l. Constraints (10) and (11) together ensure that the value of i,
k l
Y can be more than zero if nodes k and l are the valid hubs. Constraint (12) ensures that i,
k l
Y is a positive value. Constraint (13) guarantees to meet the hub capacity. Constraints (14), (15) and (32) ensures that assigned number of vehicles can satisfy maximum flow in each node. Constraint (16) ensures that the number of assigned vehicle v1 to the path between node i to hub k is at most NVmaxv1 if and only if the link i to k is constructed. Constraint (17) enforces that number of vehicle v2 between hubs l and k
should be less than NVmaxv2 if the hubs are opened.
Constraint (18) determines largest time between pare of nodes. Constraints (19) and (20) compute maximum duration time between nodes i and k by different vehicles and considering related risk. Constraints (21)-(23) make product
, , , , ,
1i k l j i k j l
Y =X ´X to be in a linear form.
Constraints (24)-(26) make product Zk l, =Xk k,´Xl l, to a
linear form. Constraints (27)-(30) make product
, , , , , , , , , ,
2i k l j sk sl 1i k l j k sk l sl
Y =Y ´Xs ´Xs to a linear form.
4. SOLUTION ALGORITHM
We utilize non-dominated sorting genetic algorithm II (NSGA-II) to obtain the Pareto frontier and the results are compared with the results obtained by ε-constraint method. In section 4.1, the proposed solution representation is defined, in section 4.2, the proposed method of creating the neighbor solution is defined and in section 4.3, the proposed algorithm is presented.
4. 1. Solution Representation We use a feasible solution that consists of two parts of location-allocation representation and transportation mode representation. To generate a random initial solution following steps should be done (suppose n=10, s=3):
Step 1: Let us define location–allocation part representation by using a (3´n) matrix, n is the number of nodes. The first row shows the index of nodes (1...n). The second row is filled by uniformly generated random numbers between [0,100] as depicted in Figure 1.
Step 2: Node by number n, should be selected as a hub in the initial solution. Other P-1 hubs should be selected according to higher corresponding random values, then left nodes are allocated to nearest right
hubs in the solution representation. For example in Figure 2 it is shown that nodes 10, 7 and 4 have been selected as hub nodes while nodes 7 and 4 have larger corresponding random values. Also, the left nodes have been allocated to the nearest hub in the right side. For example nodes 5 and 6 is allocated to the hub 7.
need one vehicle of type 2 for pathways 8→10, 9→10 and vice versa and one vehicle type 2 for pathways 2→4, 4→2.
Similarly, Figure 6 represents number and type of vehicles between hubs for the example. Left number shows the type and right number represents number of vehicles between corresponding hubs.
4. 2. Generating Neighbor Solutions Two common operators called mutation and crossover are used in the genetic algorithm to generate neighbor solution. They are illustrated more for the proposed model in the following sections.
4. 2. 1. Mutation Operator In the mutation operator of genetic algorithm, one character of solution is changed randomly. The mutation operator in our problem has been designed to change one of three main characteristics in a solution which are selected hub nodes, allocation structure and hub capability. The mutation is performed in a solution by swapping allocation of two nodes, swapping opened hubs, opening a new hub with closing one of opened hubs, swapping capabilities of two hubs and finally adding a new capability to a hub with removing a capability from that hub. Each of mentioned states occur with equal probabilities. For example, consider a solution represented in Figure 3, we implement all of four states of mutation operator in mentioned solution.
Swapping allocation of nodes to hubs:
Select two random nodes and swap their allocation to hubs. For example, nodes 1 and 9 have been selected in the previous solution in Figure 3 and after swapping their allocation, the new solution is depicted in Figure 7.
Swapping hubs:
Select two random hubs of a solution and swap them. For example in Figure 3, suppose that hubs 10 and 4 have been chosen randomly, the final solution is depicted in Figure 8.
Insertion of a hub:
One of opened hubs is chosen randomly to be closed while the next node is opened as a new hub. For example in Figure 3, suppose that hub 4 is selected to be closed and node 2 is selected randomly as a new opened hub. Figure 9 represents the result of insertion of a hub. Swapping hub capabilities:
It is look like swapping hubs, so firstly two hubs are selected randomly and their capabilities are swapped. For example suppose that hubs 7 and 10 are selected. Figure 10 represents the final result of swapping the hubs capabilities in previous example:
Insertion of a hub capability:
One of opened hub is chosen randomly to be remove its capability while the next capability added as a new capability. For example in Figure 3, suppose that hub 7 is selected to be remove its capability and capability 3 is
selected randomly as a new capability. Figure 11 represent the result of insertion of a capability.
TABLE 2. Selected cities for the trade hub network in the example
Node number City name Node number City name
1 Ankara 6 Yazd
2 Shaantil 7 Esfahan
3 Baghdad 8 Ashghabad
4 Tabriz 9 Kabol
5 Shiraz 10 Mashhad
Figure 1. Generating random numbers to create feasible first part of a random solution
Figure 2. Locating hubs and allocation of nodes to opened hubs in the initial first part of a random solution
Figure 3. A complete random generated initial solution including location, allocation and type of facility in the hubs
Figure 4. Schematic view of a solution representation in an example of a trade hub network
Figure 6. Number and type of vehicles (from set V2) for pathway between hubs
Figure 7. Swapping allocation for the example solution
Figure 8. Swapping hubs for the example solution
Figure 9. Result of insertion of a hub for the example solution
Figure 10. Swapping hubs capability for the example solution
Figure 11. Result of insertion of a capability for example solution
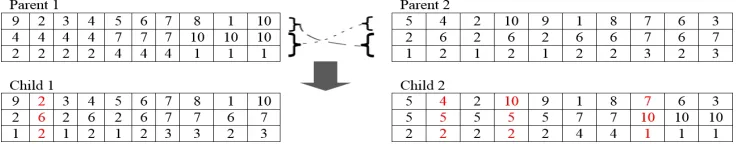
4. 2. 2. Crossover Operator By the crossover, two new solutions are generated according to their corresponding parents’ features. During the crossover operation, first row of parent 1 is merged by 2nd and 3rd
row of parent 2 which has been shown in Figure 12. Then, repairing of the solution is done to achieve feasible solutions. By looking at child 1, it is clear that it is an infeasible solution, because node 2 is a hub node while it has not been allocated to itself. The repaired feasible solution for both child 1 and 2 are depicted in Figure 13.
4. 3. Non-dominated Sorting Genetic Algorithm (NSGA-II) Non-dominate sorting genetic algorithm II (NSGA-II) was introduced by Deb et al. [37] in 2002.
The operators of genetic algorithm are used in NSGA-II as well, but in the NSGA-II more than one objective functions are available and solutions will be ranked in NSGA-II. NSGA-II is a subset of smart evolutionary methods, therefore after generating solutions in each iteration, all objective functions have to be computed. In the genetic algorithm, the value of the objective function is an important measure, but in the multi objective problems rank of a solution in Pareto sets is the decision measure. Sorting algorithm is utilized in the NSGA-II for ranking the solutions. Sorting algorithm compare all pair of solutions and rank them to the number of dominance. Solutions that have rank 1 are the Pareto frontier. We prepare a pseudo-code of the proposed NSGA-II algorithm for the reliable p-hub covering problem with hub capabilities. The proposed NSGA-II algorithm parameters whose values need to be set prior the algorithm execution are as follows:
N – Number of generations. Npop– Number of populations. CN -Number of crossover operations. MN - Number of mutation operations. Dn(i) – Number of domination for ith solution. Ds(i) – Set of solution that dominate solution i.
The pseudo-code of proposed NSGA-II algorithm is defined as follow.
Do:
Step 0. Generate initial feasible population and compute their
objective function values and let n=1.
Step 1. Sort and rank populations according their objective
function values. For (i=1 to Npop)
For (j=1 to Npop)
- If solution i dominates solution j, then Dn(j)=Dn(j)+1 and Ds(j)={Ds(j), i}.
Step 2. Select elite number of parents from the population by elite
strategy as a new generation.
Step 3. Do crossover for randomly selected parents from the
population. For (cn=1 to CN)
a) Select two solutions randomly and do crossover them to bring two new solutions.
b) Check the feasibility of new solutions.
c) Add each of feasible solution to collection of crossover solutions.
Step 4. Utilize mutation operation for some solutions.
For (mn=1 to MN)
- Select a solution and implement mutation operation.
Step 5.Combine elite and mutated and crossover solutions.
Step 6. Select Npop number of combined solutions and let n=n+1.
Step 7. If n≤N, go to step 1, else stop.
End.
Figure 13. Repaired solution of Figure 12
5. COMPUTATIONAL RESULTS
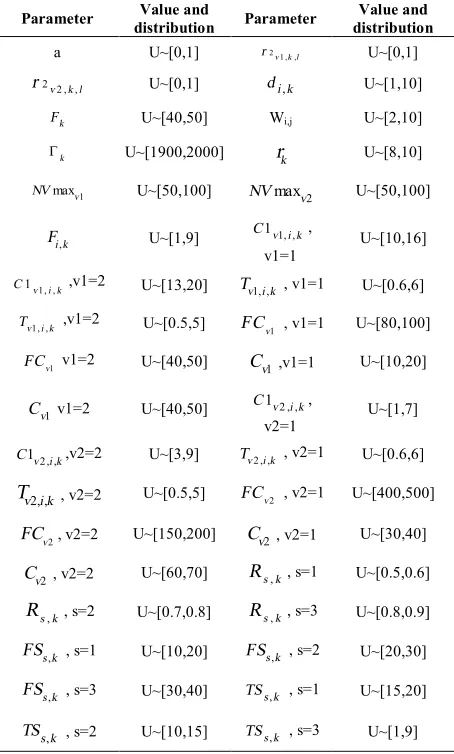
As mentioned before, the proposed model is solved by non-dominated sorting genetic algorithm (NSGA-II) and the results are compared with ε-constraint algorithm solved by Gams software. Because there is no data set about considering proposed model, the numerical examples are generated randomly. Value and distribution of random instances prepared in Table 3. However, we modified Turkish network data set and obtained the Pareto solution. Modification mechanism of Turkish network was prepared in Table 4. First, comparison is about classic model and proposed model to check the effect of considering hub capabilities and reliability parameters. Because the classic model could not consider such parameters, after optimizing the classic model, the parameters are added manually, now classic model and proposed model can be compared. Table 3 shows the cost function and transportation time value of instance 1 that is solved by two models.
Table 4 represent some change in Turkish network for utilize in proposed model, another characters generated according Table 3. Reported results in Table 5 confirms that the proposed model is more efficient than the classic one while the classic model can't consider hub capabilities. The proposed model can consider the capability of facilities and allocate suitable facilities to established hub by optimum value of objective functions. Figure 14 represents difference of the proposed and classic models in choosing of hubs capabilities. Part (a) in Figure 14 represents solution of classic model. As mentioned in part a, classic model could not choose optimum capabilities.
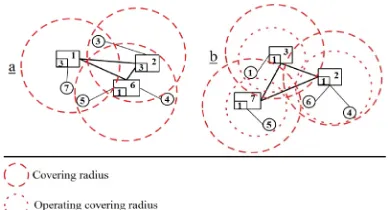
As mentioned in section 3, we should try to allocate nodes to near hubs with more reliability. Figure 15 part a, represents result of classic model and Figure 15 part b represents result of proposed model in compare nominal covering radius and operating covering radius and hubs reliability. As mentioned in Figure 15, utilizing objective function (iv) in the proposed model, ensure nodes to be allocated to near more reliable hubs. Therefore, in abnormal (failure) conditions, the proposed network will survive hub network activities by operating covering radius.
Another sensitive analysis is about parameters such as nominal radius and number of hubs, so we utilize
'k k
r =d r instead of rk in the following sensitive analysis. As mentioned in Table 6, by increasing of d , difference of nominal radius and operating radius is
decreased. Therefore, the proposed model could prepared more efficient network in abnormal conditions by operating radius. In Table 7, by decreasing of P, the proposed model prepared more reliable network than the classic one. As hub location problems size are large enough in real world applications, we try to solve the proposed model for large instances. Then, we try to consider the performance of the proposed solution approach.
TABLE 3. Value and distribution of random instances
Parameter distribution Value and Parameter distribution Value and
a U~[0,1] r2v k l1 , , U~[0,1]
2 , ,
2v k l
r U~[0,1] di k, U~[1,10]
k
F U~[40,50] Wi,j U~[2,10]
k
G U~[1900,2000] rk U~[8,10]
1 maxv
NV U~[50,100] NVmaxv2 U~[50,100]
,
i k
F U~[1,9] C1v i k1, , ,
v1=1 U~[10,16]
1, ,
1v i k
C ,v1=2 U~[13,20] Tv i k1, , , v1=1 U~[0.6,6]
1, ,
v i k
T ,v1=2 U~[0.5,5]
1
v
FC , v1=1 U~[80,100]
1
v
FC v1=2 U~[40,50] Cv1 ,v1=1 U~[10,20]
1
v
C v1=2 U~[40,50] C1v i k2 , , ,
v2=1 U~[1,7]
2, ,
1v i k
C ,v2=2 U~[3,9] Tv i k2 , , , v2=1 U~[0.6,6]
2, ,
v i k
T , v2=2 U~[0.5,5] FCv2 , v2=1 U~[400,500]
2
v
FC , v2=2 U~[150,200] Cv2 , v2=1 U~[30,40]
2
v
C , v2=2 U~[60,70] Rs k, , s=1 U~[0.5,0.6]
,
s k
R , s=2 U~[0.7,0.8] Rs k, , s=3 U~[0.8,0.9]
,
s k
FS , s=1 U~[10,20] FSs k, , s=2 U~[20,30]
,
s k
FS , s=3 U~[30,40] TSs k, , s=1 U~[15,20]
,
s k
TS , s=2 U~[10,15] TSs k, , s=3 U~[1,9]
N (Number of nodes) are assumed as: 5, 7, 10, 50, 70 V1 (Number of vehicle type v1) is 2
Figure 14. Comparing of the proposed model with classic one in minimizing the total cost.
Figure 15. Effect of objective function (iv) in the hub covering network
TABLE 4. Modification of Turkish network parameters.
1, ,
v i k
T , v1=1 T×(1+0.1)
1, ,
v i k
T , v1=2 T×(1+0.05)
2 , ,
v i k
T , v1=1 T×(1-0.1) Tv2 , ,i k , v1=2 T×(1-0.05)
1
v
F C , v1=1 U~[8,10]×10 3
2
v
F C , v2=1 U~[4,5]×10 4
1
v
F C v1=2 U~[4,5]×10 3
2
v
F C , v2=2 U~[150,200]×10 3
k
r U~[900,1200] Gk U~[50,60]×10 6
T: Travel time in Turkish network.
TABLE5. Objective function values of instance 1 solved by two models in Gams software
Value of cost function Value of time function Classic
model
Proposed model
Classic model
Proposed model Minimizing
cost: 1967.64 1908.640 39.6 45.6
Minimizing
time: 560254 532054 39.2 13.6
Effect of decreasing number of P in the proposed model is investigated and the results were reported. We use proposed operators in the GA algorithm to solve single objective form of the model then we try to solve
the multi-objective form by NSGA-II algorithm. As mentioned in Table 8, by increasing of the size of instances, the problem will be more complex, therefore efficiency of the solution algorithm will be an important factor. Moreover, results of Table 8 confirms that the performance of genetic algorithm is acceptable while the gap is small enough.
For solving the problem with multiple objectives, some indices are utilized for measuring quality of Pareto solutions. Distribution and convergence of Pareto solutions have to be considered simultaneously. Okabe et al. [38] provided an overview of the various Performance Indices. We utilize generational distance (GD) proposed by Veldhuizen et al. [39] and Veldhuizen et al. [40] to calculate the average distance of NSGA-II’s solutions to ε-constraint’ solutions. we also utilize spacing (SP) proposed by Schott [41] to calculate diversity of solutions.
The model in small size can be solved exactly by Gams software, but when number of nodes is increased to 10 nodes the computational time of exact solution will be very long. The proposed algorithm is used for solving different instances and are compared with result of the exact solution. Table 9 shows the computational results and confirms efficient performance of the proposed algorithm for the p-hub covering location problem with hub capabilities. Also, some of Pareto solution for modified Turkish network is described in Table 10.
TABLE 6. Sensitivity analysis of increasing the nominal radius
d R NR OR NR-OR
0.7 0.8 6.4 6.24 0.16
1 0.86 8 6.56 1.44
1.3 0.82 10.4 6.24 4.16
1.6 0.82 12.8 6.24 6.56
2 0.82 16 6.24 9.76
R: Maximum reliability of available facility in the network. NR: Maximum of available nominal radius in hub nodes. OR: Maximum of operating radius in hub nodes.
NR-OR: Difference between nominal and operating radius in the network.
TABLE 7. Sensitivity analysis of increasing number of hubs
P R NR OR NR-OR
3 0.86 8 6.56 1.44
4 0.9 8 4.81 3.91
5 0.86 8 7.87 0.13
TABLE 8. Comparing exact method and genetic algorithm for different instances.
Gams GA
%Gap Gams GA %Gap
Mi
n
im
iz
in
g
co
st
T V T V
Mi
n
im
iz
in
g
ti
me
T V T V
5*5 8.28 1908.64 8.26 1908.64 0% 8.2 13.6 7.3 13.6 0%
7*7 70.95 2148.84 29.6 2246.86 0.04 72.36 14.76 48 15.2 0.03
10*10 1000.06 3371 282.82 3707.12 0.01 579.72 12 347 12.12 0.01
50*50 - - 298.04 77697 - - - 11763.48 29.2 -
70*70 - - 1154.3 160516.6 - - - 45638 23.2 -
Gams GA
%Gap Gams GA %Gap
M
ax
im
iz
in
g
pa
th
re
lia
bili
ty
T V T V
Mi
n
im
iz
in
g
cov
er
in
g
re
lia
bili
ty
T V T V
5*5 26.33 12.353 0.88 12.353 0% 8.13 4.363 1.45 4.363 0%
7*7 1000.03 24.53 1.87 24.53 0% 81.91 5.344 2.59 5.344 0%
10*10 1000.36 21.04 2.52 21.76 0.03 940.05 5 26.4 5.07 0.01
50*50 - - 1001.36 1230.91 - - - 380.66 11.34 -
70*70 - - 4145 2458.87 - - - 1542.8 11.23 -
T: Computational Time, V: Objective function value
TABLE 9. Computational results and comparing quality of solutions
IN Performance Indices Solving Method Convergence: GD(S,P)
ε-constraint NSGA-II
Diversity : SP(S) 30.5932 35.3139
37.4166
5*5 Computational time (minutes) 3 1.5235
Number of solutions in the Pareto front 3 5
Diversity : spacing 7.0510 30.1172 43.4955
7*7 Computational time (minutes) 58 4.9683
Number of earned solution 6 7
Diversity : spacing - 70.8178
-
10*10 Computational time (minutes) - 19.72
Number of earned solution - 5
Diversity : spacing - 3323.26
-
50*50 Computational time (minutes) - 141.68
Number of earned solution - 6
Diversity : spacing - 3905.7
-
70*70 Computational time (minutes) - 538.6062
Number of earned solution - 5
Diversity : spacing - 20428000
-
Turkish network: 81*81 Computational time (minutes) - 44324
Number of earned solution - 17
TABLE 10. Some of Pareto solutions for Turkish network
Solution number Index of established hub Utilized facility Cost function Time function Path reliability Covering reliability
1
Node 11 Type 2
343429686 2103.4 2216.46 1946.57
Node 50 Type 2
Node 81 Type 2
2
Node 40 Type 1
306067879.8 2376.6 1870.3 3009.4
Node 50 Type 3
Node 81 Type 3
3
Node 17 Type 3
355565790.0 2557.2 2335.10 2064.29
Node 38 Type 2
Node 81 Type 2
6. CONCLUSION
Considering of previous studies shows that hubs are considered similar while in most of real cases hubs are not similar to each other. For example, in the operating hubs, hub capabilities differ from one hub to another one. In this paper, a model was presented to establish a hub network with considering of capabilities inside of hub facilities. Some numerical examples with different sizes were solved and the comparison confirms that more efficient hub network can be constructed by the
7. REFERENCES
1. Alumar, S., Kara, B. Y., "Network hub location problems: The
state of the art",European Journal of Operational Research, Vol. 45, No. 1, (2008), 1-21.
2. Mohammadi, M., Jolai, F., R. Tavakkoli-Moghaddam,
"Solving a new stochastic multi-mode p-hub covering location problem considering risk by a novel multi-objective
algorithm",Applied Mathematical Modelling, Vol. 37, No. 24,
(2013), 10053-10073.
3. Kim, H., M. E. O'Kelly, "Reliable p-Hub Location Problems in
Telecommunication Networks",Geographical Analysis, Vol.
41, No. 3, (2009), 283-306.
4. O'Kelly, M. E., "The location of interacting hub facilities",
Transportation Science, Vol. 20, No.2 , (1986), 92-106.
5. Campbell, J. F., "Continuous and discrete demand hub location
problems",Transportation Research Part B: Methodological,
Vol. 27, No. 6, (1993), 473-482.
6. Campbell, J. F., "Integer programming formulations of discrete
hub location problems",European Journal of Operational
Research, Vol. 72, No. 2, (1994), 387-405.
7. TOH, R.S. , "The Impact of Hub and Spoke Network
Centralization and Route Monopoly on Domestic Airline Profitability",Transportation Journal, Vol. 24, No. 4, (1985), 16-27.
8. Shaw, S.L., "Hub structures of major US passenger airline",
Journal of Transport Geography, Vol. 1, No. 1, (1993), 47-58.
9. Alder, N., Hashai, N., "Effect of open skies in the Middle East
region",Transportation Research, Vol. 39, No. 20, (2005), 878-894.
10. Hakimi, S. L., "Optimum location of switching centers and the
absolute centers and medians of agraph",Operations Research,
Vol. 12, No. 3, (1964), 450-459.
11. Berman, O., Drezner, Z. , Wesolowsky, G. O., "The transfer
point location problem",European Journal of Operational
Research, Vol. 179, No. 3, (2007), 978-989.
12. Wang, J. J., Cheng, M. C., "From a hub portcity to a global supply chain management center: A casestudy of Hong
Kong",Journal of Transport Geography, Vol. 18, No. 1,
(2010), 104-115.
13. Ishfaq, R., Sox, C. R., "Design of intermodal logistics networks
with hub delays",European Journal of Operational Research,
Vol. 220, No. 3, (2012), 629-641.
14. Don, T., Harit, S. , English, J. R. , Whicker, G., "Hub and spoke networks in truck load trucking: Configuration testing and operational concerns",Logistics and Transportation, Vol. 31, (1995), 209-237.
15. Cunha, C.B., Silva, M. R., "A genetic algorithm for the
problem of configuring a hub-and-spoke network for a LTL
trucking company in Brazil",European Journal of
Operational Research, Vol. 179, No. 3,(2007), 747-758. 16. Takano, T., Arai, M., "A genetic algorithm for the
hub-and-spoke problem applied to containerized cargo transport",
Journal of Marine Scienceand Technology, Vol. 14, No. 2, (2009), 256-274.
17. Gelareh, S., Nickel, S., "Hub location problems in
transportation networks"Transportation Research Part E, Vol.
47, No. 6, (2011), 1092-1111.
18. Bahar Y. Kara, B.T., "The Latest Arrival Hub Location
Problem", Management Science, Vol. 47, No. 10, (2001),
1408-1420.
19. An, Yu., Zeng, Bo., Zhang , Yu., Zhao, Long., "Reliable p-median facility location problem: two-stage robust models and
algorithms", Transportation Research Part B:
Methodological, Vol. 64, No. 2, (2014), 54-72.
20. Azizi, N., Chauhan, Satyaveer, Salhi, Said, Vidyarthi, Navneet, "The impact of hub failure in hub-and-spoke networks:
Mathematical formulations and solution
techniques",Computers & Operations Research, online
poplished, (2014).
21. Karimi, M., Eydi, A.R., Korani, E., "Modeling of the capacitated single allocation hub location problem with a hierarchical approch",International Journal of Engineering, Transactions A: Basics, Vol. 27, No. 4, (2014), 573-586. 22. Yahyaei, M., Bashiri, M., Garmeyi, Y., "Multi-criteria Logistic
Hub Location by Network Segmentation under Criteria
Weights Uncertainty (RESEARCH NOTE)",International
Journal of Engineering, Vol. 27, No. 8, (2013), 1205-1214. 23. Zanjirani Farahani, R., Hekmatfar, M., Arabani, A., Nikbakhsh,
E., "Hub location problems: A review of models, classification,
solution techniques, and applications", Computers &
Industrial Engineering, Vol. 64, No. 4, (2013), 1096-1109. 24. EghbaliZarch, M., Abedzadeh, M., Setak, M., "Differential
evolution algorithm for multi-commodity and multi-level of service hub covering location problem",International Journal of Industrial Engineering Computations, Vol. 4, No. 1, (2013), 127-138.
25. Hamidi, M., Gholamian, M., Shahanaghi, K., "Developing prevention reliability in hub location models", Proceedings of the Institution of MechanicalEngineers, Part O: Journal of Risk and Reliability, Vol. 228, No. 4, (2014), 337-346. 26. Davari, S., Zarandi, M.H.F., Turksen, I.B., "The fuzzy reliable
hub location problem. in Fuzzy Information Processing Society
(NAFIPS)",Annual Meeting of the North American,(2010).
27. Zarandi, M.H.F., Davari, S., Sisakht, A.H., "Design of a reliable hub-and-spoke network using an interactive fuzzy goal
programming. in Fuzzy Systems (FUZZ)", IEEE International
Conference on 2011, (2011).
28. Tavakkoli-Moghaddama, Gholipour-Kanani, Y., R.,
Shahramifarc, M., "A Multi-objective Imperialist Competitive Algorithm for a Capacitated Single-allocation Hub Location
Problem", International Journal of Engineering, Vol. 26, No.
6, (2013), 605-620.
29. Ghodratnama, A., Tavakkoli-Moghaddam, R., Baboli, A., "Comparing three proposed meta-heuristics to solve a new
p-hub location-allocation problem", International Journal of
Engineering, Vol. 26, No. 9, (2013), 1043-1058.
30. Parvaresh, F., Husseini, S. M. M., Golpayegany, S. A. H., "Hub network design problem in the presence of disruptions",
Journal of Intelligent Manufacturing, Vol. 25, No. 4, (2014), 755-774.
31. Geramianfar, R., Pakzad, M., Golhashem, H., Tavakkoli-Moghaddam, R., "A multi-objective hub covering location problem under congestion using simulated annealing
algorithm",Uncertain Supply Chain Management, Vol. 1, No.
3, (2013), 153-164
32. Eghbali, M., Abedzadeh, M., Setak, M., "Multi-objective reliable hub covering location considering customer
convenience using NSGA-II",International Journal of System
Assurance Engineering and Management, Vol. 5, No. 3, (2014), 450-460.
33. Tan, Z., Kara, Y., "A hub covering model for cargo delivery systems",Networks, Vol. 49, No. 1, (2007), 28-39.
34. Setak, M., Karimi, H., Rastani, S., "Designing Incomplete Hub
Location-routing Network in Urban Transportation
Problem",International Journal of Engineering, Vol. 26, No.
9, (2013), 997-1006.
35. Ebrahimi Zade, A., Sadegheih, A., Lotfi, M., "A modified NSGA-II solution for a new multi-objective hub maximal
covering problem under uncertain shipments",Journal of
Industrial Engineering International, Vol. 10, No. 4, (2014), 185-197.
36. Tavakkoli-Moghaddam, R. Sedehzadeh, S., "A multi-objective imperialist competitive algorithm to solve a new multi-modal tree hub location problem", Nature and Biologically Inspired Computing (NaBIC), Sixth World Congress on. 2014, (2014), 202 - 207.
37. Deb, K., Pratap, A., Agarwal, S., Meyarivan, T., "A fast and
elitist multiobjective genetic algorithm: NSGA-II",
38. Okabe, T., Jin, Y., Bernhard, S., "A critical survey of
performance indices for multi-objective optimisation",
Evolutionary Computation, Vol. 2, (2003), 878-885.
39. Veldhuizen, D. A. V., Lamont, G. B., "Evolutionary
Computation and Convergence to a Pareto Front" Late
Breaking Papers on the Genetic Programmming Conference, (1998), 221-228.
40. Veldhuizen, D.A.V., "Multiobjective Evolutionary Algorithms: Classifications, Analyses, and New Innovations", Faculty of the
Graduate School of Engineering of the Air Force Institute of Technology, Air University, Dissertation, (1999).
41. Schott, J.R., "Fault Tolerant Design Using Single and Multicriteria Genetic Algorithm Optimization",Master Thesis, Boston, MA: Department of Aeronautics and Astronautics, Massachusetts Institute of Technology, (1995), 199-200.
A Reliable Multi-objective
p
-hub Covering Location Problem Considering of Hubs
Capabilities
M. Bashiri, M. Rezanezhad
Department of Industrial Engineering, Shahed University, Tehran, Iran
P A P E R I N F O
Paper history:
Received 01 November 2014
Received in revised form 18 December 2014 Accepted 29 January 2015
Keywords:
P-Hub Covering Hub Capability Reliability Multi Objective
هﺪﯿﮑﭼ
ﯽﻣﯽﺑﺎﯿﻧﺎﮑﻣﻞﺋﺎﺴﻣردلواﺪﺘﻣفاﺪﻫازانﺎﻣزﺶﻫﺎﮐوﻞﮐﻞﻘﻧوﻞﻤﺣﻪﻨﯾﺰﻫﺶﻫﺎﮐهراﻮﻤﻫ ﺪﻨﺷﺎﺑ
.
ﻪﻠﺌﺴﻣردﯽﻠﺻافﺪﻫ
ﯽﺸﺷﻮﭘﯽﺑﺎﯿﻧﺎﮑﻣ
P
-ﯽﻣهﺪﺷﺲﯿﺳﺎﺗيﺎﻫرﻮﺤﻣﻪﺑﺎﻫهﺮﮔﺺﯿﺼﺨﺗوﺎﻫرﻮﺤﻣﯽﺑﺎﯾﺎﺟ،رﻮﺤﻣ ردﻪﮐﯽﺗرﻮﺻﻪﺑﺪﺷﺎﺑ
ﺎﻫرﻮﺤﻣﯽﺸﺷﻮﭘعﺎﻌﺷ ﺪﻧﺮﯿﮕﺑراﺮﻗ
.
ﺖﯿﻠﺑﺎﻗعﻮﻧﻦﯿﯿﻌﺗﺎﻣفﺪﻫ،ﻪﻟﺎﻘﻣﻦﺑارد ﮏﯾﻪﺑنﺪﯿﺳرياﺮﺑهﺪﺷﺲﯿﺳﺎﺗرﻮﺤﻣيﺎﻫ
ﯽﻣﺮﺘﺸﯿﺑنﺎﻨﯿﻤﻃاﺖﯿﻠﺑﺎﻗﺎﺑﻪﮑﺒﺷ ﺪﺷﺎﺑ
.
ﯽﻣﯽﻧﺎﻨﯿﻤﻃاﻞﺑﺎﻗرﻮﺤﻣﻪﮑﺒﺷﻞﯿﮑﺸﺗﻪﺑيدﺎﻬﻨﺸﯿﭘلﺪﻣﻦﯿﻨﭽﻤﻫ ﻪﺑنآردﻪﮐدزادﺮﭘ
ﯽﻤﺳاﯽﺸﺷﻮﭘعﺎﻌﺷزاهدﺎﻔﺘﺳايﺎﺠﺑﯽﯾاﺮﺟاﯽﺸﺷﻮﭘعﺎﻌﺷﻦﯿﯿﻌﺗ ﺖﺳاهﺪﺷﻪﺘﺧادﺮﭘ
.
ندادنﺎﺸﻧياﺮﺑ لﺪﻣيﺎﻫﺮﺘﻣرﺎﭘﺮﯿﺛﺎﺗ
ﺖﺳا ﻪﺘﻓﺮﮔ ترﻮﺻ ﺎﻫﺮﺘﻣارﺎﭘ ﻦﯾا يور ﯽﺘﯿﺳﺎﺴﺣ ﻞﯿﻠﺤﺗ ،يدﺎﻬﻨﺸﯿﭘ
.
شور ﻂﺳﻮﺗ يدﺎﻬﻨﺸﯿﭘ ﻪﻓﺪﻫ ﺪﻨﭼ لﺪﻣ
ε
-constraint
ﻢﺘﯾرﻮﮕﻟازاگرﺰﺑيﺎﻬﻟﺎﺜﻣياﺮﺑوهﺪﺷﻞﺣﮏﭼﻮﮐيﺎﻫهزاﺪﻧاﺎﺑﯽﯾﺎﻬﻟﺎﺜﻣياﺮﺑ
NSGA-II
ﺖﺳﺪﺑياﺮﺑ
شورﺞﯾﺎﺘﻧﺎﺑهﺪﻣآﺖﺳﺪﺑيﺎﻬﺑاﻮﺟوهﺪﺷهدﺎﻔﺘﺳاﻮﺗرﺎﭘيﺎﻬﺑاﻮﺟندروآ
ε-constraint
ﺖﺳاهﺪﺷﻪﺴﯾﺎﻘﻣ
.
شورولﺪﻣ
لﺎﺜﻣﻂﺳﻮﺗ ﻞﺣ يﺎﻫهدادﻪﻠﻤﺟزايدﺎﯾزيﺎﻫ
Turkish network
ترﻮﺻﺎﻫﺖﯿﺳﺎﺴﺣﻞﯿﻠﺤﺗﯽﺧﺮﺑوهﺪﺷﻞﯿﻠﺤﺗ
ﺖﺳاﻪﺘﻓﺮﮔ
.
ﯽﻣنﺎﺸﻧﺞﯾﺎﺘﻧ ﻮﺗهﺪﻣآﺖﺳﺪﺑﻪﮑﺒﺷﻪﮐﺪﻫد
ﮏﯿﺳﻼﮐﻪﮑﺒﺷﻪﺑﺖﺒﺴﻧيﺮﺘﺸﯿﺑﯽﯾارﺎﮐزايدﺎﻬﻨﺸﯿﭘلﺪﻣﻂﺳ
ﺖﺳارادرﻮﺧﺮﺑ