I
I
I
N
N
N
T
T
T
E
E
E
R
R
R
N
N
N
A
A
A
T
T
T
I
I
I
O
O
O
N
N
N
A
A
A
L
L
L
J
J
J
O
O
O
U
U
U
R
R
R
N
N
N
A
A
A
L
L
L
O
O
O
F
F
F
R
R
R
E
E
E
S
S
S
E
E
E
A
A
A
R
R
R
C
C
C
H
H
H
I
I
I
N
N
N
C
C
C
O
O
O
M
M
M
M
M
M
E
E
E
R
R
R
C
C
C
E
E
E
,
,
,
I
I
I
T
T
T
A
A
A
N
N
N
D
D
D
M
M
M
A
A
A
N
N
N
A
A
A
G
G
G
E
E
E
M
M
M
E
E
E
N
N
N
T
T
T
A Monthly Double-Blind Peer Reviewed Refereed Open Access International e-Journal - Included in the International Serial Directories
Indexed & Listed at: Ulrich's Periodicals Directory ©, ProQuest, U.S.A., Open J-Gage, India as well as in Cabell’s Directories of Publishing Opportunities, U.S.A.
C
C
C
CONTENTS
ONTENTS
ONTENTS
ONTENTS
Sr.
No.
TITLE & NAME OF THE AUTHOR (S)
Page No.
1
.
INFORMATION TECHNOLOGY AND ITS APPLICATION AMONG USERS & NON-USERS IN IRANDR. ALI BARATI DEVIN
1
2
.
ACADEMIC STAFF’S PERCEPTION OF ADMINISTRATIVE STAFF SERVICES IN ETHIOPIA: A CASE STUDY OF ADI-HAQI CAMPUS, MEKELLE UNIVERSITYDR. TESFATSION SAHLU DESTA
5
3
.
XBRL, THE 21ST CENTURY DATA SOURCE AND DATABASE LEVEL DATA VALIDATIONFABOYEDE, S.O., MUKORO, D. & OLOWE, O.
15
4
.
ORGANISATIONAL CULTURE MANACLES TO EMBARK UPON DURING GLOBAL CONDENSEDR. A. CHANDRA MOHAN, DR. K. VASANTHI KUMARI & DR. P. DEVARAJ
22
5
.
IMPACT OF REFORMS ON THE SOUNDNESS OF INDIAN BANKINGSAHILA CHAUDHARY & DR. SULTAN SINGH
26
6
.
ASSURING QUALITY USING 6 SIGMA TOOL - DMAIC TECHNIQUEANOOP C NAIR
34
7
.
COMMUNITIES OF PRACTICE: THEIR ROLE IN THE CREATION AND TRANSFER OF KNOWLEDGE IN ORGANISATIONSDR. ROOPA T.N. & RAGHAVENDRA A.N.
39
8
.
MAMAGEMENT OF OVERALL PRODUCTIVITY IN SPOT WELDING CARRIED OUT IN WELD DIVISION OF A LIMITED COMPANYDR. G RAJENDRA, AKSHATHA V. M & HARSHA D
43
9
.
A STUDY ON THE PERFORMANCE OF INVENTORY MANAGEMENT IN APSRTCDR. K. SAI KUMAR
48
10
.
IMPACT OF CHANGES IN ENTRY LOAD STRUCTURE OF MUTUAL FUND SCHEMES – EVIDENCE FROM INDIAN MUTUAL FUND INDUSTRYN. VENKATESH KUMAR & DR. ASHWINI KUMAR BJ
56
11
.
A COMPARATIVE ANALYSIS OF MARKET RETURNS AND FUND FLOWS WITH REFERENCE TO MUTUAL FUNDSR. ANITHA, C. RADHAPRIYA & T. DEVASENATHIPATHI
62
12
.
WOMEN EMPOWERMENT AND ENTREPRENEURSHIP THROUGH SHGs -A STUDY OF CHIKKABALLAPUR DISTRICTDR. S. MURALIDHAR, K. SHARADA & NARASAPPA.P.R
67
13
.
ANDHRA PRADESH STATE FINANCIAL CORPORATION FOR THE DEVELOPMENT OF MICRO, SMALL AND MEDIUM ENTERPRISES (MSMEs) - A STUDY OF TIRUPATI BRANCH IN CHITTOOR DISTRICTDR. K. SUDARSAN, DR. V. MURALI KRISHNA, DR. KOTA SREENIVASA MURTHY & DR. D. HIMACHALAM
72
14
.
IMPACT OF SERVICE QUALITY AND CUSTOMER SATISFACTION ON REPURCHASE INTENTIONARUP KUMAR BAKSI & DR. BIVRAJ BHUSAN PARIDA
80
15
.
AN EMPIRICAL RESEARCH ON MOBILE USERS INTENTION AND BEHAVIOUR TOWARDS MOBILE ENTERTAINMENT SERVICES IN INDIA BASED ON THEORY OF PLANNED BEHAVIOUR MODELG N SATISH KUMAR & T. V. JANAKI
86
16
.
RETENTION STRATEGY: THE MAJOR TRENDS THAT CARRIED OUT IN IT SECTORDR. S. CHITRA DEVI & E. LATHA
90
17
.
HUMAN RESOURCE DEVELOPMENT PRACTICES IN INFORMATION TECHNOLOGY INDUSTRY IN INDIADR. DEEPAKSHI GUPTA & DR. NEENA MALHOTRA
95
18
.
ORGANISATIONAL SUPPORT FOR EMPLOYEES’ CAREER MANAGEMENTA. SEEMA, DR. ANITA PRIYA RAJA & DR. S. SUJATHA
109
19
.
A STUDY ON SMALL INVESTOR’S PREFERENCE TOWARDS MUTUAL FUNDS IN SALEM DISTRICT, TAMIL NADUM. GURUSAMY
113
20
.
A STUDY ON ATTRITION IN DOMESTIC FORMULATIONS IN CHENNAI CHEMICALS AND PHARMACEUTICALS LTD.C M MARAN
123
21
.
A STATISTICAL ANALYSIS OF DAILY NIFTY RETURNS, DURING 2001-11SANTANU DUTTA
133
22
.
HEALTH AND SOCIAL PROBLEMS OF INDIAN WOMEN - A STUDYDR. A. S. SHIRALASHETTI
137
23
.
ANTECEDENTS OF CRM IN HIGHER EDUCATIONDR. NARINDER TANWAR
139
24
.
HUMAN CAPITAL MANAGEMENT ISSUES AND POSSIBILITIES OF MSMES - A STUDY ON SELECT UNITS IN BANGALORELAKSHMYPRIYA K. & SUPARNA DAS PURKAYASTHA
142
25
.
GENERATING FUNCTIONS FOR PELL AND PELL-LUCAS NUMBERSDR. NARESH PATEL
152
CHIEF PATRON
CHIEF PATRON
CHIEF PATRON
CHIEF PATRON
PROF. K. K. AGGARWAL
Chancellor, Lingaya’s University, Delhi
Founder Vice-Chancellor, Guru Gobind Singh Indraprastha University, Delhi
Ex. Pro Vice-Chancellor, Guru Jambheshwar University, Hisar
PATRON
PATRON
PATRON
PATRON
SH. RAM BHAJAN AGGARWAL
Ex. State Minister for Home & Tourism, Government of Haryana
Vice-President, Dadri Education Society, Charkhi Dadri
President, Chinar Syntex Ltd. (Textile Mills), Bhiwani
CO
CO
CO
CO----ORDINATOR
ORDINATOR
ORDINATOR
ORDINATOR
AMITA
Faculty, E.C.C., Safidon, Jind
ADVISORS
ADVISORS
ADVISORS
ADVISORS
PROF. M. S. SENAM RAJU
Director A. C. D., School of Management Studies, I.G.N.O.U., New Delhi
PROF. M. N. SHARMA
Chairman, M.B.A., Haryana College of Technology & Management, Kaithal
PROF. S. L. MAHANDRU
Principal (Retd.), Maharaja Agrasen College, Jagadhri
EDITOR
EDITOR
EDITOR
EDITOR
PROF. R. K. SHARMA
Dean (Academics), Tecnia Institute of Advanced Studies, Delhi
CO
CO
CO
CO----EDITOR
EDITOR
EDITOR
EDITOR
DR. BHAVET
Faculty, M. M. Institute of Management, Maharishi Markandeshwar University, Mullana, Ambala, Haryana
EDITORIAL ADVISORY BOARD
EDITORIAL ADVISORY BOARD
EDITORIAL ADVISORY BOARD
EDITORIAL ADVISORY BOARD
DR. AMBIKA ZUTSHI
Faculty, School of Management & Marketing, Deakin University, Australia
DR. VIVEK NATRAJAN
Faculty, Lomar University, U.S.A.
DR. RAJESH MODI
Faculty, Yanbu Industrial College, Kingdom of Saudi Arabia
PROF. SANJIV MITTAL
University School of Management Studies, Guru Gobind Singh I. P. University, Delhi
PROF. ANIL K. SAINI
Chairperson (CRC), Guru Gobind Singh I. P. University, Delhi
DR. KULBHUSHAN CHANDEL
Reader, Himachal Pradesh University, Shimla
DR. TEJINDER SHARMA
INTERNATIONAL JOURNAL OF RESEARCH IN COMMERCE, IT & MANAGEMENT
DR. SAMBHAVNA
Faculty, I.I.T.M., Delhi
DR. MOHENDER KUMAR GUPTA
Associate Professor, P. J. L. N. Government College, Faridabad
DR. SHIVAKUMAR DEENE
Asst. Professor, Government F. G. College Chitguppa, Bidar, Karnataka
MOHITA
Faculty, Yamuna Institute of Engineering & Technology, Village Gadholi, P. O. Gadhola, Yamunanagar
ASSOCIATE EDITORS
ASSOCIATE EDITORS
ASSOCIATE EDITORS
ASSOCIATE EDITORS
PROF. NAWAB ALI KHAN
Department of Commerce, Aligarh Muslim University, Aligarh, U.P.
PROF. ABHAY BANSAL
Head, Department of Information Technology, Amity School of Engineering & Technology, Amity University, Noida
PROF. A. SURYANARAYANA
Department of Business Management, Osmania University, Hyderabad
DR. ASHOK KUMAR
Head, Department of Electronics, D. A. V. College (Lahore), Ambala City
DR. JATINDERKUMAR R. SAINI
Head, Department of Computer Science, S. P. College of Engineering, Visnagar, Mehsana, Gujrat
DR. V. SELVAM
Divisional Leader – Commerce SSL, VIT University, Vellore
DR. PARDEEP AHLAWAT
Reader, Institute of Management Studies & Research, Maharshi Dayanand University, Rohtak
S. TABASSUM SULTANA
Asst. Professor, Department of Business Management, Matrusri Institute of P.G. Studies, Hyderabad
TECHNICAL ADVISOR
TECHNICAL ADVISOR
TECHNICAL ADVISOR
TECHNICAL ADVISOR
AMITA
Faculty, E.C.C., Safidon, Jind
MOHITA
Faculty, Yamuna Institute of Engineering & Technology, Village Gadholi, P. O. Gadhola, Yamunanagar
FINANCIAL ADVISORS
FINANCIAL ADVISORS
FINANCIAL ADVISORS
FINANCIAL ADVISORS
DICKIN GOYAL
Advocate & Tax Adviser, Panchkula
NEENA
Investment Consultant, Chambaghat, Solan, Himachal Pradesh
LEGAL ADVISORS
LEGAL ADVISORS
LEGAL ADVISORS
LEGAL ADVISORS
JITENDER S. CHAHAL
Advocate, Punjab & Haryana High Court, Chandigarh U.T.
CHANDER BHUSHAN SHARMA
Advocate & Consultant, District Courts, Yamunanagar at Jagadhri
SUPERINTENDENT
SUPERINTENDENT
SUPERINTENDENT
SUPERINTENDENT
CALL FOR MANUSCRIPTS
CALL FOR MANUSCRIPTS
CALL FOR MANUSCRIPTS
CALL FOR MANUSCRIPTS
We
invite unpublished novel, original, empirical and high quality research work pertaining to recent developments & practices in
the area of Computer, Business, Finance, Marketing, Human Resource Management, General Management, Banking, Insurance,
Corporate Governance and emerging paradigms in allied subjects like Accounting Education; Accounting Information Systems;
Accounting Theory & Practice; Auditing; Behavioral Accounting; Behavioral Economics; Corporate Finance; Cost Accounting;
Econometrics; Economic Development; Economic History; Financial Institutions & Markets; Financial Services; Fiscal Policy;
Government & Non Profit Accounting; Industrial Organization; International Economics & Trade; International Finance; Macro
Economics; Micro Economics; Monetary Policy; Portfolio & Security Analysis; Public Policy Economics; Real Estate; Regional
Economics; Tax Accounting; Advertising & Promotion Management; Business Education; Business Information Systems (MIS);
Business Law, Public Responsibility & Ethics; Communication; Direct Marketing; E-Commerce; Global Business; Health Care
Administration; Labor Relations & Human Resource Management; Marketing Research; Marketing Theory & Applications;
Non-Profit Organizations; Office Administration/Management; Operations Research/Statistics; Organizational Behavior & Theory;
Organizational Development; Production/Operations; Public Administration; Purchasing/Materials Management; Retailing;
Sales/Selling; Services; Small Business Entrepreneurship; Strategic Management Policy; Technology/Innovation; Tourism,
Hospitality & Leisure; Transportation/Physical Distribution; Algorithms; Artificial Intelligence; Compilers & Translation; Computer
Aided Design (CAD); Computer Aided Manufacturing; Computer Graphics; Computer Organization & Architecture; Database
Structures & Systems; Digital Logic; Discrete Structures; Internet; Management Information Systems; Modeling & Simulation;
Multimedia; Neural Systems/Neural Networks; Numerical Analysis/Scientific Computing; Object Oriented Programming;
Operating Systems; Programming Languages; Robotics; Symbolic & Formal Logic; Web Design. The above mentioned tracks are
only indicative, and not exhaustive.
Anybody can submit the soft copy of his/her manuscript
anytime
in M.S. Word format after preparing the same as per our
submission guidelines duly available on our website under the heading guidelines for submission, at the email addresses,
[email protected]
or
.
GUIDELINES FOR SUBMISSION OF MANUSCRIPT
GUIDELINES FOR SUBMISSION OF MANUSCRIPT
GUIDELINES FOR SUBMISSION OF MANUSCRIPT
GUIDELINES FOR SUBMISSION OF MANUSCRIPT
1. COVERING LETTER FOR SUBMISSION:
DATED: _____________
THE EDITOR
IJRCM
Subject:
SUBMISSION OF MANUSCRIPT IN THE AREA OF .
(e.g. Computer/IT/Finance/Marketing/HRM/General Management/other, please specify)
.
DEAR SIR/MADAM
Please find my submission of manuscript titled ‘___________________________________________’ for possible publication in your journal.
I hereby affirm that the contents of this manuscript are original. Furthermore it has neither been published elsewhere in any language fully or partly, nor is it under review for publication anywhere.
I affirm that all author (s) have seen and agreed to the submitted version of the manuscript and their inclusion of name (s) as co-author (s).
Also, if our/my manuscript is accepted, I/We agree to comply with the formalities as given on the website of journal & you are free to publish our contribution to any of your journals.
NAME OF CORRESPONDING AUTHOR: Designation:
INTERNATIONAL JOURNAL OF RESEARCH IN COMMERCE, IT & MANAGEMENT
Residential address with Pin Code:
Mobile Number (s):
Landline Number (s):
E-mail Address:
Alternate E-mail Address:
2. INTRODUCTION: Manuscript must be in British English prepared on a standard A4 size paper setting. It must be prepared on a single space and single column with 1” margin set for top, bottom, left and right. It should be typed in 8 point Calibri Font with page numbers at the bottom and centre of the every page.
3. MANUSCRIPT TITLE: The title of the paper should be in a 12 point Calibri Font. It should be bold typed, centered and fully capitalised.
4. AUTHOR NAME(S) & AFFILIATIONS: The author (s) full name, designation, affiliation (s), address, mobile/landline numbers, and email/alternate email address should be in italic & 11-point Calibri Font. It must be centered underneath the title.
5. ABSTRACT: Abstract should be in fully italicized text, not exceeding 250 words. The abstract must be informative and explain the background, aims, methods, results & conclusion in a single para.
6. KEYWORDS: Abstract must be followed by list of keywords, subject to the maximum of five. These should be arranged in alphabetic order separated by commas and full stops at the end.
7. HEADINGS: All the headings should be in a 10 point Calibri Font. These must be bold-faced, aligned left and fully capitalised. Leave a blank line before each heading.
8. SUB-HEADINGS: All the sub-headings should be in a 8 point Calibri Font. These must be bold-faced, aligned left and fully capitalised. 9. MAIN TEXT: The main text should be in a 8 point Calibri Font, single spaced and justified.
10. FIGURES &TABLES: These should be simple, centered, separately numbered & self explained, and titles must be above the tables/figures. Sources of data should be mentioned below the table/figure. It should be ensured that the tables/figures are referred to from the main text.
11. EQUATIONS: These should be consecutively numbered in parentheses, horizontally centered with equation number placed at the right.
12. REFERENCES: The list of all references should be alphabetically arranged. It must be single spaced, and at the end of the manuscript. The author (s)
should mention only the actually utilised references in the preparation of manuscript and they are supposed to follow Harvard Style of Referencing.
The author (s) are supposed to follow the references as per following:
•
All works cited in the text (including sources for tables and figures) should be listed alphabetically.•
Use (ed.) for one editor, and (ed.s) for multiple editors.•
When listing two or more works by one author, use --- (20xx), such as after Kohl (1997), use --- (2001), etc, in chronologically ascending order.•
Indicate (opening and closing) page numbers for articles in journals and for chapters in books.•
The title of books and journals should be in italics. Double quotation marks are used for titles of journal articles, book chapters, dissertations, reports,working papers, unpublished material, etc.
•
For titles in a language other than English, provide an English translation in parentheses.•
The location of endnotes within the text should be indicated by superscript numbers.PLEASE USE THE FOLLOWING FOR STYLE AND PUNCTUATION IN REFERENCES: BOOKS
•
Bowersox, Donald J., Closs, David J., (1996), "Logistical Management." Tata McGraw, Hill, New Delhi.•
Hunker, H.L. and A.J. Wright (1963), "Factors of Industrial Location in Ohio," Ohio State University.CONTRIBUTIONS TO BOOKS
•
Sharma T., Kwatra, G. (2008) Effectiveness of Social Advertising: A Study of Selected Campaigns, Corporate Social Responsibility, Edited by DavidCrowther & Nicholas Capaldi, Ashgate Research Companion to Corporate Social Responsibility, Chapter 15, pp 287-303.
JOURNAL AND OTHER ARTICLES
•
Schemenner, R.W., Huber, J.C. and Cook, R.L. (1987), "Geographic Differences and the Location of New Manufacturing Facilities," Journal of UrbanEconomics, Vol. 21, No. 1, pp. 83-104.
CONFERENCE PAPERS
•
Garg Sambhav (2011): "Business Ethics" Paper presented at the Annual International Conference for the All India Management Association, NewDelhi, India, 19–22 June.
UNPUBLISHED DISSERTATIONS AND THESES
•
Kumar S. (2011): "Customer Value: A Comparative Study of Rural and Urban Customers," Thesis, Kurukshetra University, Kurukshetra.ONLINE RESOURCES
•
Always indicate the date that the source was accessed, as online resources are frequently updated or removed.WEBSITE
A STUDY ON THE PERFORMANCE OF INVENTORY MANAGEMENT IN APSRTC
DR. K. SAI KUMAR
PROFESSOR & HEAD
DEPARTMENT OF MANAGEMENT
NARAYANA ENGINEERING COLLEGE
NELLORE
ABSTRACT
The economic development of any country largely depends on the transport activity. Among the various modes of transport available, the road based transport is widely accepted, because of its peculiar advantages. In India, the public transport undertakings are facing heavy competition from private ownership and operating in an environment of privatization. One among the various reasons for getting losses in transport undertakings is the absence of proper inventory management. The present work is a study on the practices of inventory management of APSRTC. The effectiveness of inventory management policies is measured in terms of inventory holdings per vehicle, inventory holdings per lakh effective kilometers, inventory in terms of number of month’s consumption, level of inventory in relation to various assets, and the level of inventory in terms of per day operating income. The data have been analyzed using various statistical tools and compared with the profits and losses of the corporation. The results indicate that the inventory management practices of the corporation were good and have not shown any impact on the losses of the corporation.
KEYWORDS
Inventory, Inventory Management, Privatization, Transport Undertaking.
INTRODUCTION
nfrastructural facilities, viz., power, transport and communication network etc., are essential inputs for any country’s economic development. Out of these inputs, transport facility is one of the key factors required for economic development because there is hardly any activity which is not influenced by transport service. It is a fact that socio economic activities and transportation system are closely related. Road transport system assumes a significant position in the overall development of any country. Road and road transport are the important constituents of any transport system. A well developed, cheap and efficient network of transport system leads to speedy movement of human beings, materials and resources more effectively from their places of abundance to the places of inherent demand. It creates a feeling of ourselves among the people with a spirit of progress thereby able to overcome their apathy and isolation. Since people need to travel, goods have to be moved from place to place, so transportation acts as catalyst and forms the back bone of the economic growth.
Transport has long been recognized as an engine of growth for the long term development of any country. In a predominantly economy with a vast and growing populace spread over an extensive mass of land, notwithstanding the vagaries of development in other sectors, the transport sector in India, ironically has received scant attention over the past few decades of the planning era. The road based transport is the popular mode of transport because of its peculiar advantages such as flexibility, capital requirements, capacity, infrastructure, accessibility and adoptability, in addition to route, direction, time and speed etc. Public transport plays a vital role in providing services to the rural areas. It helps in connecting the rural population living in remote areas with the main stream of socio economic activities. It is considered to be a vital infrastructure and a predominant mode of transport in moving short and medium distance passenger traffic in the country.
At the time of independence the road transport services were entirely in the hands of private operators, and the transport sector was completely fragmented and totally unorganized. There were several private operators competing among themselves and the quality of services rendered to the traveling public was also substandard. They try to snatch each other’s piece of traffic share. In this cut throat competition for survival, each one gets so little with which one cannot live long.
The main objective of the private operators was to make profits without any social concern. As a result, people at large were deprived of adequate transport services and there was large scale exploitation of labour in this sector.
Realizing the evils of uncoordinated and uncontrolled passenger road transport, Government of India enacted the ‘’Road Transport Corporations Act-1950’’ enabling the states to establish corporations and to progressively nationalize the bus transportation in the country. The objectives as laid down by the RTC act are ‘’to provide an efficient, adequate, economic and properly coordinated transport services and to run on business principle’’. Consequently with the enhancement of this act, several states have established road transport corporations for running their services. After the introduction of 1950’s Road Transport Corporations Act, the process of bus transport nationalization started in the country and a well organized bus transport system was developed to serve the traveling public.
After more than 5 decades of nationalization of passenger road transport and consequent formation State Transport Undertakings (STUs), the passenger transport industry is suffering from losses and not in a position to offer various services to travelling public. As a result dissatisfied public transport passengers are increasingly turning towards private mode of transport. One among the various reasons for mounting losses to the transport undertakings may be due to the absence of proper inventory management policies. Because, inventory management plays an important role in deciding the profitability of any service organization, an attempt has been made in the present study, to know whether the losses of the corporation were due to inefficiency of inventory management are not.
SIGNLFICANCE OF THE STUDY
The importance of Inventory management lies in the fact that any significant contribution made by the materials manager in reducing materials cost go a long way in improving the profitability of the organization. Inventory management aims in providing the desired degree of service to the organization at minimum cost. This function include, effective maintenance of stores, timely availability of material, avoiding un necessary buildup of inventories, development of polices, plans and standards to achieve inventory control objectives, maintenance of overall control by checking results and adopting corrective actions etc. To achieve the overall benefits of the organization, a sound Inventory management activity must be given due importance.
One of the important objectives of the public transport undertakings is to provide efficient transport facility to the traveling public. To achieve this objective, continuous updating and monitoring of Inventory management policies are essential to keep pace with the change in time, to avoid any dissatisfaction of the passengers as well as lowering the losses of the corporation. To study the Inventory management practices of the corporation, various measures which are directly related to working of the corporation have been considered. These measures include inventory holdings per vehicle, inventory holdings per lakh effective kilometers, inventory in terms of number of month’s consumption, level of inventory in relation to various assets, and the level of inventory in terms of per day operating income etc. The analysis used in the present study will help the authorities of transport undertakings, to concentrate and to develop more appropriate strategies on the areas where Inventory management is poor, and on the basis of which a well designed set of action can be taken for better performance of the transport undertakings.
INTERNATIONAL JOURNAL OF RESEARCH IN COMMERCE, IT & MANAGEMENT
OBJECTIVES OF THE STUDY
As the corporation was getting losses continuously in the past few years, a study has been undertaken to know whether the losses of the corporation were due to inefficient practices of the Inventory management or not. As against this back ground, the following objectives have been formulated
1. To know the Inventory management practices in APSRTC, in terms of inventory holdings per vehicle, inventory holdings per lakh effective kilometers and Inventory in terms of number of month’s consumption
2. To know the Inventory management practices in APSRTC, in terms of level of inventory in relation to various assets, and the level of inventory in terms of per day operating income
METHODOLOGY
SAMPLING UNIT
The transport undertakings, varying from state to state taking one of the four forms, as Public corporations, Departmental undertakings, Municipal undertakings or Government companies. At present there are 53 State Road Transport Undertakings. Out of these transport undertakings, the Andhra Pradesh State Road Transport Corporation (APSRTC) is the first nationalized transport undertaking in the country. It is one of the biggest public sector undertakings run by the state government and also formed as the largest single bus company in the world.
PERIOD OF THE STUDY
The data covers for a period of 12 years ranging from 1992-93 to 2003-04. A twelve years period has been selected to analyze the information more meaningfully and focus attention on the quality of services offered by the corporation. Further this 12 years period is considered suitable to study the problems, trends on the service related factors which forms a sound basis for analysis. This Period covers significant changes in management policies, programmes of the APSRTC. During this period there were many problems with APSRTC such as union strikes, fire of buses due to various political agitations, and unrest of employees due to rising of voice by public and government for privatization of APSRTC.
SOURCES OF DATA
The study is based on secondary sources of data. The secondary data collected from various sources such as annual administration reports of the corporation, the records of the Management Information System (MIS) wing of APSRTC, inventory control and stores records of the corporation and different manuals prepared by the corporation from time to time.
DATA ANALYSIS
The data have been collected systematically, sorted, classified, and arranged in tabular forms which are amenable for analysis. The statistical package for social sciences (SPSS16.0) has been used. The various suitable statistical techniques like Arithmetic Mean (AM), Standard Deviation (SD), Coefficient of Correlation (CV), Linear Growth Rate (LGR), Compound Growth Rate (CGR), Coefficient of Correlation(r), and Students t- test of significance of growth rate have been applied to analyze the empirical data.
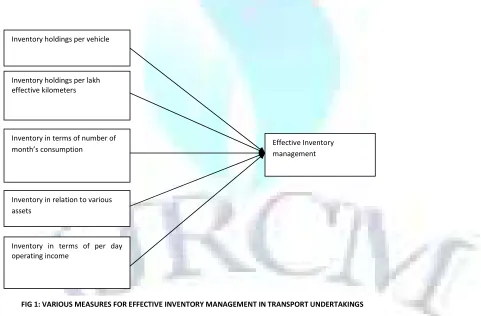
CONCEPTUAL FRAME WORK OF VARIOUS MEASSURES FOR EFFECTIVE INVENTORY MANAGEMENT IN TRANSPORT UNDERTAKINGS
A theoretical frame work for the effective management of Inventories in transport undertakings has been developed based on the objectives of the study. The model is developed in consistence with the various measures that represent effective management of Inventories. The development of this model will provide a sound base to the transport authorities and will helps them in further examination as to what extent various policies can be formulated and upgraded for effective management of inventories.
ANALYSIS AND DISCUSSION
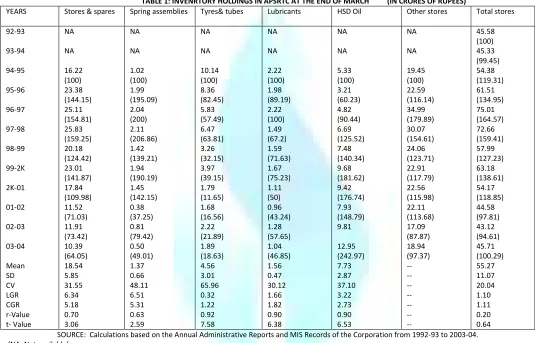
INVENTORY HOLDINGS IN APSRTC
Table 1, represents the position of inventory holdings in APSRTC during the period between March1993 and March 2004. It is clear from the table that the inventory of all the individual items of materials such as stores & spares, spring assemblies, tyres & tubes, lubricants, have shown continuous down trend except,
Inventory holdings per vehicle
Inventory holdings per lakh effective kilometers
Inventory in relation to various assets
Inventory in terms of number of month’s consumption
Inventory in terms of per day operating income
Effective Inventory management
the HSD oil. It is also clear from the table that the growth of the total stores inventory was continuous from Rs. 45.58 crores to Rs. 75.01 crores during the period between March 1993 and March 1997. From March 1998 onwards the inventory in the total stores was continuously reduced and reached to Rs. 43.12 crores in March 2003 except in the year 1999-2000. But at the end of the year i.e. in 2003-04 the inventory level sharply increased to Rs. 45.71 crores. It is also clear that the percentage decrease in the inventory holdings of individual items of stores were stores and spares (36%) followed by springs (51%), tyres & tubes (81%), lubricants (53%), respectively. The percentage increase in the inventory holdings of HSD oil alone was 143 percent, further HSD oil alone accounted for more than 28 percent of the total stores inventory at the end of the study period followed by stores & spares with inventory more than 22 percent.
It is observed that there is a significant decreasing growth of 6.34 percent and 6.51 percent in stores & spares and springs inventory during the period between 1994-95 and 2003-04. The corresponding t - values are given by 3.06 and 2.59 respectively, which are significant at 5 percent level. There is a significant decreasing growth of 1.66 percent and 0.32 percent in lubricants and tyres & tubes inventory. The corresponding t - values are given by 6.38 and 7.58 respectively, which are highly significant at 1 percent level, while there is a significant increasing growth of 3.22 percent in HSD oil inventory and its corresponding t - value is given by 6.53, which is highly significant at 1 percent level. But it is found that there is an insignificant decreasing growth of 1.10 percent in the total stores inventory during the period between 1994-95 and 2003-04.
TABLE 1: INVENRTORY HOLDINGS IN APSRTC AT THE END OF MARCH (IN CRORES OF RUPEES)
YEARS Stores & spares Spring assemblies Tyres& tubes Lubricants HSD Oil Other stores Total stores
92-93 93-94 94-95 95-96 96-97 97-98 98-99 99-2K 2K-01 01-02 02-03 03-04 Mean SD CV LGR CGR r-Value t- Value NA NA 16.22 (100) 23.38 (144.15) 25.11 (154.81) 25.83 (159.25) 20.18 (124.42) 23.01 (141.87) 17.84 (109.98) 11.52 (71.03) 11.91 (73.42) 10.39 (64.05) 18.54 5.85 31.55 6.34 5.18 0.70 3.06 NA NA 1.02 (100) 1.99 (195.09) 2.04 (200) 2.11 (206.86) 1.42 (139.21) 1.94 (190.19) 1.45 (142.15) 0.38 (37.25) 0.81 (79.42) 0.50 (49.01) 1.37 0.66 48.11 6.51 5.31 0.63 2.59 NA NA 10.14 (100) 8.36 (82.45) 5.83 (57.49) 6.47 (63.81) 3.26 (32.15) 3.97 (39.15) 1.79 (11.65) 1.68 (16.56) 2.22 (21.89) 1.89 (18.63) 4.56 3.01 65.96 0.32 1.22 0.92 7.58 NA NA 2.22 (100) 1.98 (89.19) 2.22 (100) 1.49 (67.2) 1.59 (71.63) 1.67 (75.23) 1.11 (50) 0.96 (43.24) 1.28 (57.65) 1.04 (46.85) 1.56 0.47 30.12 1.66 1.82 0.90 6.38 NA NA 5.33 (100) 3.21 (60.23) 4.82 (90.44) 6.69 (125.52) 7.48 (140.34) 9.68 (181.62) 9.42 (176.74) 7.93 (148.79) 9.81 12.95 (242.97) 7.73 2.87 37.10 3.22 2.73 0.90 6.53 NA NA 19.45 (100) 22.59 (116.14) 34.99 (179.89) 30.07 (154.61) 24.06 (123.71) 22.91 (117.79) 22.56 (115.98) 22.11 (113.68) 17.09 (87.87) 18.94 (97.37) -- -- -- -- -- -- -- 45.58 (100) 45.33 (99.45) 54.38 (119.31) 61.51 (134.95) 75.01 (164.57) 72.66 (159.41) 57.99 (127.23) 63.18 (138.61) 54.17 (118.85) 44.58 (97.81) 43.12 (94.61) 45.71 (100.29) 55.27 11.07 20.04 1.10 1.11 0.20 0.64 SOURCE: Calculations based on the Annual Administrative Reports and MIS Records of the Corporation from 1992-93 to 2003-04. (NA: Not available)
The table 2, shows the number of vehicles in operation during the period from 1992-93 to 2003-04. It is observed from the table that in the base year of the study, the number of vehicles in operation was 14702 and it is gradually increased to 19013 in the terminal year of the study, registering an increase of 29 percent. It is observed that there is significant increasing growth of 2.70 percent in the number of vehicles in operation during the period understudy. The corresponding t - value is given by 9.98, which is highly significant at 1 percent level.
TABLE 2: NUMBER OF VEHICLES IN OPERATION (1992-93 TO 2003-04)
SOURCE: Annual Administrative Reports of APSRTC from 1992-93 to 2003-04. (Calculations based on the figures available in the annual administrative reports)
YEAR NUMBER OF VEHICLES IN OPERATION 1992-93 1993-94 1994-95 1995-96 1996-97 1997-98 1998-99 1999-2K 2000-01 2001-02 2002-03 2003-04 Mean SD CV LGR CGR r-Value t- Value
INTERNATIONAL JOURNAL OF RESEARCH IN COMMERCE, IT & MANAGEMENT
Thus, it is clear from the analysis that the number of vehicles in operation was increased by 29 percent In spite of increase in the number of vehicles in operation; the increase in the total stores inventory is absolutely zero. Though the inventory of total stores had increased during the first half of the study period, for the second half of the study period the total stores inventory was reduced.
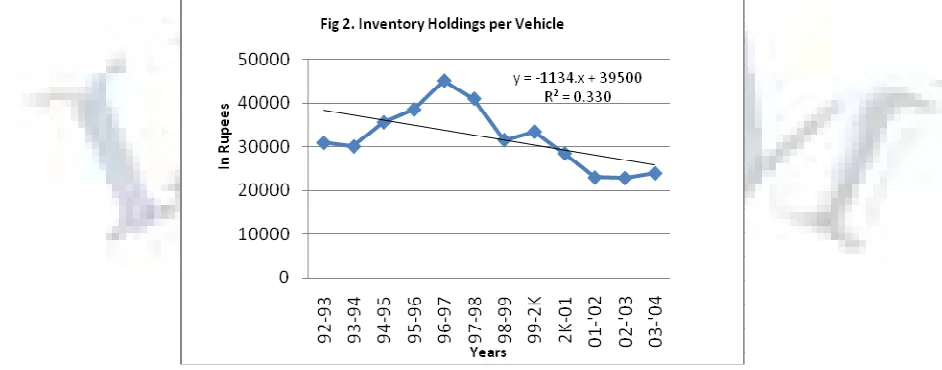
INVENTORY HOLDINGS PER VEHICLE
The inventory holdings per vehicle in APSRTC during the period form 1992-93 to 2003-04 are presented in table 3,(Fig 2). It may be observed from the table that the inventory holdings per vehicle were increased from Rs.31002 to Rs.45178 between March1993 and March 1997. From March 1998 onwards the inventory holdings were reduced continuously up to March, 2003 except in the year March, 2000. However, it is again increased from Rs.22962 to Rs.24044 in the terminal year of the study. The inventory holdings per vehicle were reduced by 22 percent during the study period, but it was increased by nearly 4 percent in the last year in comparison with 2002-2003. It is observed that there is a significant decreasing growth of 5.43 percent, 0.06 percent, and 0.95 percent in stores & spares, tyres & tubes and lubricants inventory per vehicle during the period between 1994-95 and 2003-04. The corresponding t - values are given by 4.52, 7.16, and 7.20 respectively, which are highly significant at 1 percent level. There is a significant decreasing growth of 6.11 percent in spring inventory per vehicle. The corresponding t- value is given by 3.34, which is significant at 5 percent level. Further, it is observed that there is a significant increasing growth of 4.07 percent in HSD oil inventory per vehicle. Its corresponding t- value is given by 5.12, which is highly significant at 1 percent level, while there is an insignificant decreasing growth of 3.53 percent in total stores inventory per vehicle.
TABLE 3: INVENRTORY HOLDINGS PER VEHICLE IN APSRTC AT THE END OF MARCH (IN RUPEES)
SOURCE: Calculations based on the Annual Administrative Reports and MIS Records of the Corporation from 1992-93 to 2003-04. (NA: Not available)
Thus, it is clear that the inventory holdings of all the items were reduced during the period understudy except HSD oil. The highest decrease in the individual items of stores was tyres & tubes (85 percent) followed by lubricants (62 %) springs (61%) and stores and spares (49%) respectively. The general assumption is that, the increase in the number of buses in operation will automatically increase the level of inventory holdings. Hence, an analysis of the trends in the
YEARS Stores & spares Spring assemblies Tyres& tubes Lubricants HSD Oil Other stores Total stores
inventory is done along with the trends in the number of vehicles to know whether the increase in the number of buses (Table 2) in operation has influenced the inventory holdings per vehicle.
It is clear from the table that the total inventory holdings per vehicle was reduced by 22 percent while the number of buses in operation was increased by 29 percent during the same period. Thus, it is evident that there is a negative change and it indicates the effective utilization of inventory holdings per vehicle of the corporation. The analysis of annual rate of change both in the inventory as well as in number of vehicles in operation indicates that there has been an increase in both of them up to 1996-97, but the increase in the number of buses in operation was much more consistent as compared to the increase in the inventory. Further, the growth in the inventory has shown a significant decline from 1997-98 onwards as against the corresponding increase in the number of buses. Hence, it is assumed that the increase in the number of buses has not influenced the level of inventory during the periods understudy. The analysis about the inventory holdings per vehicle indicates that what amount of inventory holdings is being maintained by the corporation to operate a bus per year. If inventory per vehicle shows a declining trend, it assumes economic utilization of inventory by avoiding the unnecessary accumulation of the materials. On the other hand, an increase in the inventory holdings per vehicle indicates, large amount of accumulation of inventory per vehicle and uneconomic utilization of materials as well as unnecessary accumulation of inventory. Since the inventory holdings per vehicle has been showing the downtrend over the periods understudy. It can be concluded that the corporation is having tight control on its inventories and it indicates the efficiency of the management in maintaining the materials.
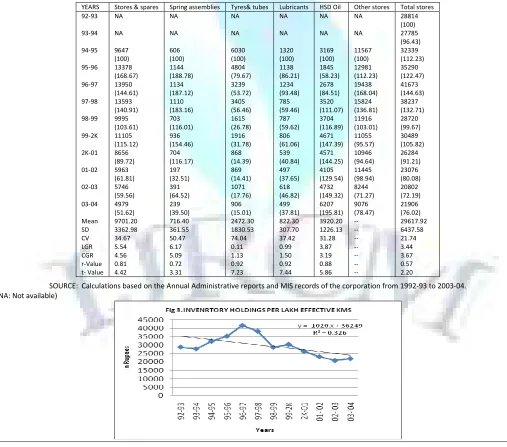
INVENTORY HOLDINGS PER LAKH EFFECTIVE KILOMETERS
The inventory holdings per lakh effective kilometers are shown in the Table 4(Fig 3). As per the table, it is interesting to note that the total inventory per lakh kilometers show an erratic trend. It was increased from Rs.28814 to Rs. 41673 during the period between 1992-93 and 1996-97, except in the year 1993-94. From 1997-98 onwards it was reduced to Rs. 20802 in 2002-03 and again increased to Rs. 21906 in 2003-04, which is an increase of Rs. 1105 when compared with the previous year i.e. 2002-03. It is observed that there is an insignificant decreasing growth of 3.44 percent in total stores inventory per kilometer during the period understudy.
It is also noted that during the study period the inventory holdings of the individual items per lakh effective kilometers for stores & spares, springs, tyres & tubes, lubricants have reduced considerably except the HSD oil. The inventory holdings per lakh effective kilometers of HSD oil was increased from Rs.3169 in the base year to Rs.6207 in the terminal year of the study, registering an increase of 96 percent. The highest decrease in the individual items of stores was tyres & tubes (85%) followed by lubricants (62%), spring (60%) and stores & spares (48%). It is found that there is a significant decreasing growth of 5.54 percent, 0.11 percent, and 0.99 percent in stores & spares, tyres & tubes, and lubricants inventory per kilometer during the period between 1994-95 and 2003-04. The corresponding t – values are given by 4.42, 7.23 and 7.44 respectively, which are highly significant at 1 percent level. Further, there is a significant decreasing growth of 6.17 percent in springs inventory per kilometer and its corresponding t – value is given by 3.31, which is significant at 5 percent level, while it is found that there is a significant increasing growth of 3.87 percent in HSD oil inventory per kilometer. The corresponding t – value is given by 5.86, which is highly significant at 1 percent level.
TABLE 4: INVENRTORY HOLDINGS PER LAKH EFFECTIVE KMS IN APSRTC AT THE END OF MARCH (IN RUPEES)
SOURCE: Calculations based on the Annual Administrative reports and MIS records of the corporation from 1992-93 to 2003-04. (NA: Not available)
INTERNATIONAL JOURNAL OF RESEARCH IN COMMERCE, IT & MANAGEMENT
The Table 5, shows the average values of the inventory holdings per vehicle and per lakh effective kilometers. It is clear from the table that the decrease in the total inventory held per vehicle in money units and the total inventory held per lakh effective kilometers as shown in the respective tables during the period understudy shows the efficiency of the management in managing the inventories which is an encouraging situation. Further, the inventory levels and the consumption rates of materials in APSRTC can be better understood by an analysis of inventory held in terms of number of month’s consumption.
TABLE 5: AVERAGE INVENTORY HOLDINGS OF MATERIALS
SOURCE: Estimates based on the Annual Administrative Reports of the Corporation from 1992-93 to 2003-04
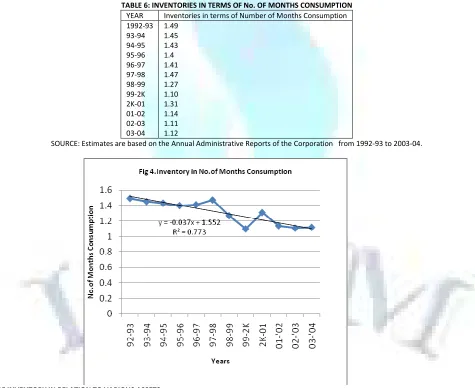
INVENTORY IN TERMS OF NUMBER OF MONTHS CONSUMPTION
The amount of inventory held in terms of number of month’s consumption and the amount of capital blocked on the inventory are the indicators to measure the performance of inventory management of the corporation. The inventory in terms of number of month’s consumption in APSRTC is shown in table 6(Fig 4). The figures indicate the amount of material stocked in terms of monthly consumption. As the value increases towards higher levels, there is an indication of larger amounts of stock in relation to the rate of consumption consequently block up of larger amount of capital. As the value decreases towards lower levels, there is an indication of lesser inventories, hence lesser amount of capital blocked up. As per the table, it is clear that the total stores inventory in APSRTC is reduced form 1.49 months in the year 1992-93 to 1.12 months in the year 2003-04. The inventory holdings in terms of monthly consumption are highest in the year 1992-93 and lowest in the year 1999-2000. The reduction in the inventory in terms of number of month’s consumption is a good sign and is the most desirable situation.
TABLE 6: INVENTORIES IN TERMS OF No. OF MONTHS CONSUMPTION
YEAR Inventories in terms of Number of Months Consumption
1992-93 93-94 94-95 95-96 96-97 97-98 98-99 99-2K 2K-01 01-02 02-03 03-04
1.49 1.45 1.43 1.4 1.41 1.47 1.27 1.10 1.31 1.14 1.11 1.12
SOURCE: Estimates are based on the Annual Administrative Reports of the Corporation from 1992-93 to 2003-04.
LEVEL OF INVENTORY IN RELATION TO VARIOUS ASSETS
The table 7 shows the share of inventory in APSRTC in relation to current assets, and total assets. The figures in the table are estimated using the ratios of inventory as percentage of current assets and total assets. It is clear from the table that the inventory as a percentage of current assets was ranging between a minimum of 19.52 and a maximum of 29.48 percent during the period understudy. This indicates that for every Rs.100 of investment on current assets, the inventory is accounted for a minimum of Rs19.52 and a maximum of Rs.29.48. It is also evident that this ratio is increasing continuously from the base year of the study up to 1996-97 and then shows an erratic trend between 1997-98 and 2003-04. Since, inventory being the least liquid component of the current assets, lower ratio indicates more liquidity of the corporation and higher ratio indicates the less liquidity of the corporation. The inventory as a ratio of total assets
Particulars Average inventory holdings (in crores of
rupees)
Average inventory holdings per vehicle ( in rupees)
Average inventory holdings per lakh kilometers (in rupees)
Stores & spares Springs Tyres & tubes Lubricants HSD Oil Other stores Total stores
18.54
1.37 4.56 1.56 7.73 23.48 57.23
10537
780 2693 894 4246 13260 32410
9701
indicates the relative proportion of inventory in total assets. The average share of inventory in total assets was approximately 3.45 percent. It was lowest at 2.05 in 2002-03 and highest at 4.82 in 1996-97. It is to be noted that the ratio is showing a downtrend in the later part of the study period. It indicates that a larger amount of investment was made on the fixed assets such as purchase of new buses, construction of buildings for depots and bus stations etc., which are an encouraging situations and a good sign of managing the inventories.
TABLE 7: LEVEL OF INVENTORY IN RELATION TO VARIOUS ASSETS
SOURCE: Estimates are based on the Annual Administrative Reports of the Corporation From 1992-93 to 2003-04.
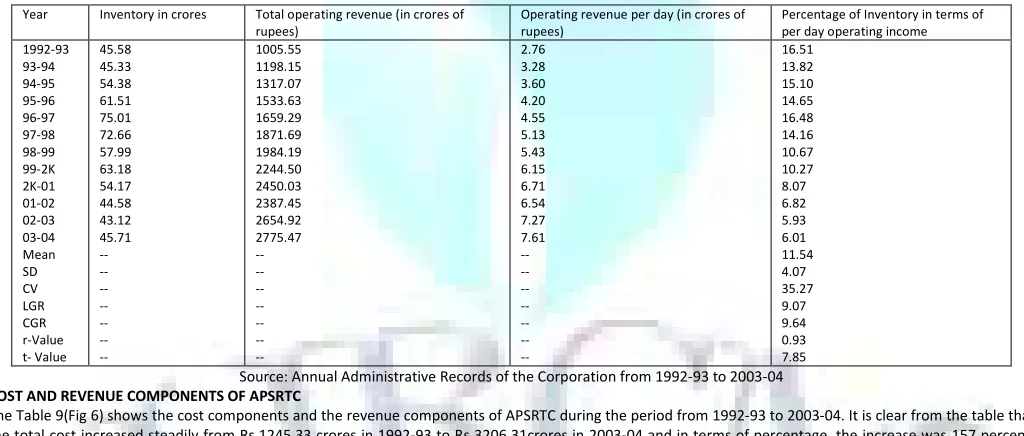
LEVEL OF INVENTORY IN TERMS OF PER DAY OPERATING INCOME
The table 8(Fig 5) shows the level of inventory in APSRTC in relation to its operating revenue. The figures are estimated based on the ratio of inventory to per day operating income. It is clear from the table that the operating revenue of the corporation was Rs.2775.47 crores in 2003-04 while it was Rs. 1005.55 crores in 1992-93. The total operating revenue of the corporation was changed by 76 percent while, the inventory was changed by 65 percent between the period understudy. This shows that the change in the inventory is less in comparison with the changes in operating revenue of the corporation. Since the former is significantly higher than that of the later, it indicates the lesser amount of inventory with the corporation.
The figures on the ratio of inventory to per day operating income show that it was maximum at 16.51 at the base year of the study and minimum at 5.93 in 2002-03. It is to be noted that the value was continuously reduced from 14.16 to 5.93 between 1997-98 and 2002-03. However it was increased to 6.01 in the terminal year of the study and indicates that, to achieve a required amount of operating income, a lowest of 5.93 percent and a highest of 16.51 percent of inventory was maintained during the period under review. It is observed that there is a significant decreasing growth of 9.07 percent in the ratio of inventory to per day operating income during the study period. The corresponding t – value is given by 7.85, which is highly significant at 1 percent level. It is also evident that the decrease in the inventory in terms of per day operating income is a good sign of inventory maintenance.
TABLE 8: LEVEL OF INVENTORY IN TERMS OF PER DAY OPERATING INCOME
Year Inventory in crores Total operating revenue (in crores of rupees)
Operating revenue per day (in crores of rupees)
Percentage of Inventory in terms of per day operating income 1992-93 93-94 94-95 95-96 96-97 97-98 98-99 99-2K 2K-01 01-02 02-03 03-04 Mean SD CV LGR CGR r-Value t- Value 45.58 45.33 54.38 61.51 75.01 72.66 57.99 63.18 54.17 44.58 43.12 45.71 -- -- -- -- -- -- -- 1005.55 1198.15 1317.07 1533.63 1659.29 1871.69 1984.19 2244.50 2450.03 2387.45 2654.92 2775.47 -- -- -- -- -- -- -- 2.76 3.28 3.60 4.20 4.55 5.13 5.43 6.15 6.71 6.54 7.27 7.61 -- -- -- -- -- -- -- 16.51 13.82 15.10 14.65 16.48 14.16 10.67 10.27 8.07 6.82 5.93 6.01 11.54 4.07 35.27 9.07 9.64 0.93 7.85
Source: Annual Administrative Records of the Corporation from 1992-93 to 2003-04
COST AND REVENUE COMPONENTS OF APSRTC
The Table 9(Fig 6) shows the cost components and the revenue components of APSRTC during the period from 1992-93 to 2003-04. It is clear from the table that the total cost increased steadily from Rs.1245.33 crores in 1992-93 to Rs 3206.31crores in 2003-04 and in terms of percentage, the increase was 157 percent. Similarly the total revenue also showed a steady improvement over the years under review except in the year 2001-02. It was Rs. 1246.98 crores in the base year of the study and Rs. 2809.72 crores in the terminal year of the study, registering a growth rate of 125 percent.
TABLE 9: COST AND REVENUE COMPONENTS OF APSRTC (In Crores)
(Source: Annual Administrative Reports and MIS Records of the Corporation from 1992-93 to 2003-04)
Year Inventory ( in crores of rupees) Percentage of inventory to total Assets Percentage of inventory to current Assets
1992-93 93-94 94-95 95-96 96-97 97-98 98-99 99-2K 2K-01 01-02 02-03 03-04 45.58 45.33 54.38 61.51 75.01 72.66 57.99 63.18 54.17 44.58 43.12 45.71 4.27 3.97 4.35 4.36 4.82 4.21 3.13 3.21 2.69 2.16 2.05 2.08 19.69 19.52 21.9 24.46 29.48 28.01 21.75 22.54 24.58 20.51 19.96 20.61
INTERNATIONAL JOURNAL OF RESEARCH IN COMMERCE, IT & MANAGEMENT
It is evident from the table that the total revenue of the corporation showed an uptrend, on the other hand the total expenditure also showed an uptrend. The excess of expenditure over the revenue resulted losses expect for the years 1992-93, 1993-94, 1994-95 and 1995-96. However in the later part of the study period, the APSRTC had been making losses every year.
The data obtained on cost and revenue components of APSRTC is then compared with Inventory management practices of the corporation during the same period under study. It is evident that the Inventory management in APSRTC was good and did not show any impact on the losses obtained by the corporation.
CONCLUSION
The analysis of inventory management in APSRTC with respect to various parameters such as inventory per vehicle, inventory per lakh effective kilometers, and inventory in terms of number of month’s consumption revealed that, the inventory levels in APSRTC, though highest in the beginning of the study period, decreased during the latter part of the study period. HSD oil inventory which constituted major part of total stores inventory had been increasing at much faster rate with respect to various parameters for instance, the growth rate of HSD oil inventory per vehicle and per lakh effective kilometers is increased by 95 percent.
Thus, it is observed that, the performance of APSRTC in terms of inventory levels of stores & spares, spring assemblies, tyres & tubes, lubricants per vehicle and per lakh effective kilometers basis during the study period has been encouraging and is the most desirable situation. An analysis of inventory in terms of number of month’s consumption concluded that, the amount of material stocked with the corporation shown a reduction in the second part of the study period then compared to the beginning of the study period, as a result, lesser amount of capital was locked up in the inventories. Further, the level of inventory in relation to current assets, total assets and per day operating income concluded that there is a decreasing growth of inventory in all the three parameters. Since inventory being the least liquid component, the reduction in the inventory levels both in the current assets and total assets, indicates improvement in the liquidity of the corporation.
All these key parameters conclude the efficiency of the corporation in managing its Inventories. Hence, it is opined that the practices that were adopted by the corporation in managing its Inventories gives good results and did not show any influence on the losses of the corporation.. It is therefore suggested that the corporation should adopt the same practices in future also, to keep the inventory levels of the materials to a barest minimum.
REFERENCES
1. Annual Administrative Records of the Corporation from 1992-93 to 2003-04
2. Indian Journal of Transport Management, CIRT, Pune, March 2000
3. MIS Records of APSRTC from 1992-93 to 2003-04.
REQUEST FOR FEEDBACK
Dear Readers
At the very outset, International Journal of Research in Commerce, IT and Management (IJRCM)
acknowledges & appreciates your efforts in showing interest in our present issue under your kind perusal.
I would like to request you to supply your critical comments and suggestions about the material published
in this issue as well as on the journal as a whole, on our E-mails i.e.
or
for further improvements in the interest of research.
If you have any queries please feel free to contact us on our E-mail
.
I am sure that your feedback and deliberations would make future issues better – a result of our joint
effort.
Looking forward an appropriate consideration.
With sincere regards
Thanking you profoundly
Academically yours
Sd/-