International Journal of Engineering
J o u r n a l H o m e p a g e : w w w . i j e . i rEffects of Compactor Types on Aggregate Orientation of Asphalt Mixtures
M. O. Hamzah* a, W. C. Von b, N. H. Abdullah a
a School of Civil Engineering, Universiti Sains Malaysia, Engineering Campus, 14300 Nibong Tebal, Pulau Pinang, Malaysia b Geoconsult Asia Singapore PTE LTD, No. 5 Jalan Kilang Barat, #08-06 Petro Centre, Singapore 159349
P A P E R I N F O
Paper history:
Received 28 December 2012
Received in revised form 08 February 2013 Accepted 28 February 2013
Keywords:
Digital Image Processing Aggregate Orientation
Geometrically Cubical Shape Aggregate
A B S T R A C T
More than 90% of Malaysian roads are constructed using asphaltic concrete. However, previous investigations of asphaltic concrete have mainly concentrated on the macroscopic properties of the composite materials based on the assumption that the mixtures are homogeneous and isotropic. This paper applies a digital image processing technique to compare the orientations of coarse aggregate particles in asphaltic concrete compacted using Marshall, Servopac and Presbox compactors. Aggregate orientation was measured in terms of a vector magnitude and the average major axis angle.
The average major axis angle of all compactors are less than 45° indicating that aggregate orientation in all of the prepared specimens have the preferential orientation along the horizontal plane. The vector magnitude results of the Presbox compacted sample is the least, indicating the presence of the most randomly oriented aggregate. However, the Servopac specimens have more randomly oriented aggregate compared to Marshall specimens. An ANOVA analysis for vector magnitude indicates that only compaction method, not Geometrically Cubical Shaped (GCS) proportion, has a significant impact on aggregate orientation randomness.
doi:10.5829/idosi.ije.2013.26.07a.01
1. INTRODUCTION 1
More than 90% of Malaysian roads are constructed using asphaltic concrete. However, previous investigations of asphaltic concrete have mainly concentrated on the macroscopic properties of the composite materials based on the assumption that the mixtures are homogeneous and isotropic. Some studies have used digital image technique to analyze the microstructure of engineering materials. Asphalt, air voids and aggregate can be distinguished and identified by image processing based on their different colors. Masad et al. and Wang et al. [1, 2] have used 3-dimension computed tomography (CT) and 2-3-dimension image processing technique to analyze air voids and asphalt mixtures’ microstructure.
The inherent anisotropy of asphaltic concrete was quantified by using the inclination angles of the coarse aggregate particles and fine aggregates in the asphaltic concrete [3]. The contribution to the inherent anisotropy of each aggregate may not be the same but depends on the size, orientation, and sphericity of the aggregate
*Corresponding Author Email: [email protected] (M. O. Hamzah)
particle. Hence, aggregate characteristics such as angularity, flakiness and elongation indexes significantly influence the performance of asphaltic concrete. The presence of flaky and elongated aggregates in large proportion might reduce the fracture toughness of the asphaltic concrete since these aggregates are prone to break during mixing, construction and while in-service.
However, Geometrically Cubical Shaped (GCS) aggregate could lead to better aggregate interlocking than normal shape aggregates. The proper bonding between the adjacent spaces ensures better pavement performance but it is not always achieved due to poor interlocking of the normal shape aggregates. The use of GCS aggregate can improve the strength of the road as it is not easily breakable when exposed to continuous compressive loading [3].
Yue and Morin [4] applied an innovative digital image processing technique to quantify the orientations of coarse aggregate particles (> 2 mm) in asphaltic concrete. Digital image processing is the term used to convert video images into digital form, and applying various mathematical procedures to extract significant information from the picture. Digital image processing
has been applied by examining statistically the differences between the aggregate particles on horizontal and vertical cross sections of asphaltic concrete. The image editing software, named Picture Publisher (v.4.0) and image analysis statistics software, named MOCHA, have been used in digital image processing.
Kutay et al. [5] applied new 3D image processing and analysis methodologies to quantify the internal structure of asphalt mixtures using their X-ray Computed Tomography (CT) images. These techniques are crucial for proper utilization of X-ray CT for understanding the difference between the various compaction methods as well as to assess the relationship between laboratory and field compaction. The used X-ray CT device included a 420 keV continuous X-X-ray source and a linear array detector of 512 channels. The minimum aggregate size that can be measured using the X-ray CT technique is highly dependent on the spatial resolution of the images.
This paper presents the results from the 2-dimension digital image that was scanned from the surface of the hot-mix asphalt in an attempt to present the microstructure of hot-mix asphalt. The main objective of this study is to compare the aggregate orientation of asphalt specimens prepared by the Marshal, Servopac and Presbox compactors.
2. MATERIALS AND MIX GRADATION
Normal shaped aggregates and GCS aggregates were used in this study. In the laboratory, the GCS aggregate was crushed using a Barmac rock-on-rock vertical shaft impactor crusher marketed by Metso. The aggregates were crushed by means of impact, cleavage, attrition and abrasion. The crushing work allowed the aggregates to crush itself rather than relying on breaker bars, hammers or cones. There are four basic ways to obtain processed aggregate including impact, cleavage, attrition and abrasion. Fracture took place along the rock's natural grain, producing the characteristic cubical shape and surface texture. The physical properties of the coarse aggregates affect significantly the properties of the asphaltic concrete. The homogeneity of the mixture is better if the roughness of the aggregates’ surfaces is greater in the binding mechanism. The aggregates produced were geometrically cubical in shape and this can be seen from the aggregate flakiness and elongation indices shown in Table 1.
A conventional bitumen grade 80/100 supplied by PETRONAS was used as a binder for the specimens. The filler used in this study was hydrated lime.
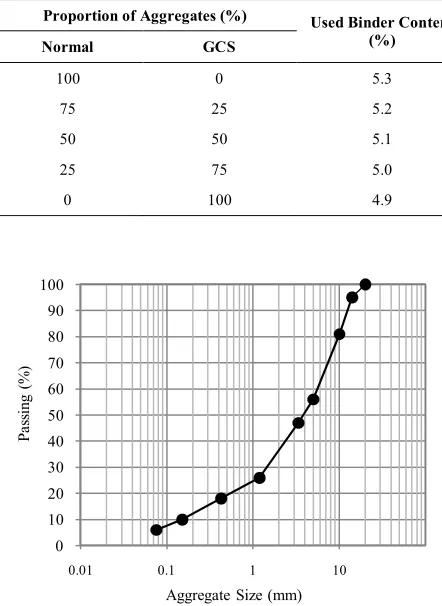
The aggregate gradation used conformed the particle size distribution given in the Malaysian Public Works Department for mix type AC14 [6]. The median gradation served as the target gradation as shown in
Figure 1. The used binder contents were 5.3, 5.2, 5.1, 5.0, 4.9% for 0, 25, 50, 75 and 100% of GCS aggregate, respectively. The test parameters are shown in Table 2. Table 3 shows the proportion of aggregate and the binder contents used in this study.
TABLE 1. Aggregate properties
Property Type of Aggregate Shape
GCS Normal
Flakiness Index (%) 6.0 21.3
Elongation Index (%) 10.1 23.7
Aggregate Crushing Value, ACV (%) 16.2 20.4
Aggregate Impact Value, AIV (%) 17.4 20.5
TABLE 2. Test parameters
Test Parameters Data
Geometrically Cubical Aggregate 0, 25, 50, 75 and 100%
Compactors Marshall, Servopac and Presbox
TABLE 3. Proportion of aggregate and binders contents
Proportion of Aggregates (%) Used Binder Content
(%)
Normal GCS
100 0 5.3
75 25 5.2
50 50 5.1
25 75 5.0
0 100 4.9
Figure 1. Aggregate gradation
0 10 20 30 40 50 60 70 80 90 100
0.01 0.1 1 10
Pa
ss
ing
(
%)
3. DIGITAL IMAGE AND EXPERIMENTAL PROCEDURES
According to the procedure stated by Lv et al. [7], the aggregate orientation test was conducted using digital image processing and analysis. Specimens compacted by the Marshall Hammer, Servopac and Presbox compactors were used for aggregate orientation test. A total of 20 specimens were produced from the Marshall hammer and Servopac machine with two replicates for all five GCS aggregate content. However, there were only two specimens prepared using the Presbox machine. The specimens represent 0 and 100% GCS aggregates each weighing 25 kg.
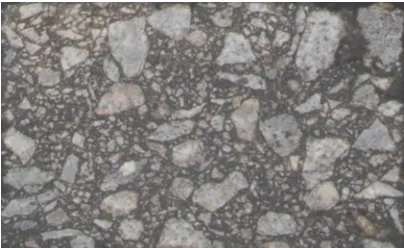
Laboratory prepared specimens produced from the Marshall and Servopac compactor had a diameter of 100 mm. The specimens were cut vertically into two halves as shown in Figure 2. The beams were cut vertically into 4 and horizontally into 2 as shown in Figure 3. The distance between the new cut section and the previous cut section cannot be less than 50 mm. The image of the cut cross section was scanned using a scanning machine. The photographs were converted into digital files for analysis. The major axis of the aggregates were then determined. Each measurement was labeled. Figure 4 shows a typical example of scanned image of a sliced HMA.
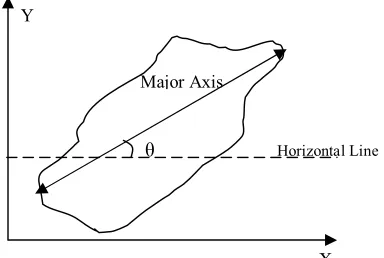
The particle orientation was measured as the angle between the major axis of the particle and the horizontal line. This is termed as the major axis angle. The major axis was defined as the longest distance between two points in the particle as shown in Figure 5. The major axis angle was measured manually using a protractor.
The orientation was measured by a vector magnitude (Δ) and the average major axis angle (θ). The vector magnitude varied between 0 and 100%. Complete random distribution of the orientation would give a 0% vector magnitude. A 100% vector magnitude implies that all observed orientation have the same direction. The vector magnitude and average major axis angle were calculated using Equations (1) and (2), respectively [7]:
Δ =100N (∑sin 2θk)2+(∑cos 2θk)2 (1)
θ=∑|θk|
N (2)
where θ is the average of major axis angle, θk is the
major axis angle of a particle, and N is the number of particles in an image.
4. RESULTS AND DISCUSSION
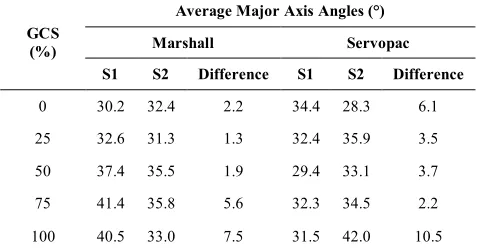
4. 1. Consistency of Compactors The average
major axis angles of two replicate cylindrical specimens produced by Marshall and Servopac compactors are
tabulated in Table 4. The major axis angles observed are generally consistent between the two specimens for Marshall and Servopac compactors. This can be observed by the small difference between the two replicate specimens. This indicates that the Marshall and Servopac compactor produce consistent replicate specimens.
Figure 2. Marshall and Servopac specimens
Figure 3. Presbox specimens
Figure 4. Example of scanned image of HMA
Figure 5. Geometric definition of an aggregate cross section
θ Horizontal Line
Y
The average major axis angle for Presbox specimens are shown in Table 5. The average major axis angle for 0 and 100% GCS aggregate vary from 27.9° to 32.7° and 29.5° to 33.1°, respectively. The variations are quite small considering that the specimen weighs 25 kg each. This indicates that the Presbox machine also produces consistent aggregate orientation distribution throughout the specimen.
TABLE 4. Average major axis angles for cylindrical specimens
GCS (%)
Average Major Axis Angles (°)
Marshall Servopac
S1 S2 Difference S1 S2 Difference
0 30.2 32.4 2.2 34.4 28.3 6.1
25 32.6 31.3 1.3 32.4 35.9 3.5
50 37.4 35.5 1.9 29.4 33.1 3.7
75 41.4 35.8 5.6 32.3 34.5 2.2
100 40.5 33.0 7.5 31.5 42.0 10.5
TABLE 5. Aggregate major axis angles for Presbox compactor
Average Major Axis
Angles (°)
GCS (%)
0 Average 100 Average
H1 32.4
27.9 34.8 32.7
H2 23.4 30.5
V1 24.6
29.5
27.8
33.1
V2 28.2 32.3
V3 33.6 39.3
V4 31.5 32.9
4. 2. Effects of Geometrically Cubical Shape
Aggregate on Aggregate Orientation The effects
of GCS aggregate on aggregate orientation were evaluated for both Marshall and Servopac compactors. The test results are shown in Figure 6. The results imply that there is no clear trend that how the CGS aggregate content affects the aggregate orientation. Similar pattern is found in Servopac specimens shown in Figure 7. The experimental data from Marshall specimens range from 10.2° to 32.9° as indicated by the hatched area. The Servopac data were found to range from 9.4° to 21.3°. Further investigation should be carried out to improve fundamental understanding on the relationship between GCS aggregate content and aggregate orientation.
The influence of the GCS aggregate content on the aggregate structure was also investigated by measuring the change in aggregate orientation as shown in Figure
8. It is evident that the vector magnitude changes as the GCS aggregate content changes. The changes are larger for Marshall specimens. An increase in GCS aggregate content causes more changes in the vector magnitude but the pattern is different for all three compactors. The Presbox compactor experience a negative change in vector magnitude indicating that the aggregate orientation becomes more random when 100% GCS aggregate was incorporated.
Figure 6. Vector magnitude of Marshall specimen
Figure 7. Vector magnitude of Servopac specimen
Figure 8. Change in vector magnitude
0 5 10 15 20 25 30 35
0 25 50 75 100
V
ec
to
r
M
ag
nit
ud
e,
Δ
(
°
)
Geometrically Cubical Aggregate (%) Marshall
0 5 10 15 20 25
0 25 50 75 100
V
ec
to
r
M
agn
it
ud
e,
Δ
(
°
)
Geometrically Cubical Aggregat (%) Servopac
-20 0 20 40 60 80 100 120 140 160 180
25 50 75 100
C
ha
ng
e
in
V
ec
to
r
M
agn
itu
de
(
%
)
Geometrically Cubical Aggregate (%)
4. 3. Effects of Compactor Type on Aggregate
Orientation The average major axis angle (θ) and
vector magnitude (Δ) of specimens from the Marshall, Servopac and Presbox compactors are shown in Figures 9 and 10. The result shows that the angle inclination of Marshall, Servopac and Presbox are less than 45°. These indicate that particles orientation in all of the prepared specimens tend to be on the horizontal plane. Zhang [3] also indicated that the aggregates in an asphalt mixture have the preferential orientation along the horizontal direction. In general, the vector magnitude is consistently smaller for Servopac specimens compared to Marshall specimens. This indicates that the Servopac specimens appear to have more randomly oriented aggregate compared to Marshall specimens. However, the Presbox specimen at both 0% and 100% GCS aggregate has the smallest vector magnitude. This indicates the most randomly oriented aggregate in the specimen. Yue and Morin [4] found in their study that the aggregate particles may be more randomly oriented in mixes compacted with Marshall compactor compared to gyratory compactor. From a study done by Lv et al. [7], different compaction methods affect the vector magnitude of aggregates in the specimen.
Figure 9. Average major axis angle for different compactors
Figure 10. Vector magnitude for different compactors
The digital image processing results for Marshall, Servopac and Presbox specimens are illustrated in Figures 11 to 13. Segregation is visible in Presbox specimen. This may be due to the large amount of materials to be handled at once.
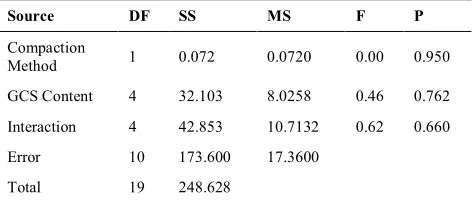
Further analyses are carried out using a two-way analysis of variance (ANOVA). Five GCS aggregate contents ranging from 0 to 100%, and compaction method between Marshall and Servopac compactor, at 95% confidence level were analyzed. The results for average major axis angle of the mixes are shown in Table 6. The p-value of more than 0.05 implies that the compaction method, GCS aggregate content and the interaction factor do not significantly affect the aggregate angles in the asphalt mix.
Figure 11. Vertically sliced Marshall hammer compacted specimen
Figure 12. Vertically sliced Servopac compacted specimen
Figure 13. Vertically sliced Presbox compacted specimen
0 5 10 15 20 25 30 35 40 45
0 25 50 75 100
A
ve
ra
ge
M
aj
or
A
xi
s
A
ng
le
(
θ
)
Geometrically Cubical Aggregate (%) Marshall Servopac Presbox
0 5 10 15 20 25 30 35
0 25 50 75 100
V
ec
to
r
M
agn
itu
de
(
Δ
)
Geometrically Cubical Aggregate (%)
Table 7 shows the two-way ANOVA analysis for vector magnitude of asphalt mix. The results indicate that only compaction method has significant impact on aggregate orientation randomness. This is indicated by the p-value of less than 0.05. The GCS content does not seem to give any significant effect on the vector magnitude of dense asphalt. Furthermore, the interaction factor also indicates that the effect is not significant.
TABLE 6. Two-way ANOVA on aggregate average major axis angle of asphalt mix
Source DF SS MS F P
Compaction
Method 1 0.072 0.0720 0.00 0.950
GCS Content 4 32.103 8.0258 0.46 0.762
Interaction 4 42.853 10.7132 0.62 0.660
Error 10 173.600 17.3600
Total 19 248.628
TABLE 7. Two-way ANOVA on aggregate vector magnitude of asphalt mix
Source DF SS MS F P
Compaction
Method 1 272.485 272.485 10.14 0.010
GCS Content 4 241.475 60.369 2.25 0.136
Interaction 4 157.911 39.478 1.47 0.282
Error 10 268.615 26.861
Total 19 940.485
5. CONCLUSIONS
The orientation angles of specimens compacted using both Servopac and Presbox compactors are more randomly oriented compared to Marshall specimens. However, the Presbox specimens were found to have the most randomly oriented aggregate at 0% and 100% GCS aggregate content. The aggregate angles tend to be more on the horizontal plane for all three compaction methods. Segregation is obviously seen to occur in the Presbox specimens, but the aggregates are the most randomly oriented. Great care must be exercised during specimen compaction as it will affect the aggregate distribution. Segregation may occur if the asphalt
pre-compaction stage is not well managed. Nevertheless, the Presbox compactor is ranked highest in producing specimens with randomly oriented aggregates while the Marshall compactor is ranked last out of the three compactors. In future tests, it is recommended to carry out a study that shows the comparison between Marshall, Servopac and Presbox compactors with more test specimens. It is also recommended that the specimens should be cut vertically and horizontally to obtain a better understanding of the influence of compactor types on aggregate orientation.
6. ACKNOWLEDGEMENT
The authors would like to acknowledge the Malaysia Ministry of Higher Education that funded this research grant through the Fundamental Research Grant Scheme that enables this paper to be written. Many thanks also due to the technicians of the Highway Engineering Laboratory at the University Sains Malaysia for their help. Authors acknowledged PETRONAS and Kuad Quarry Sdn Bhd, Penang for the supply of bitumen and aggregate.
7. REFERENCES
1. Masad, E., Muhunthan, B., Shashidhar, N. and Harman, T., "Internal structure characterization of asphalt concrete using image analysis", Journal of Computing in Civil Engineering, Vol. 13, No. 2, (1999), 88-95.
2. Wang, L., Frost, J. and Lai, J., "Three-dimensional digital representation of granular material microstructure from x-ray tomography imaging", Journal of Computing in Civil
Engineering, Vol. 18, No. 1, (2003), 28-35.
3. Zhang, Y., Luo, R. and Lytton, R. L., "Microstructure-based inherent anisotropy of asphalt mixtures", Journal of Materials
in Civil Engineering, Vol. 23, No. 10, (2011), 1473-1482.
4. Yue, Z. Q. and Morin, I., "Digital image processing for aggregate orientation in asphalt concrete mixtures", Canadian
Journal of Civil Engineering, Vol. 23, No. 2, (1996), 480-489.
5. Kutay, M. E., Arambula, E., Gibson, N. and Youtcheff, J., "Three-dimensional image processing methods to identify and characterise aggregates in compacted asphalt mixtures",
International Journal of Pavement Engineering, Vol. 11, No.
6, (2010), 511-528.
6. Malaysia, P., "Standard specification for road works, section 4, flexible pavement", Jabatan. Kerja Raya Malaysia, Kuala
Lumpur, (2008).
Effects of Compactor Types on Aggregate Orientation of Asphalt Mixtures
M. O. Hamzaha, W. C. Von b, N. H. Abdullah a
a School of Civil Engineering, Universiti Sains Malaysia, Engineering Campus, 14300 Nibong Tebal, Pulau Pinang, Malaysia b Geoconsult Asia Singapore PTE LTD, No. 5 Jalan Kilang Barat, #08-06 Petro Centre, Singapore 159349
P A P E R I N F O
Paper history:
Received 28 December 2012
Received in revised form 08 February 2013 Accepted 28 February 2013
Keywords:
Digital Image Processing Aggregate Orientation
Geometrically Cubical Shape Aggregate
هﺪﯿﮑﭼ طﻮﻠﺨﻣ ﯽﺘﻟﺎﻔﺳآ ﯽﮑﯾ زا هﺪﻤﻋ ﻦﯾﺮﺗ داﻮﻣ هدﺎﻔﺘﺳا يزﺎﺴﻫارردهﺪﺷ ﻪﮐﺖﺳا ﺶﯿﺑ زا % 90 هار يﺎﻫ اريﺰﻟﺎﻣ ﺪﻧﺎﺷﻮﭘﯽﻣ . زا ﺎﺠﻧآ ﻪﮐ رد ﯽﺳرﺮﺑ يﺎﻫ ﻪﺘﺷﺬﮔ طﻮﻠﺨﻣ ﯽﺘﻟﺎﻔﺳآ ﻪﺑ ترﻮﺻ ﻦﮕﻤﻫ و ﮏﯿﭘوﺮﺗوﺰﯾا ضﺮﻓ هﺪﺷ ،ﺖﺳا هﺪﻤﻋ تﺎﻘﯿﻘﺤﺗ ﺎﻬﻨﺗ صاﻮﺧ ﯽﭙﮑﺳوﺮﮐﺎﻣ داﻮﻣ ﻞﯿﮑﺸﺗ هﺪﻨﻫد طﻮﻠﺨﻣ ﯽﺘﻟﺎﻔﺳآ ار ﯽﺳرﺮﺑ هدﺮﮐ ﺪﻧا . ﻦﯾارد ﻪﻟﺎﻘﻣ ﺎﺑ هدﺎﻔﺘﺳا زا ﮏﯿﻨﮑﺗ شزادﺮﭘ ﺮﯾﻮﺼﺗ هﻮﺤﻧ،ﯽﻟﺎﺘﯿﺠﯾد ﺖﻬﺟ يﺮﯿﮔ ﺎﻫﻪﻧاﺪﮕﻨﺳ رد ﻪﻧﻮﻤﻧ يﺎﻫ طﻮﻠﺨﻣ ﯽﺘﻟﺎﻔﺳآ ﻪﯿﻬﺗ هﺪﺷ ﺎﮕﺘﺳدرد يﺎﻬﻫ طﻮﻠﺨﻣﻢﮐاﺮﺗ ﯽﺘﻟﺎﻔﺳآ لﺎﺷرﺎﻣ ، ﮏﭘوﺮﺳ و سﺮﭘ ﺲﮐﺎﺑ وﯽﺳرﺮﺑ هﺪﺷﻪﺴﯾﺎﻘﻣ ﺖﺳا . ﺖﻬﺟ يﺮﯿﮔ ﻪﻧاﺪﮕﻨﺳ زا ﺮﻈﻧ ﺪﻧا هزا رادﺮﺑ ﺪﻨﯾآﺮﺑ و ﻂﺳﻮﺘﻣ ﻪﯾواز رﻮﺤﻣ ﯽﻠﺻا ﻪﺒﺳﺎﺤﻣ هﺪﯾدﺮﮔ ﺖﺳا . ﻂﺳﻮﺘﻣ ﻪﯾواز رﻮﺤﻣ ﯽﻠﺻا رد ﯽﻣﺎﻤﺗ ﻢﮐاﺮﺗيﺎﻬﻫﺎﮕﺘﺳد ﺮﺘﻤﮐ زا 45 ﻪﺟرد هدﻮﺑ و ﻦﯾا نﺎﺸﻧ ﺪﻫﺪﯿﻣ ﻪﮐ ﻫ ﻪﻤ يﺎﻫﻪﻧﻮﻤﻧ ﻪﯿﻬﺗ هﺪﺷ ياراد ﺖﻬﺟ يﺮﯿﮔ ﻪﺑ ﺖﻤﺳ رﻮﺤﻣ ﯽﻘﻓا ﯽﻣ ﺪﻨﺷﺎﺑ . ﻪﺟﻮﺗﺎﺑ ﯽﻣﺎﻤﺗﻪﺑ يﺎﻫﻪﻧﻮﻤﻧ ﻪﯿﻬﺗ هﺪﺷ ،