Year in review: health protection in NSW, 2010
Centre for Health Protection,
NSW Department of Health
The prevention and control of communicable and envi-ronmental threats to health is the work of health protec-tion services around the world. This year we expand the usual year in review of communicable disease surveil-lance in NSW to highlight some of the work of NSW health protection services in 2010. The annual review of notifications of communicable diseases in NSW is embedded within this report; for detail on surveillance data, refer to Tables 1–5, which show disease-specific data on notifiable conditions* reported by: year of onset of illness; month of onset of illness; local health district; and age group and sex.
TheCentre for Health Protectionaims to reduce the threats
to health and the burden of illness posed by communicable diseases and the environment in New South Wales (NSW). It achieves this through the development and application of legislation, regulations, policies and guidelines, through allocation of resources, monitoring of program performance (in non-government, community, education, ambulatory and inpatient settings) and collaboration with public health units, local health districts and other agencies. The Centre has three branches which are responsible for these activities: • TheEnvironmental Health Branchfacilitates the pre-vention, assessment and management of environmental factors which can adversely affect human health. • TheAIDS and Infectious Diseases Branchis
responsi-ble for policy and program management activities that seek to prevent and reduce morbidity associated with bloodborne, sexually transmissible and vaccine-preventable diseases.
• TheCommunicable Diseases Branchconducts surveil-lance for notifiable communicable diseases and develops control measures to help prevent their spread.
Vaccine-preventable diseases Notification data
There were 9900 notifications of vaccine-preventable dis-ease reported in NSW in 2010. This represents a 45% increase compared with the previous 5-year average annual disease count. Highlights in 2010 included:
• A continued high level ofpertussis activity with 9255 notifications, compared with 12 408 in 2009. The number of notifications was highest in children aged 5–9 years (2719 notifications) and 10–14 years (1606 notifications). • A continued long-term decline in the number of notifica-tions ofmeningococcal disease over the past 10 years (73 notifications compared with 91 in 2009). The greatest decline was in notifications of meningococcal disease due to serogroup C disease, with six cases notified in 2010. Free immunisation against meningococcal disease due to serogroup C meningococcal disease commenced in 2003. • A small rise inmeaslesnotifications with 26 cases notified compared with 19 in 2009. Of the notifications in 2010, 15 were associated with an outbreak on the NSW North Coast (three from correctional facilities) linked to an unimmu-nised person who acquired the infection overseas.
Prevention activities
Immunisation rates for children and adolescents have improved in some age groups in recent years in NSW, however further work is required to improve coverage rates for 12-month old Aboriginal children.
According to the Australian Childhood Immunisation Register, in 2010 full immunisation was recorded for: • 91.4% of 12-month old children, a decrease of 0.7% from
2009a
NSW PUBLIC HEALTH
BULLETIN
CONTENTS – See back page w w w . p u b l i s h . c s i r o . a u / j o u r n a l s / p h b
Year in review
*Please note that from the May–June 2011 issue of theBulletin, ‘notifiable
conditions’ are now referred to in both text and tables as ‘scheduled medical conditions’, reflecting the terminology of the NSWPublic Health Act 2010.
aA child is assessed as fully vaccinated at 12 months of age if he/she has
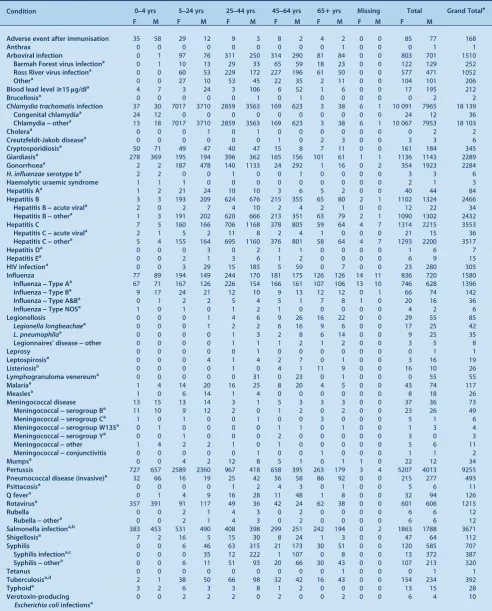
Table 1. Disease notifications by year of onset of illness, NSW, 1993]2010
Condition 1993 1994 1995 1996 1997 1998 1999 2000 2001 2002 2003 2004 2005 2006 2007 2008 2009 2010
Adverse event after immunisation 23 40 28 56 70 95 16 42 111 177 219 187 107 72 239 257 126 168
Anthrax 0 0 0 0 0 0 0 0 0 0 0 0 0 1 0 0 0 1
Arboviral infection 628 372 525 1221 1804 770 1215 971 1178 652 1015 1138 1077 1918 1495 1835 1408 1510
Barmah Forest virus infectiona 25 39 271 172 185 134 249 197 395 395 451 400 449 643 574 529 358 252
Ross River virus infectiona
598 331 236 1031 1600 575 951 748 717 182 492 697 575 1221 839 1152 908 1052
Othera 5 2 18 18 19 61 15 26 66 75 72 41 53 54 82 154 142 206
Blood lead level$15lg/dla
Not notifiable until December 1996 710 877 699 994 513 499 335 302 234 295 286 263 203 212
Botulism 0 0 0 0 0 0 1 0 0 0 0 1 0 0 0 0 0 0
Brucellosisa
4 4 2 1 3 3 2 1 1 2 3 7 3 9 4 1 4 2
Chancroida Not notifiable until December 1998 1 0 0 0 0 0 0 0 0 0 0 0
Chlamydia trachomatisinfection 566 2440 3481 4465 5764 7721 9956 11 216 12 027 12 404 13 967 14 923 18 139
Congenital chlamydiaa Not notifiable until August 1998 5 14 18 16 15 22 28 46 39 31 44 51 36
Chlamydia]othera
Not notifiable until August 1998 561 2426 3463 4449 5749 7699 9928 11 170 11 988 12 373 13 923 14 872 18 103
Choleraa
1 0 1 3 1 1 2 0 1 1 0 1 0 3 2 2 3 2
Creutzfeldt-Jakob diseasea
Not notifiable until April 2004 6 8 11 9 8 10 6
Cryptosporidiosisa
Not notifiable until December 1996 156 1127 121 134 194 306 203 351 847 777 542 485 1462 345
Diphtheriaa
0 0 0 0 0 0 0 0 0 0 0 0 0 0 0 0 0 0
Foodborne illness (NOS)b
106 213 270 211 255 201 151 147 56 41 1071 550 309 507 763 667 903 728
Gastroenteritis (institutional) 443 296 1359 554 939 738 673 697 775 1752 3583 12 784 1395 10 641 10 488 10 135 11 769 9386
Giardiasisa
Not notifiable until August 1998 401 1091 978 966 858 1027 1228 1448 1721 1943 1779 2097 2289
Gonorrhoeaa
382 357 428 522 636 1051 1276 1047 1351 1500 1312 1415 1558 1724 1368 1313 1638 2284
Haemolytic uraemic syndrome Not notifiable until December 1996 3 6 10 9 2 7 5 9 11 11 12 17 4 3
H. influenzaeserotype ba
124 61 29 13 17 11 13 8 7 10 6 4 7 11 7 8 6 6
Hepatitis Aa
579 583 612 956 1422 923 412 191 196 146 123 137 79 94 65 69 96 84
Hepatitis B 3567 3944 3947 3439 3097 3155 3441 3675 3749 3370 2721 2668 2710 2481 2596 2524 2620 2466
Hepatitis B]acute virala
95 73 61 43 53 56 72 97 89 87 74 51 56 52 56 44 37 34
Hepatitis B]othera
3472 3871 3886 3396 3044 3099 3369 3578 3660 3283 2647 2617 2654 2429 2540 2480 2583 2432
Hepatitis C 5846 7716 6677 6710 6608 6913 7945 7630 7263 6227 4894 4595 4310 4321 4164 3734 3824 3553
Hepatitis C]acute virala
21 14 31 18 19 110 103 214 272 144 122 58 43 56 64 26 40 36
Hepatitis C]othera
5825 7702 6646 6692 6589 6803 7842 7416 6991 6083 4772 4537 4267 4265 4100 3708 3784 3517
Hepatitis Da
12 19 19 9 11 3 13 12 11 9 12 14 15 15 11 14 9 7
Hepatitis Ea
1 2 0 3 6 4 7 9 6 6 5 8 7 10 8 14 17 15
HIV infectiona
589 503 538 450 424 404 379 352 344 397 413 403 392 366 387 326 329 305
Influenza 244 1006 856 1004 1486 683 2067 1891 12 832 1580
Influenza]Type Aa
Not notifiable until December 2000 216 766 763 817 1167 490 1705 843 12 556 1396
Influenza]Type Ba
Not notifiable until December 2000 27 239 55 160 298 183 185 1028 162 142
Influenza]Type A&Ba
Not notifiable until December 2003 0 10 2 3 3 12 36
Influenza]Type NOSa
Not notifiable until December 2000 1 1 38 27 11 8 174 17 102 6
Legionellosis 66 60 75 74 33 45 41 41 68 44 59 80 88 78 105 90 94 85
Legionella longbeachaea
13 8 16 30 9 18 12 12 29 21 37 27 24 22 29 52 64 42
L. pneumophilaa
34 30 35 34 18 22 22 26 38 22 22 51 63 56 74 37 28 35
Legionnaires’ disease]other 19 22 24 10 6 5 7 3 1 1 0 2 1 0 2 1 2 8
Leprosy 5 3 3 2 0 0 1 2 3 0 2 5 1 1 4 4 0 1
Leptospirosisa
16 14 6 33 33 50 56 52 65 39 39 39 34 17 9 17 18 19
Listeriosisa
12 10 14 22 23 28 22 18 12 11 28 30 25 26 22 34 27 26
Lymphogranuloma venereuma
0 0 0 0 0 0 0 0 0 0 0 1 2 1 0 3 4 55
Malariaa
173 184 96 202 173 157 174 227 154 103 119 97 204 136 93 109 88 117
Measlesa
2345 1483 596 191 272 119 33 31 30 7 18 12 5 60 3 39 19 26
Meningococcal disease 153 142 113 161 218 184 214 247 229 212 194 146 136 102 108 80 91 73
Meningococcal]serogroup Ba
8 8 27 40 53 54 94 93 88 104 98 81 73 54 76 49 57 49
Meningococcal]serogroup Ca
8 11 8 38 55 55 59 64 38 54 44 24 15 13 9 9 7 6
Meningococcal]serogroup W135a
0 0 1 0 2 4 4 3 1 2 2 5 8 5 2 5 5 4
Meningococcal]serogroup Ya 1 1 0 1 0 7 1 7 2 2 5 3 3 1 5 4 3 3
Meningococcal]other 136 122 77 82 108 64 56 80 100 50 45 33 37 29 16 13 19 11
Meningococcal]conjunctivitis 0 0 0 0 0 2 3 4 2 3 4 3 3 5 3 1 4 2
Mumpsa
13 11 14 27 30 38 32 91 28 29 36 64 109 154 318 76 39 34
Paratyphoida,c 9 11 12 15 5 9 5 14 11 13 22 10 0 0 0 0
Pertussis 1534 1405 1370 1157 4246 2306 1413 3696 4441 2013 2771 3568 5805 4915 2099 8756 12 408 9255
Pneumococcal disease (invasive)a
Not notifiable until December 2000 444 878 796 903 637 564 523 549 474 493
Psittacosisa
Not notifiable until December 2000 38 155 88 81 120 94 35 40 22 11
Q fevera 403 267 200 286 258 235 164 131 143 308 287 219 143 176 205 166 139 126
Rotavirusa
0 0 0 0 0 0 0 0 0 0 0 0 0 0 0 0 0 1215
Rubella 1186 233 2375 636 153 78 46 190 58 35 24 18 10 37 9 17 7 12
Congenital rubellaa
2 4 1 5 0 0 1 0 0 0 1 1 0 0 1 0 0 0
Rubella]othera 1184 229 2374 631 153 78 45 190 58 35 23 17 10 37 8 17 7 12
Salmonella infectiona,c
944 1075 1276 1228 1700 1815 1427 1409 1654 2100 1847 2135 2165 2055 2540 2239 2658 3671
Shigellosisa Not notifiable until December 2000 133 82 57 96 133 74 70 107 148 112
Syphilis 21 64 183 117 95 86 223 291 376 458 775 752 548 609 818 835 929 707
Congenital syphilis 0 2 6 3 3 0 3 3 1 2 3 1 9 4 5 3 0 0
Syphilis infectiona,d
7 28 131 72 57 44 85 79 65 126 238 293 240 223 451 426 532 387
Syphilis]othera 14 34 46 42 35 42 135 209 310 330 534 458 299 382 362 406 397 320
Tetanus 5 4 0 1 3 3 1 3 0 0 1 0 1 2 2 1 1 1
Tuberculosisa,e 390 388 443 407 422 384 477 450 421 448 378 408 455 452 452 488 505 392
Typhoida
28 25 27 30 27 18 32 26 30 24 14 38 26 34 32 43 45 28
Verotoxin-producingEscherichia coliinfectionsa
Not notifiable until December 1996 0 2 0 1 1 6 3 5 16 10 23 19 21 10
Onset of illness: the earlier of patient reported onset date, specimen date or date of notification.
aLaboratory-confirmed cases only.bFoodborne illness cases are only those notified as part of an outbreak.cFrom 2005, all paratyphoid recorded as salmonellosis.dIncludes syphilis primary, syphilis secondary,
syphilis,1 y duration and syphilis newly acquired.e
Tuberculosis data reported on diagnosis year.f
Includes cases with unknown PHU. NOS: not otherwise specified.
No case of the following diseases have been notified since 1991: plagueb, diphtheriab, granuloma inguinaleb, lyssavirusb, poliomyelitisb, rabies, smallpox, typhusb, viral haemorrhagic fever, yellow fever.
2009 influenza data: cases reported to public health units; contain 50 laboratory notifications from either interstate residents or overseas travellers.
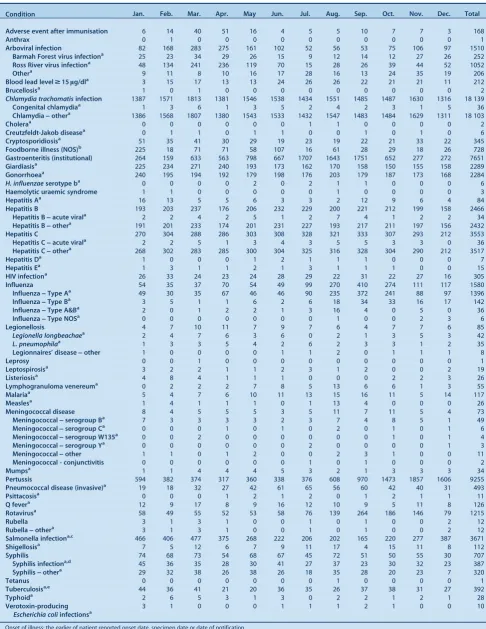
Table 2. Disease notifications by month of onset of illness, NSW, 2010
Condition Jan. Feb. Mar. Apr. May Jun. Jul. Aug. Sep. Oct. Nov. Dec. Total
Adverse event after immunisation 6 14 40 51 16 4 5 5 10 7 7 3 168
Anthrax 0 1 0 0 0 0 0 0 0 0 0 0 1
Arboviral infection 82 168 283 275 161 102 52 56 53 75 106 97 1510
Barmah Forest virus infectiona
25 23 34 29 26 15 9 12 14 12 27 26 252
Ross River virus infectiona
48 134 241 236 119 70 15 28 26 39 44 52 1052
Othera
9 11 8 10 16 17 28 16 13 24 35 19 206
Blood lead level$15lg/dla
3 15 17 13 13 24 26 26 22 21 21 11 212
Brucellosisa
1 0 1 0 0 0 0 0 0 0 0 0 2
Chlamydia trachomatisinfection 1387 1571 1813 1381 1546 1538 1434 1551 1485 1487 1630 1316 18 139
Congenital chlamydiaa 1 3 6 1 3 5 2 4 2 3 1 5 36
Chlamydia]othera
1386 1568 1807 1380 1543 1533 1432 1547 1483 1484 1629 1311 18 103
Choleraa
0 0 0 0 0 0 1 1 0 0 0 0 2
Creutzfeldt-Jakob diseasea
0 1 1 0 1 1 0 0 1 0 1 0 6
Cryptosporidiosisa
51 35 41 30 29 19 23 19 22 21 33 22 345
Foodborne illness (NOS)b
225 18 71 71 58 107 16 61 28 29 18 26 728
Gastroenteritis (institutional) 264 159 633 563 798 667 1707 1643 1751 652 277 272 7651
Giardiasisa 225 234 271 240 193 173 162 170 158 150 155 158 2289
Gonorrhoeaa
240 195 194 192 179 198 176 203 179 187 173 168 2284
H. influenzaeserotype ba
0 0 0 0 2 0 2 1 1 0 0 0 6
Haemolytic uraemic syndrome 1 1 0 0 0 0 0 1 0 0 0 0 3
Hepatitis Aa
16 13 5 5 6 3 3 2 12 9 6 4 84
Hepatitis B 193 203 237 176 206 232 229 200 221 212 199 158 2466
Hepatitis B]acute virala
2 2 4 2 5 1 2 7 4 1 2 2 34
Hepatitis B]othera
191 201 233 174 201 231 227 193 217 211 197 156 2432
Hepatitis C 270 304 288 286 303 308 328 321 333 307 293 212 3553
Hepatitis C]acute virala
2 2 5 1 3 4 3 5 5 3 3 0 36
Hepatitis C]othera 268 302 283 285 300 304 325 316 328 304 290 212 3517
Hepatitis Da
1 0 0 0 1 2 1 1 1 0 0 0 7
Hepatitis Ea
1 3 1 1 2 1 3 1 1 1 0 0 15
HIV infectiona 26 33 24 23 24 28 29 22 31 22 27 16 305
Influenza 54 35 37 70 54 49 99 270 410 274 111 117 1580
Influenza]Type Aa
49 30 35 67 46 46 90 235 372 241 88 97 1396
Influenza]Type Ba
3 5 1 1 6 2 6 18 34 33 16 17 142
Influenza]Type A&Ba
2 0 1 2 2 1 3 16 4 0 5 0 36
Influenza]Type NOSa
0 0 0 0 0 0 0 1 0 0 2 3 6
Legionellosis 4 7 10 11 7 9 7 6 4 7 7 6 85
Legionella longbeachaea 2 4 7 6 3 6 0 2 1 3 5 3 42
L. pneumophilaa
1 3 3 5 4 2 6 2 3 3 1 2 35
Legionnaires’ disease]other 1 0 0 0 0 1 1 2 0 1 1 1 8
Leprosy 0 0 1 0 0 0 0 0 0 0 0 0 1
Leptospirosisa
3 2 2 1 1 2 3 1 2 0 0 2 19
Listeriosisa
4 8 4 1 1 1 0 0 0 2 2 3 26
Lymphogranuloma venereuma
0 2 2 2 7 8 5 13 6 6 1 3 55
Malariaa
5 4 7 6 10 11 13 15 16 11 5 14 117
Measlesa
1 4 1 1 1 0 1 13 4 0 0 0 26
Meningococcal disease 8 4 5 5 5 3 5 11 7 11 5 4 73
Meningococcal]serogroup Ba 7 3 3 3 3 2 3 7 4 8 5 1 49
Meningococcal]serogroup Ca
0 0 0 1 0 1 0 2 0 1 0 1 6
Meningococcal]serogroup W135a
0 0 2 0 0 0 0 0 0 1 0 1 4
Meningococcal]serogroup Ya
0 0 0 0 0 0 2 0 0 0 0 1 3
Meningococcal]other 1 1 0 1 2 0 0 2 3 1 0 0 11
Meningococcal - conjunctivitis 0 0 0 0 0 0 1 0 1 0 0 0 2
Mumpsa
1 1 4 4 4 5 3 2 1 3 3 3 34
Pertussis 594 382 374 317 360 338 376 608 970 1473 1857 1606 9255
Pneumococcal disease (invasive)a
19 18 32 27 42 61 65 56 60 42 40 31 493
Psittacosisa
0 0 0 1 2 1 2 0 1 2 1 1 11
Q fevera 12 9 17 8 9 16 12 10 9 5 11 8 126
Rotavirusa
58 49 55 52 53 58 76 139 264 186 146 79 1215
Rubella 3 1 3 1 0 0 1 0 1 0 0 2 12
Rubella]othera
3 1 3 1 0 0 1 0 1 0 0 2 12
Salmonella infectiona,c
466 406 477 375 268 222 206 202 165 220 277 387 3671
Shigellosisa
7 5 12 6 7 9 11 17 4 15 11 8 112
Syphilis 74 68 73 54 68 67 45 72 51 50 55 30 707
Syphilis infectiona,d
45 36 35 28 30 41 27 37 23 30 32 23 387
Syphilis]othera
29 32 38 26 38 26 18 35 28 20 23 7 320
Tetanus 0 0 0 0 0 0 0 1 0 0 0 0 1
Tuberculosisa,e 44 36 41 21 20 36 35 26 37 38 31 27 392
Typhoida
2 6 5 3 1 3 0 2 2 1 2 1 28
Verotoxin-producing
Escherichia coliinfectionsa
3 1 0 0 0 1 1 1 2 1 0 0 10
Onset of illness: the earlier of patient reported onset date, specimen date or date of notification.
aLaboratory-confirmed cases only.bFoodborne illness cases are only those notified as part of an outbreak.cIncludes all paratyphoid cases.dIncludes syphilis primary, syphilis secondary,
syphilis,1 y duration and syphilis newly acquired.e
Tuberculosis data reported on diagnosis year. NOS: not otherwise specified.
No case of the following diseases have been notified since 1991: plaguea
, diphtheriaa
, granuloma inguinalea
, lyssavirusa
, poliomyelitisa
, rabies, smallpox, typhusa
, viral haemorrhagic fever, yellow fever. 2010 influenza data: cases reported to public health units; contain 50 laboratory notifications from either interstate residents or overseas.
Table 3. Incidence rate of disease notifications by local health district of residence, crude rates per 100 000 population, NSW, 2010 (based on onset of illness)
Condition Sydney Central
Coast Far West
Hunter New England
Illawarra Shoalhaven
Mid North Coast
Murrum-bidgee
Nepean Blue Mountains
Northern Sydney
Northern NSW
South Eastern Sydney
South Western
Sydney Southern
NSW Western
Sydney Western
NSW
Adverse event after immunisation
1.6 1.3 9.5 3.1 4.1 0.0 7.2 2.9 1.6 0.3 2.8 1.0 3.5 2.2 2.2
Anthrax 0.0 0.0 0.0 0.0 0.0 0.0 0.3 0.0 0.0 0.0 0.0 0.0 0.0 0.0 0.0
Arboviral infection 4.6 22.7 97.8 29.4 13.7 42.1 74.6 13.0 7.1 77.4 6.8 3.1 43.0 3.3 84.6
Barmah Forest virus infectiona
0.2 4.1 9.5 5.6 3.4 19.4 3.4 0.3 0.1 25.3 0.0 0.1 10.5 0.2 7.8
Ross River virus infectiona
1.6 13.9 88.3 21.8 4.7 20.3 70.8 12.2 2.0 47.3 1.1 1.8 30.5 2.3 76.1
Othera 2.8 4.7 0.0 2.1 5.4 2.4 0.3 0.6 4.9 4.7 5.8 1.2 2.0 0.7 0.7
Blood lead level$15lg/dla 1.8 1.0 22.1 2.4 0.5 0.0 21.6 2.0 0.5 1.0 1.0 1.7 2.0 1.2 20.4
Brucellosisa
0.0 0.0 0.0 0.2 0.0 0.0 0.0 0.0 0.0 0.0 0.0 0.0 0.0 0.0 0.0
Chlamydia trachomatisinfection 300.3 279.5 290.2 318.8 261.3 215.5 236.7 218.7 163.4 287.2 363.0 165.9 205.5 181.5 285.0
Congenital chlamydiaa
0.0 0.3 0.0 0.5 0.8 0.5 1.0 0.3 0.1 0.3 0.4 1.0 0.5 0.6 1.1
Chlamydia]othera 300.1 279.2 290.2 318.4 260.5 215.1 235.6 218.2 163.3 286.9 362.6 164.9 204.5 180.9 283.1
Choleraa
0.0 0.0 0.0 0.0 0.0 0.0 0.0 0.3 0.0 0.0 0.0 0.0 0.0 0.0 0.0
Creutzfeldt-Jakob diseasea
0.0 0.0 0.0 0.2 0.5 0.0 0.3 0.0 0.0 0.0 0.0 0.0 0.0 0.1 0.0
Cryptosporidiosisa
6.0 5.1 3.2 5.7 1.3 6.6 6.2 5.2 6.7 6.4 4.0 2.4 4.0 3.9 7.4
Giardiasisa
38.5 29.7 18.9 28.2 24.1 18.9 31.1 33.0 42.3 6.8 57.3 20.3 19.0 24.9 40.1
Gonorrhoeaa 86.9 16.7 12.6 21.2 10.9 14.2 4.8 13.0 22.2 16.2 94.8 21.7 4.5 17.3 1.9
H. influenzaeserotype ba
0.0 0.0 0.0 0.1 0.3 0.5 0.0 0.3 0.0 0.0 0.0 0.1 0.0 0.0 0.4
Haemolytic uraemic syndrome 0.2 0.0 0.0 0.0 0.3 0.0 0.0 0.0 0.0 0.0 0.0 0.0 0.5 0.0 0.0
Hepatitis Aa
1.8 0.3 3.2 0.7 0.8 0.0 0.3 0.3 1.0 1.4 1.2 0.8 0.5 3.4 0.7
Hepatitis B 66.2 6.0 12.6 8.0 11.9 11.3 10.6 16.8 26.9 4.4 48.6 55.0 9.0 67.9 14.1
Hepatitis B]acute virala 0.4 0.0 0.0 0.2 0.5 0.5 1.4 0.3 0.4 0.0 0.1 0.9 0.5 0.2 1.5
Hepatitis B]othera
65.9 6.0 12.6 7.8 11.4 10.9 9.2 16.5 26.5 4.4 48.5 54.0 8.5 67.6 12.6
Hepatitis C 61.3 48.3 37.9 37.5 44.0 50.1 42.7 40.6 20.4 71.0 47.1 51.6 53.0 33.5 56.0
Hepatitis C]acute virala
0.4 0.3 0.0 0.5 0.3 0.5 1.7 0.3 0.0 0.3 0.4 0.4 2.0 0.0 3.0
Hepatitis C]othera
60.8 48.0 37.9 37.1 43.8 49.2 41.0 40.3 20.3 70.6 46.6 51.2 51.0 33.5 52.7
Hepatitis Da 0.2 0.0 0.0 0.0 0.5 0.0 0.0 0.0 0.0 0.0 0.1 0.2 0.0 0.0 0.4
Hepatitis Ea
1.1 0.0 0.0 0.0 0.0 0.0 0.0 0.0 0.1 0.0 0.4 0.6 0.0 0.0 0.0
Influenza 9.5 8.5 6.3 15.2 24.9 23.2 29.8 36.2 17.6 29.7 23.6 14.7 27.5 32.2 26.0
Influenza]Type Aa
7.5 8.2 3.2 14.0 23.8 22.7 29.4 32.5 15.7 27.0 18.9 13.0 24.0 27.5 22.6
Influenza]Type Ba 1.9 0.3 3.2 1.0 0.3 0.5 0.0 3.2 1.7 2.0 3.8 1.5 2.5 3.2 1.9
Influenza]Type A&Ba 0.0 0.0 0.0 0.1 0.8 0.0 0.3 0.3 0.2 0.3 1.0 0.1 0.5 1.5 1.5
Influenza]Type NOSa
0.0 0.0 0.0 0.0 0.0 0.0 0.0 0.3 0.0 0.3 0.0 0.1 0.5 0.1 0.0
Legionellosis 1.1 0.9 0.0 1.3 3.1 0.5 0.7 2.9 1.1 0.0 0.7 0.7 2.0 1.6 0.7
Legionella longbeachaea
0.2 0.6 0.0 0.3 3.1 0.5 0.0 1.5 0.6 0.0 0.1 0.2 2.0 0.6 0.4
L. pneumophilaa 0.5 0.3 0.0 0.5 0.0 0.0 0.7 1.5 0.5 0.0 0.6 0.5 0.0 0.9 0.0
Legionnaires’ disease]other 0.4 0.0 0.0 0.5 0.0 0.0 0.0 0.0 0.0 0.0 0.0 0.0 0.0 0.1 0.4
Leprosy 0.0 0.0 0.0 0.0 0.3 0.0 0.0 0.0 0.0 0.0 0.0 0.0 0.0 0.0 0.0
Leptospirosisa
0.2 0.0 0.0 0.3 0.3 0.0 1.0 0.0 0.1 2.0 0.1 0.2 0.0 0.0 0.4
Listeriosisa
0.2 0.3 3.2 0.3 0.3 0.0 0.0 0.0 0.8 0.7 0.4 0.4 0.5 0.2 0.4
Lymphogranuloma venereuma 3.3 0.0 0.0 0.0 0.0 0.0 0.3 0.0 0.2 0.0 3.2 0.0 0.0 0.5 0.0
Malariaa
3.0 0.0 0.0 1.7 2.3 0.5 1.4 0.6 2.0 2.4 1.0 0.9 1.0 2.8 0.0
Measlesa
0.0 0.6 0.0 0.0 0.0 0.0 0.3 0.3 0.5 4.1 0.1 0.0 0.0 0.0 0.0
Meningococcal disease 0.5 3.2 0.0 1.5 2.1 2.4 0.3 1.4 0.2 0.3 0.6 1.2 0.5 0.5 1.9
Meningococcal]serogroup Ba
0.2 2.5 0.0 0.9 1.3 1.9 0.0 1.5 0.1 0.0 0.2 0.8 0.5 0.5 1.1
Meningococcal]serogroup Ca 0.4 0.3 0.0 0.0 0.3 0.5 0.0 0.0 0.1 0.0 0.0 0.0 0.0 0.0 0.0
Meningococcal]serogroup W135a
0.0 0.3 0.0 0.1 0.3 0.0 0.0 0.0 0.0 0.0 0.0 0.0 0.0 0.0 0.4
Meningococcal]serogroup Ya
0.0 0.0 0.0 0.2 0.0 0.0 0.0 0.0 0.0 0.0 0.0 0.1 0.0 0.0 0.0
Meningococcal]other 0.0 0.0 0.0 0.2 0.3 0.0 0.3 0.0 0.0 0.3 0.4 0.2 0.0 0.0 0.4
Meningococcal] conjunctivitis
0.0 0.0 0.0 0.0 0.0 0.0 0.0 0.0 0.0 0.0 0.1 0.0 0.0 0.1 0.0
Mumpsa
1.2 0.6 0.0 0.3 0.8 0.0 0.3 0.0 0.6 0.0 0.6 0.9 0.0 0.0 0.0
Pertussis 118.8 60.3 343.9 87.6 138.5 69.5 190.2 128.4 195.3 72.0 141.4 105.3 238.5 122.0 149.6
Pneumococcal disease (invasive)a
6.0 6.0 3.2 7.2 6.7 3.3 5.8 7.8 7.4 7.4 9.0 6.1 7.5 5.2 10.0
Psittacosisa
0.0 0.6 0.0 0.3 0.3 0.0 0.3 0.0 0.2 0.0 0.1 0.0 0.0 0.1 0.0
Q fevera
0.4 1.3 3.2 5.1 3.4 2.4 0.7 0.6 0.1 7.4 0.1 0.9 2.0 0.4 4.5
Rotavirusa
20.3 13.6 3.2 18.8 17.1 9.5 9.2 24.6 24.0 19.9 20.9 9.9 9.0 16.2 7.1
Rubella 0.4 0.3 0.0 0.2 0.0 0.0 0.0 0.0 0.2 0.3 0.4 0.1 0.0 0.0 0.0
Rubella]othera 0.4 0.3 0.0 0.2 0.0 0.0 0.0 0.0 0.2 0.3 0.4 0.1 0.0 0.0 0.0
Salmonella infectiona,b
57.1 54.6 31.6 43.0 36.5 51.5 58.5 53.6 56.7 76.7 54.7 50.9 34.5 48.4 36.4
Shigellosisa
3.3 0.6 0.0 0.8 1.6 0.5 0.7 0.3 1.7 2.4 3.8 1.2 1.5 0.9 0.4
Syphilis 32.9 7.9 22.1 3.6 6.2 4.3 2.4 1.7 4.3 2.7 27.6 8.1 2.5 3.4 9.6
Syphilis infectiona,c 21.7 1.9 3.2 1.4 0.3 0.5 1.4 1.2 3.4 0.3 20.8 1.4 0.5 1.2 2.2
Syphilis]othera
11.2 6.0 18.9 2.3 6.0 3.8 1.0 0.6 1.0 2.4 6.8 6.7 2.0 2.2 7.1
Tetanus 0.0 0.0 0.0 0.1 0.0 0.0 0.0 0.0 0.0 0.0 0.0 0.0 0.0 0.0 0.0
Tuberculosisa,d
14.2 1.0 0.0 1.0 2.3 1.4 1.4 3.8 4.2 1.4 10.4 5.3 1.0 10.8 1.5
Typhoida
0.5 0.0 0.0 0.0 0.0 0.0 0.0 0.3 0.4 0.0 0.8 0.6 0.0 1.0 0.0
Verotoxin-producing
Escherichia coliinfectionsa
0.0 0.0 0.0 0.9 0.0 0.0 0.0 0.0 0.0 0.7 0.0 0.0 0.0 0.0 0.0
Onset of illness: the earlier of patient reported onset date, specimen date or date of notification.
a
Laboratory-confirmed cases only.b
Includes all paratyphoid cases.c
Includes syphilis primary, syphilis secondary, syphilis,1 y duration and syphilis newly acquired.d
Tuberculosis data reported on diagnosis year. NOS: not otherwise specified
No case of the following diseases have been notified since 1991: plaguea
, diphtheriaa
, granuloma inguinalea
, lyssavirusa
, poliomyelitisa
, rabies, smallpox, typhusa
, viral haemorrhagic fever, yellow fever. 2010 influenza data: cases reported to public health units; contain 50 laboratory notifications from either interstate residents or overseas.
Table 4. Disease notifications by local health district of residence, NSW, 2010 (based on onset of illness)
Condition Sydney Central
Coast Far West
Hunter New England
Illawarra Shoalhaven
Mid North Coast
Murrum-bidgee
Nepean Blue Mountains
Northern Sydney
Northern NSW
South Eastern Sydney
South Western
Sydney Southern
NSW Western Sydney
Western NSW
Justice Health
Other Totale
Adverse event after immunisation
9 4 3 27 16 0 21 10 13 1 23 9 7 18 6 0 1 168
Anthrax 0 0 0 0 0 0 1 0 0 0 0 0 0 0 0 0 0 1
Arboviral infection 26 72 31 258 53 89 218 45 59 229 57 27 86 27 228 0 5 1510
Barmah Forest virus infectiona 1 13 3 49 13 41 10 1 1 75 0 1 21 2 21 0 0 252
Ross River virus infectiona 9 44 28 191 18 43 207 42 17 140 9 16 61 19 205 0 3 1052
Othera
16 15 0 18 22 5 1 2 41 14 48 10 4 6 2 0 2 206
Blood lead level$15lg/dla
10 3 7 21 2 0 63 7 4 3 8 15 4 10 55 0 0 212
Brucellosisa
0 0 0 2 0 0 0 0 0 0 0 0 0 0 0 0 0 2
Chlamydia trachomatisinfection 1714 886 92 2796 1009 456 692 755 1361 850 3024 1440 411 1494 768 178 213 18 139
Congenital chlamydiaa 0 1 0 4 3 1 3 1 1 1 3 9 1 5 3 0 0 36
Chlamydia]othera
1714 885 92 2792 1006 455 689 754 1360 849 3021 1431 410 1489 765 178 213 18 103
Choleraa
0 0 0 0 0 0 0 1 0 0 0 0 0 0 0 0 1 2
Creutzfeldt-Jakob diseasea
0 0 0 2 2 0 1 0 0 0 0 0 0 1 0 0 0 6
Cryptosporidiosisa 34 16 1 50 5 14 18 18 56 19 33 21 8 32 20 0 0 345
Giardiasisa 220 94 6 247 93 40 91 114 352 20 477 176 38 205 108 2 6 2289
Gonorrhoeaa
496 53 4 186 42 30 14 45 185 48 790 188 9 142 6 4 42 2284
H. influenzaeserotype ba
0 0 0 1 1 1 0 1 0 0 0 1 0 0 1 0 0 6
Haemolytic uraemic syndrome 1 0 0 0 1 0 0 0 0 0 0 0 1 0 0 0 0 3
Hepatitis Aa 10 1 1 6 3 0 1 1 8 4 11 7 1 28 2 0 0 84
Hepatitis B 378 19 4 70 46 24 31 58 224 13 405 477 18 559 38 67 35 2466
Hepatitis B]acute virala
2 0 0 2 2 1 4 1 3 0 1 8 1 2 4 3 0 34
Hepatitis B]othera
376 19 4 68 44 23 27 57 221 13 404 469 17 557 34 64 35 2432
Hepatitis C 350 153 12 329 170 106 125 140 170 210 392 448 106 276 151 359 56 3553
Hepatitis C]acute virala 2 1 0 4 1 1 5 1 0 1 3 4 4 0 8 1 0 36
Hepatitis C]othera
348 152 12 325 169 105 120 139 170 209 389 444 102 276 143 358 56 3517
Hepatitis Da
1 0 0 0 2 0 0 0 0 0 1 2 0 0 1 0 0 7
Hepatitis Ea
6 0 0 0 0 0 0 0 1 0 3 5 0 0 0 0 0 15
Influenza 54 27 2 133 96 49 87 125 147 88 197 128 55 265 70 1 56 1580
Influenza]Type Aa 43 26 1 123 92 48 86 112 131 80 157 113 48 226 61 1 48 1396
Influenza]Type Ba
11 1 1 9 1 1 0 11 14 6 32 13 5 26 5 0 6 142
Influenza]Type A&Ba
0 0 0 1 3 0 1 1 2 1 8 1 1 12 4 0 1 36
Influenza]Type NOSa
0 0 0 0 0 0 0 1 0 1 0 1 1 1 0 0 1 6
Legionellosis 6 3 0 11 12 1 2 10 9 0 6 6 4 13 2 0 0 85
Legionella longbeachaea 1 2 0 3 12 1 0 5 5 0 1 2 4 5 1 0 0 42
L. pneumophilaa
3 1 0 4 0 0 2 5 4 0 5 4 0 7 0 0 0 35
Legionnaires’ disease]other 2 0 0 4 0 0 0 0 0 0 0 0 0 1 1 0 0 8
Leprosy 0 0 0 0 1 0 0 0 0 0 0 0 0 0 0 0 0 1
Leptospirosisa 1 0 0 3 1 0 3 0 1 6 1 2 0 0 1 0 0 19
Listeriosisa
1 1 1 3 1 0 0 0 7 2 3 3 1 2 1 0 0 26
Lymphogranuloma venereuma
19 0 0 0 0 0 1 0 2 0 27 0 0 4 0 0 2 55
Malariaa
17 0 0 15 9 1 4 2 17 7 8 9 2 23 0 0 3 117
Measlesa
0 2 0 0 0 0 1 1 4 12 1 0 0 0 0 4 1 26
Meningococcal disease 3 10 0 13 8 5 1 5 2 1 5 10 1 4 5 0 0 73
Meningococcal]serogroup Ba 1 8 0 8 5 4 0 5 1 0 2 7 1 4 3 0 0 49
Meningococcal]serogroup Ca
2 1 0 0 1 1 0 0 1 0 0 0 0 0 0 0 0 6
Meningococcal]serogroup W135a
0 1 0 1 1 0 0 0 0 0 0 0 0 0 1 0 0 4
Meningococcal]serogroup Ya 0 0 0 2 0 0 0 0 0 0 0 1 0 0 0 0 0 3
Meningococcal]other 0 0 0 2 1 0 1 0 0 1 3 2 0 0 1 0 0 11
Meningococcal] conjunctivitis
0 0 0 0 0 0 0 0 0 0 1 0 0 1 0 0 0 2
Mumpsa
7 2 0 3 3 0 1 0 5 0 5 8 0 0 0 0 0 34
Pertussis 678 191 109 768 535 147 556 443 1627 213 1178 914 477 1004 403 0 12 9255
Pneumococcal disease (invasive)a
34 19 1 63 26 7 17 27 62 22 75 53 15 43 27 1 1 493
Psittacosisa
0 2 0 3 1 0 1 0 2 0 1 0 0 1 0 0 0 11
Q fevera 2 4 1 45 13 5 2 2 1 22 1 8 4 3 12 0 1 126
Rotavirusa 116 43 1 165 66 20 27 85 200 59 174 86 18 133 19 0 3 1215
Rubella 2 1 0 2 0 0 0 0 2 1 3 1 0 0 0 0 0 12
Rubella]othera
2 1 0 2 0 0 0 0 2 1 3 1 0 0 0 0 0 12
Salmonella infectiona,b
326 173 10 377 141 109 171 185 472 227 456 442 70 398 98 3 13 3671
Shigellosisa 19 2 0 7 6 1 2 1 14 7 32 10 3 7 1 0 0 112
Syphilis 188 25 7 32 24 9 7 6 36 8 230 70 5 28 26 0 6 707
Syphilis infectiona,c
124 6 1 12 1 1 4 4 28 1 173 12 1 10 6 0 3 387
Syphilis]othera
64 19 6 20 23 8 3 2 8 7 57 58 4 18 20 0 3 320
Tetanus 0 0 0 1 0 0 0 0 0 0 0 0 0 0 0 0 0 1
Tuberculosisa,d 81 3 0 9 9 3 4 13 35 4 87 46 2 89 4 0 3 392
Typhoida
3 0 0 0 0 0 0 1 3 0 7 5 0 8 0 0 1 28
Verotoxin-producing
Escherichia coliinfectionsa
0 0 0 8 0 0 0 0 0 2 0 0 0 0 0 0 0 10
Onset of illness: the earlier of patient reported onset date, specimen date or date of notification.
a
Laboratory-confirmed cases only.b
Includes all paratyphoid cases.c
Includes syphilis primary, syphilis secondary, syphilis,1 y duration and syphilis newly acquired.d
Tuberculosis data reported on diagnosis year.eIncludes cases with unknown local health district.
NOS: not otherwise specified
Table 5. Disease notifications by age group and sex of the case, NSW, 2010 (based on onset of illness)
Condition 0]4 yrs 5]24 yrs 25]44 yrs 45]64 yrs 651yrs Missing Total Grand Totale
F M F M F M F M F M F M F M
Adverse event after immunisation 35 58 29 12 9 3 8 2 4 2 0 0 85 77 168
Anthrax 0 0 0 0 0 0 0 0 0 1 0 0 0 1 1
Arboviral infection 0 1 97 76 311 250 314 290 81 84 0 0 803 701 1510
Barmah Forest virus infectiona
0 1 10 13 29 33 65 59 18 23 0 0 122 129 252
Ross River virus infectiona
0 0 60 53 229 172 227 196 61 50 0 0 577 471 1052
Othera
0 0 27 10 53 45 22 35 2 11 0 0 104 101 206
Blood lead level$15lg/dla
4 7 3 24 3 106 6 52 1 6 0 0 17 195 212
Brucellosisa
0 0 0 0 0 1 0 1 0 0 0 0 0 2 2
Chlamydia trachomatisinfection 37 30 7017 3710 2859 3563 169 623 3 38 6 1 10 091 7965 18 139
Congenital chlamydiaa
24 12 0 0 0 0 0 0 0 0 0 0 24 12 36
Chlamydia]othera
13 18 7017 3710 2859 3563 169 623 3 38 6 1 10 067 7953 18 103
Choleraa
0 0 0 1 0 1 0 0 0 0 0 0 0 2 2
Creutzfeldt-Jakob diseasea
0 0 0 0 0 0 1 0 2 3 0 0 3 3 6
Cryptosporidiosisa
50 71 49 47 40 47 15 8 7 11 0 0 161 184 345
Giardiasisa
278 369 195 194 396 362 165 156 101 61 1 1 1136 1143 2289
Gonorrhoeaa
2 2 187 478 140 1133 24 292 1 16 0 2 354 1923 2284
H. influenzaeserotype ba
2 2 0 0 1 0 0 1 0 0 0 0 3 3 6
Haemolytic uraemic syndrome 1 1 1 0 0 0 0 0 0 0 0 0 2 1 3
Hepatitis Aa 1 2 21 24 10 10 3 6 5 2 0 0 40 44 84
Hepatitis B 3 3 193 209 624 676 215 355 65 80 2 1 1102 1324 2466
Hepatitis B]acute virala
2 0 2 7 4 10 2 4 2 1 0 0 12 22 34
Hepatitis B]othera
1 3 191 202 620 666 213 351 63 79 2 1 1090 1302 2432
Hepatitis C 7 5 160 166 706 1168 378 805 59 64 4 7 1314 2215 3553
Hepatitis C]acute virala
2 1 5 2 11 8 2 4 1 0 0 0 21 15 36
Hepatitis C]othera
5 4 155 164 695 1160 376 801 58 64 4 7 1293 2200 3517
Hepatitis Da 0 0 0 3 0 2 1 1 0 0 0 0 1 6 7
Hepatitis Ea
0 0 2 1 3 6 1 2 0 0 0 0 6 9 15
HIV infectiona
0 0 3 29 15 185 5 59 0 7 0 0 23 280 305
Influenza 77 89 194 149 244 170 181 175 126 126 14 11 836 720 1580
Influenza]Type Aa
67 71 167 126 226 154 166 161 107 106 13 10 746 628 1396
Influenza]Type Ba
9 17 24 21 12 10 9 13 12 12 0 1 66 74 142
Influenza]Type A&Ba
0 1 2 2 5 4 5 1 7 8 1 0 20 16 36
Influenza]Type NOSa
1 0 1 0 1 2 1 0 0 0 0 0 4 2 6
Legionellosis 0 0 0 1 4 6 9 26 16 22 0 0 29 55 85
Legionella longbeachaea
0 0 0 1 2 2 6 16 9 6 0 0 17 25 42
L. pneumophilaa 0 0 0 0 1 3 2 8 6 14 0 0 9 25 35
Legionnaires’ disease]other 0 0 0 0 1 1 1 2 1 2 0 0 3 5 8
Leprosy 0 0 0 0 0 1 0 0 0 0 0 0 0 1 1
Leptospirosisa 0 0 0 4 1 4 2 7 0 1 0 0 3 16 19
Listeriosisa
0 0 0 0 1 0 4 1 11 9 0 0 16 10 26
Lymphogranuloma venereuma
0 0 0 0 0 31 0 23 0 1 0 0 0 55 55
Malariaa
1 4 14 20 16 25 8 20 4 5 0 0 43 74 117
Measlesa
1 0 6 14 1 4 0 0 0 0 0 0 8 18 26
Meningococcal disease 13 15 13 14 3 1 5 3 3 3 0 0 37 36 73
Meningococcal]serogroup Ba
11 10 9 12 2 0 1 2 0 2 0 0 23 26 49
Meningococcal]serogroup Ca 1 0 1 0 0 1 0 0 3 0 0 0 5 1 6
Meningococcal]serogroup W135a
0 1 0 0 0 0 1 1 0 1 0 0 1 3 4
Meningococcal]serogroup Ya
0 0 1 0 0 0 2 0 0 0 0 0 3 0 3
Meningococcal]other 1 4 2 2 1 0 1 0 0 0 0 0 5 6 11
Meningococcal]conjunctivitis 0 0 0 0 0 1 0 0 1 0 0 0 1 1 2
Mumpsa
0 0 4 2 12 8 5 1 0 1 1 0 22 12 34
Pertussis 727 657 2589 2360 967 418 658 395 263 179 3 4 5207 4013 9255
Pneumococcal disease (invasive)a 32 66 16 19 25 42 56 58 86 92 0 0 215 277 493
Psittacosisa
0 0 0 0 1 2 4 3 0 1 0 0 5 6 11
Q fevera
0 1 4 9 16 28 11 48 1 8 0 0 32 94 126
Rotavirusa 357 391 91 117 49 36 42 24 62 38 0 0 601 606 1215
Rubella 0 0 2 1 4 3 0 2 0 0 0 0 6 6 12
Rubella]othera
0 0 2 1 4 3 0 2 0 0 0 0 6 6 12
Salmonella infectiona,b
383 453 531 490 408 398 299 251 242 194 0 2 1863 1788 3671
Shigellosisa
7 2 16 5 15 30 8 24 1 3 0 0 47 64 112
Syphilis 0 0 6 46 63 315 21 173 30 51 0 0 120 585 707
Syphilis infectiona,c
0 0 0 35 12 222 1 107 0 8 0 0 13 372 387
Syphilis]othera 0 0 6 11 51 93 20 66 30 43 0 0 107 213 320
Tetanus 0 0 0 0 0 0 0 0 0 1 0 0 0 1 1
Tuberculosisa,d
2 1 38 50 66 98 32 42 16 43 0 0 154 234 392
Typhoida 3 2 6 3 3 8 1 2 0 0 0 0 13 15 28
Verotoxin-producing
Escherichia coliinfectionsa
0 0 2 2 2 0 2 0 0 2 0 0 6 4 10
Onset of illness: the earlier of patient reported onset date, specimen date or date of notification.
a
Laboratory-confirmed cases only.b
Includes all paratyphoid cases.c
Includes syphilis primary, syphilis secondary, syphilis,1 y duration and syphilis newly acquired.d
Tuberculosis data reported on diagnosis year.e
Includes cases with unknown age and sex and people who identify as transgender. NOS: not otherwise specified. F: female. M: male.
Institutional gastrointestinal outbreaks and foodborne illness are excluded from this table as complete demographic data are not routinely collected.
No case of the following diseases have been notified since 1991: plaguea, diphtheriaa, granuloma inguinalea, lyssavirusa, poliomyelitisa, rabies, smallpox, typhusa, viral haemorrhagic fever, yellow fever.
2010 influenza data: cases reported to public health units; contain 50 laboratory notifications from either interstate residents or overseas.
• 92.4% of 2-year old children, a decrease of 0.1% from 2009b
• 87.6% of 5-year old children, an increase of 4.3% from 2009.c
In 2010, full immunisation coverage in Aboriginal children was recorded for:
• 86.6% of 12-month old Aboriginal children, a decrease of 0.4% from 2009a
• 91.9% of 2-year old Aboriginal children, an increase of 1.4% from 2009b
• 82.3% of 5-year old Aboriginal children, an increase of 2.2% from 2009.c
In 2010, the NSW School-Based Vaccination Program vaccinated:
• 70% of Year 7 and 62% of Year 10 children with the diphtheria-tetanus-pertussis vaccine booster
• 77% of Year 7 girls with at least one dose and 67% of Year 7 girls for three doses of human papillomavirus vaccine
• 63% of Year 7 children with at least one dose and 57% of children with two doses of hepatitis B vaccine (hepatitis B vaccination is only offered to children who have not previously received a full course) • 34% of Year 7 children with varicella vaccine (varicella
vaccination is only offered to children without history of infection or vaccination).
These data do not include children who received these free vaccines from general practitioners (GPs) or other immu-nisation providers.
In response to increased pertussis and measles notifica-tions, the following initiatives continued in 2010:
• Information provided for new parents of babies regis-tered with Medicare stressing the importance of vacci-nating their baby on time and ensuring other household members are up to date with their pertussis vaccinations. • Free pertussis vaccine provided for new parents, grand-parents and other adults who regularly care for infants less than 12 months of age to protect infants too young to be vaccinated (233 565 doses distributed to GPs in 2010). • Free measles-mumps-rubella vaccine provided to con-tacts of people with measles to prevent further transmis-sion in the community.
• Communication with health care workers and the public through the media, the NSW Health website and specific fax streams.
Bloodborne viruses Notification data
There was an overall slight decrease in bloodborne virus notifications in NSW in 2010. Highlights included: • A slight decrease in the total number of hepatitis B
notifications, with 2466 reported in 2010 (2620 notifi-cations in 2009). Hepatitis B notifinotifi-cations were predom-inantly in men and women aged 25–39 years.
• A slight decrease in undifferentiatedhepatitis C noti-fications, with 3517 reported in 2010 (3784 notifications in 2009). Hepatitis C was most prevalent in men and women aged 25–54 years.
• Notifications of newly acquired hepatitis B and
hepatitis Cinfection remained stable.
• A slight decrease inhuman immunodeficiency virus
(HIV) infectionnotifications,with 305 reported in 2010
(329 notifications in 2009). In 2010, 230 notifications (75%) were reported to be homosexually acquired. The number of HIV infections reported to be heterosexually acquired decreased from 77 in 2009 to 50 in 2010.
Note that because of the chronic nature of hepatitis B and hepatitis C infection, repeat testing and repeat notification of cases is common for these conditions. Recent improve-ments in methods for cleaning data have resulted in the identification of duplicate notifications for hepatitis B and C cases. This has led to a more accurate count of cases through a reduction in the number of case notifications for previous years, particularly before 2005.
Prevention activities
NSW Health has a range of policies and strategies in place to control the spread of HIV, hepatitis B and hepatitis C, including regular campaigns to promote safe sex, needle and syringe programs to provide sterile equipment to injecting drug users, and support of the management of patients with sexually transmissible infections and hepati-tis C. Recent highlights have included:
• An independent evaluation in 2010 of theNSW HIV/ AIDS, Sexually Transmissible Infections and Hepatitis C Strategies 2006–2010, and the supporting Implemen-tation Plan for Aboriginal People. The evaluation found that efforts to prevent these conditions and to provide care for those affected have been effective.
• The 2008 Review of Hepatitis C Treatment and Care Services1 which recommended that NSW double the number of people on antiviral treatment by 2013. Policy initiatives have been implemented to: increase the capacity of specialist services; strengthen area-wide infrastructure; increase the nursing workforce; and trial the provision of treatment in community settings. Since the review, program initiatives (including establishment of additional clinical and program positions across NSW) have resulted in: a 42% increase (from 1264 people in 2005–2006 to 1800 people in 2008–2009) in the number of public patients treated for hepatitis C; and a 136% increase (from 28 sites in 2005–2006 to 66 sites
b
A child is assessed as fully vaccinated at 2 years of age (24 to,27 months of age) if he/she has received age-appropriate vaccinations against diphtheria, tetanus, pertussis, polio,Haemophilus influenzaetype B, hepatitis B, measles, mumps and rubella.
c
A child is assessed as fully vaccinated at 5 years of age if he/she has received age-appropriate vaccinations against diphtheria, tetanus, pertussis, polio,
in 2008–2009) in the number of public sites offering treatment.
• Ongoing commitment to prevention policies that employ a harm reduction approach, such as the NSW Needle and Syringe Program. According to an evalua-tion,2 during the period 2000–2009, the Program prevented 23 324 cases of HIV and 31 953 cases of hepatitis C.
• In 2010, the NSW Needle and Syringe Program com-prised 864 outlets (332 public sector outlets, 373 phar-macies and 159 dispensing machines). Approximately 9.5 million needles and syringes were dispensed and over 12 000 referrals were provided to drug treatment services, hepatitis services and other health and welfare agencies for people who inject drugs.
• In 2010, NSW publicly funded HIV and sexual health clinics provided 77 375 occasions of services to 6472 clients related to HIV treatment, management, and care. This was an increase of 3.2% of clients compared with 2009.
The regulation of skin penetration industries, and the enforcement of prescribed infection control and equipment standards, is an important part of bloodborne virus control in NSW. In 2010 a Skin Penetration Working Group was established to oversee policies and programs implemented through public health units (PHUs). The group aims to initiate a planning process to strengthen the infection control component of TAFE courses for the skin penetra-tion industry.
Sexually transmissible infections Notification data
Highlights in 2010 included:
• A decline in the number ofinfectious syphilis notifica-tions with 387 reported in 2010 (532 notificanotifica-tions in 2009, a peak in recent years).
• An outbreak oflymphogranuloma venereum (LGV), with 55 notifications reported in 2010, compared with four in 2009. All notifications were reported in men, and most were aged between 30 and 50 years. The number of notifications decreased during November and December 2010. The outbreak in NSW occurred in the global context of increased rates of LGV infection in Europe and North America amongst men who have sex with men. Timely surveillance, early recognition and treatment of this disease are important.
• A sustained increase in the number of chlamydia
notifications, with 18 103 notifications. This represents a 21% increase compared with 2009 when 14 872 notifications were reported. Cases were most commonly reported in women aged 20–29 years.
• An increase in the number ofgonorrhoeanotifications, with 2284 notifications. This represents a 39% increase compared with 2009 when 1638 notifications were reported. Cases were most common in men aged 20–39 years.
Overall, notifications of sexually transmissible infections (STIs) in NSW continue to rise. Chlamydia continues to be the most commonly notified STI in NSW. At least some of these increases are likely to be associated with increased screening and case detection.
Prevention activities
In 2010 in NSW, publicly funded sexual health clinics provided 23 900 occasions of services related to STI treatment, management and care. This is an increase of 4.3% compared with 2009. Services were provided to 12 513 clients, an increase of 4.1% compared with 2009.
In 2010, NSW Health led a national response to an increase in syphilis notifications amongst gay men and other men who have sex with men throughThe National Gay Men’s Syphilis Action Plan.3 The Plan aimed to achieve a sustained reduction in the incidence of infectious syphilis in Australian gay and homosexually active men by 2013. The Plan outlined a range of evidence-based interventions to inform prevention efforts.
In 2010, NSW Health commenced the second phase of the successful 2009 HIV and STI education campaign, Get Tested, Play Safe.4 The aim of the campaign was to reinforce STI awareness, increase testing, and improve safe sex behaviour among young people.
Enteric diseases (infectious, food and water) Notification data
There were 6665 notifications of enteric disease in 2010, a 27% increase compared with the average annual disease count for the previous 5 years. Highlights included: • A large increase in the number ofsalmonellosis
notifi-cations, with 3671 reported in 2010. This represents an increase of 60% compared with the annual average for the previous 5 years and is the largest number of notifications on record in NSW. The increase was in part explained by an ongoing increase of Salmonella enterica serovar Typhimurium PT 170 notifications. This increase has been observed nationally and is the subject of an ongoing investigation.
• A decrease in reports of probable outbreaks of
foodborne disease, with 59 notifications affecting over
728 people reported in 2010. This represents a 15% decline when compared with the 68 notifications affect-ing 903 people reported in 2009.
• A decrease in reports ofprobable outbreaks of viral
gastroenteritis in institutions, with 518 notifications
affecting 9386 people. This represents a 14% decline when compared with the 600 outbreaks affecting 11 769 people reported in 2009.
• Eleven point-source outbreaks ofSalmonella enterica
serovar Typhimuriummost likely associated with the
Prevention activities Food
NSW Health works with OzFoodNet nationally and the NSW Food Authority (NSWFA) locally to investigate and control Salmonella outbreaks and food contamination incidents.
In 2010, NSW Health and the NSWFA finalised the
Investigation of Foodborne Illness Response Protocol – Operations Procedures Manual.
With the Environmental Health Branch the Health Risk Policy Unit assessed a number of potential food contamina-tion issues for the NSWFA in 2010. Risk assessments were conducted for the following public health investigations: • High iodine content in soy milk products, resulting in
immediate recall of the product.
• Weight loss products, found to be toxic and harmful to the health of adults and children.
Drinking water
NSW Health is the public health regulator of the major water utilities through operating licences and memoranda of understanding (for Hunter Water Corporation, Sydney Water Corporation and Sydney Catchment Authority). In 2010 the Water Unit and PHUs worked with these utilities to:
• ensure compliance with relevant guidelines including the Australian Drinking Water Guidelines5 and the
Australian Guidelines for Water Recycling6
• undertake major projects including Sydney Water’s
Five-Year Drinking Water Quality Management Plan7
and theTen Year Review of the Sydney Water Inquiry8
• monitor the compliance of utilities with the NSW
Fluoridation of Public Water Supplies Act 1957.
The Water Unit and PHUs exercise public health oversight of more than 100 water utilities in regional NSW through the NSW Health Drinking Water Monitoring Program,9 which provides guidance on drinking water monitoring and is supported by NSW Health laboratories. In 2010 there was an improvement in regional sampling compli-ance with:
• 96% of expected microbiological samples taken, com-pared with 95% in 2009
• 100% of expected chemistry samples taken, up from 98% in 2009.
NSW Health is responsible for reviewing applications from private recycled water or drinking water suppliers for licences under the Water Industry Competition Act 2006.In 2010, the Water Unit and PHUs:
• reviewed six licence applications for recycled water • advised local councils and the NSW Office of Water on
more than 30 new and ongoing recycled water schemes regulated under theLocal Government Act 1993.
Respiratory disease (infectious and environmental) Notification data
Highlights in 2010 included:
• Notifications of pandemic (H1N1) 2009 influenza
decreased substantially in 2010 compared with the previous pandemic year. In 2010, notifications were most commonly reported in people aged 15–50 years. In total, 66 people were admitted to intensive care units for treatment and there were eight recorded deaths (although there are likely to be many more hospitalisa-tions and deaths associated with the infection that remained unrecognised).
• At the time of this report thetuberculosis (TB)data for 2010 remained incomplete, however preliminary analysis indicated that there was a decrease in both the overall number of TB notifications in 2010 (392 notifications) compared with 2009 (505 notifications), and the number of multi-drug resistant tuberculosis (MDR-TB) cases identified (five cases in 2010 and 10 in 2009).
• One case of extensively drug-resistant tuberculosis
(XDR-TB)was identified in a NSW resident who had
been treated previously for TB overseas. XDR-TB (TB that is resistant to isoniazid and rifampicin, plus resistant to any fluoroquinolone and at least one of three injectable second-line drugs) is a rare event in Australia and this is the second case identified.
• An overall decrease in the number of Legionnaires’
diseasenotifications with 85 reported in 2010 compared
with 94 in 2009. A slight increase in the number of notifications of Legionella pneumophila, with 35 reported in 2010 compared with 28 in 2009. Notifica-tions ofL. longbeachaewere lower in 2010 (42 notifica-tions) compared with 2009 (64 notificanotifica-tions).
Prevention activities Pandemic control activities
In 2010, NSW public health services continued to promote vaccination against pandemic (H1N1) 2009 influenza and to prepare for a possible second pandemic wave. A thorough review of the pandemic influenza response in 2009 led to the development of the following documents in 2010:
• Key recommendations on pandemic (H1N1) 2009 influ-enza.10This is a summary report of the principle lessons learned with recommendations for future pandemic planning and response.
• NSW Health influenza pandemic plan, Version 2.0.11 This is a major revision of the NSW pandemic plan for the health sector which acknowledges the need for greater flexibility in response options for pandemic influenza strains of varying severity. It also reinforces the key elements of pandemic influenza preparedness and response.
TB prevention and control activities
management services for persons identified with tubercu-losis and the general community.
Legionella control activities
In 2010 a statewide survey of cooling towers was under-taken to assess compliance with guidelines for testing of cooling towers forLegionella.
Vectorborne diseases Notification data
Highlights in 2010 included:
• The total number of notifications of vectorborne dis-eases in 2010 (1632 notifications) was similar to 2009 (1502 notifications). The most commonly notified vec-torborne disease in 2010 was Ross River Virus with 1052 notifications received, a 16% increase compared with 2009 (908 notifications), but a similar number to the median number of notifications for the years 2006– 2009 (1033 notifications).Barmah Forest Virus infec-tion was the second most commonly notified vector-borne disease (252 notifications), a decrease of 30% compared with 2009 (358 notifications), and a decrease of 55% compared with the median number of notifica-tions for the years 2006–2009 (554 notificanotifica-tions). • A 43% increase in the number ofdenguenotifications
with 194 notifications reported compared with 136 notifications in 2009. While there is no local transmis-sion of dengue in NSW, globally it is the most common mosquito-borne viral disease of humans and in recent years has become a major international public health concern. With increasing international travel and migration, mosquito-borne diseases such as dengue, malaria and chikungunya may become increasingly common among travellers returning to NSW.
Prevention activities
The Environmental Health Branch administers the NSW arbovirus surveillance program. This program encom-passes mosquito trapping and monitoring of virus activity in mosquito populations, and monitoring for antibody seroconversion of sentinel chicken flocks that are located in a number of strategic sites throughout rural NSW. The trapping and surveillance program is designed to cover the period of seasonal increase and decrease in the populations of the major arbovirus vectors, from spring to mid-autumn, and also to cover the period for natural activity and transmission of arbovirus infections.
Environmental exposures and risk assessment Air pollution
Air pollution arises from many sources including bush-fires, car engines, wood-burning heaters, power stations, mining and other industries. The Environmental Health Branch is involved in a range of activities to improve air
quality and in 2010 represented NSW Health in a multi-agency senior advisory group on coal mining. In collabo-ration with local PHUs, the Branch engaged in a number of activities to address concerns raised by the local commu-nity in relation to air quality associated with coal mining and power stations in the Upper Hunter Region. For example:
• Hunter New England Health Study,12 including ana-lysis of emergency department presentations, hospital separations, cancer and death register data
• Initiation of a cancer cluster investigation13and inde-pendent review that found the cluster was a chance occurrence
• The establishment of the Expert Advisory Committee on Air Pollution that found that there were indications that asthma may be a more important issue in the Upper Hunter region14
• An analysis of general practitioner presentations, treat-ments and diagnoses to examine the potential health effects of the mining industry and other exposures in Singleton, Muswellbrook and Denman.15
Major development assessment
Historically, mining activity has contributed to the pres-ence of lead in the environment of the Broken Hill community. In 2010, NSW Health evaluated the impact of the re-opening of the Broken Hill lead mine on commu-nity blood levels. An evaluation of the health risk assess-ment undertaken by the company was completed. The evaluation recommended that a program of blood lead monitoring be instituted as part of the mine’s conditions of approval.
In 2010, the Environmental Health Branch represented NSW Health in a multi-agency senior advisory group on coal-seam gas issues.
Aboriginal health Housing for Health
Housing for Health is an evidence-based housing repair and maintenance program that focuses on improving the safety and health of residents in those homes.16
• Since 1998, over 11 500 Aboriginal people living in 2771 houses in 72 Aboriginal communities have benefited from the Housing for Health program. • Approximately 70 000 items have been fixed that
spe-cifically relate to improved safety and health through the program.
In 2010 the Housing for Health program was involved in the following activities:
• Completion of projects in Glenn Innes, Toomelah/ Boggabilla, Narrabri/Wee Waa, Goodooga, Dorrigo, Tabulam and Tingha/Inverell.
• New projects in Bourke, Enngonia, Wilcannia and La Perouse.
• A trial project with the Aboriginal Housing Office Backlog Maintenance Program in Coffs Harbour.
The Aboriginal Communities Water and Sewerage Program
Clean water and functioning sewerage systems are a prerequisite for good health. Widespread availability of these essential services will improve outcomes by reducing communicable diseases such as skin infections and diar-rhoeal illness.
The Aboriginal Communities Water and Sewerage Program is a joint partnership between the NSW Govern-ment and the NSW Aboriginal Land Council.18 The Program aims to ensure adequate operation, maintenance and monitoring of water supplies and sewerage systems in more than 60 Aboriginal communities in NSW. NSW Health is involved in the development and roll-out of the Program across the state.
• 31 Aboriginal communities with a population of 3000 people are now receiving improved water and sewerage services. This includes 17 new communities in 2010, servicing a population of around 1800 people.
• PHUs are working with communities, the NSW Office of Water, local water utilities and service providers to implement Risk-Based Water and Sewerage Manage-ment Plans.
The Aboriginal Environmental Health Officer Training Program
The Aboriginal Environmental Health Officer Training Program aims to increase opportunities for workforce participation by Aboriginal people and enhance the involve-ment of Aboriginal people in improving environinvolve-mental health outcomes. Since 1998, 11 Aboriginal Environmental Health Officers have graduated from the Program. Six Aboriginal Environmental Health Officer Trainees were participating in the Program in 2010. The percentage of Aboriginal people employed within the NSW Health Envi-ronmental Health workforce increased from 0% in 1998 to over 17% in 2008.
Program activities
• In 2010, two new trainee positions were created under funding agreements between the Aboriginal Environ-mental Health Unit and the former area health services.
• One trainee position was created under an agreement between the Aboriginal Environmental Health Unit, the Sydney South West PHU and Camden Council. Nego-tiations are in place to expand the Program further.
Acknowledgments
Protecting the health of the community is a collaborative effort, involving public health units, clinicians, laboratory scientists, affected communities, and other government and community-based organisations. We thank all those involved for the role they played in NSW in 2010.
References
1. NSW Department of Health. Review of Hepatitis C Treatment and Care Services. Available from: http://www.health.nsw.gov. au/pubs/2008/080200_hep_c_report.html (Cited May 2011.)
2. Wilson D and Australian Government Department of Health and Ageing. Return on investment 2: evaluating the
cost-effectiveness of needle and syringe programs in Australia 2009. Available from: http://www.health.gov.au/internet/main/pub lishing.nsf/Content/needle-return-2 (Cited May 2011.)
3. STIGMA. The National Gay Men’s Syphilis Action Plan. 2009. Available from: http://stigma.net.au/resources/National_Gay_ Mens_Syphilis_Action_Plan.pdf (Cited May 2011.)
4. NSW Department of Health. Get Tested, Play Safe campaign. 2011. Available from: http://www.gettested.com.au/#/HOW% 20MANY%20PEOPLE%20HAVE%20YOU%20SLEPT%20 WITH?/ (Cited May 2011.)
5. National Health and Medical Research Council and Natural Resource Management Ministerial Council. Australian drinking water guidelines 6, 2004. Available from: http://www.nhmrc. gov.au/_files_nhmrc/file/publications/synopses/adwg_11_06. pdf (Cited May 2011.)
6. Natural Resource Management Ministerial Council; Environ-ment Protection and Heritage Council. Australian Health Min-isters’ Conference. Australian Guidelines for Water Recycling: Managing Health and Environmental Risks (Phase 1). 2006. Available from: http://www.ephc.gov.au/sites/default/files/ WQ_AGWR_GL__Managing_Health_Environmental_Risks_ Phase1_Final_200611.pdf (Cited June 2011.)
7. Sydney Water. Five-Year Drinking Water Quality Management Plan. 2010. Available from: http://www.sydneywater.com.au/ WaterQuality/FiveYearDrinkingWaterQualityManagement Plan/ (Cited May 2011.)
8. NSW Government. Ten Year Review of theSydney Water Inquiry.2010. Available from: http://210.247.145.33/Publica tions/FactSheets/McClellan_Review_-_Ten_year_review_-_NSW_Government_response_to_recommendations.pdf (Cited May 2011.)
9. NSW Department of Health. Drinking Water Monitoring Pro-gram. December 2005. Available from: http://www.health.nsw. gov.au/publichealth/environment/water/drinkwater_nsw.asp (Cited May 2011.)
11. NSW Department of Health. NSW Health influenza pandemic plan, Version 2.0. Available from: http://www.health.nsw.gov. au/policies/pd/2010/PD2010_052.html (Cited May 2011.)
12. NSW Department of Health. Respiratory and cardiovascular diseases and cancer among residents in the Hunter New England Area Health Service. Available from: http://www.health.nsw. gov.au/pubs/2010/pdf/HNE_Respi_Cardio_Disease.pdf (Cited May 2011.)
13. NSW Department of Health. Singleton cancer cluster investi-gation. Available from: http://www.health.nsw.gov.au/ resources/news/pdf/singleton_cancer.pdf (Cited May 2011.)
14. NSW Department of Health. Conclusion of the EAC on the findings of the General Practitioner data analysis for the Upper Hunter. Available from: http://www.health.nsw.gov.au/ PublicHealth/environment/air/apeac.asp (Cited May 2011.)
15. NSW Department of Health. Analysis of BEACH general practitioner encounter data to examine the potential health
effects of the mining industry and other exposures in Sin-gleton, Muswellbrook and Denman. Available from: http:// www.health.nsw.gov.au/pubs/2010/pdf/beach_report.pdf (Cited May 2011.)
16. NSW Department of Health. Housing for Health. Available from: http://www.health.nsw.gov.au/PublicHealth/environ ment/aboriginal/housing_health.asp (Cited May 2011.)
17. NSW Department of Health. Closing the Gap: 10 Years of Housing for Healthin NSW. An evaluation of a healthy housing intervention. Available from: http://www.health.nsw.gov.au/ pubs/2010/pdf/housing_health_010210.pdf (Cited May 2011.)
![Table 1.Disease notifications by year of onset of illness, NSW, 1993]2010](https://thumb-us.123doks.com/thumbv2/123dok_us/59137.2007562/2.595.45.541.89.701/table-disease-notifications-year-onset-illness-nsw.webp)