THE IMPACT OF DEVIATING FROM SET GUIDELINES AND PROCEDURES IN THE IMPLEMENTATION OF ROAD CONSTRUCTION PROJECTS
ROADS AUTHORITY - MALAWI
Name of the author: Isaac Kunkeyani
Submitted in partial fulfilment of the requirements for the degree of
MSC PROJECT MANAGEMENT
University of Bolton, Off Campus Division The University of Bolton
DECLARATION
DEDICATION
ACKNOWLEDGEMENT
First I would like to express my heartfelt gratitude to Dr. Easton Simenti-Phiri and Dr. Peter Ngoma my supervisors for their continuous guidance in the conducting of this research study.
I appreciate the encouragement Eng. Benjamin C Kapoteza gave me when I needed support and time to stay away from work.
I thank Pastor Wellington Thawatha for his spiritual support and encouragement when my feelings were low due to stress
ABSTRACT
Delay and cost overruns are common in construction projects and road construction projects in Malawi are not an exception (Yaw Frimpong, 2003). Road construction projects in Malawi have become a challenging activity to venture into due to uncertainty of whether payments for work done will be made on time for smooth running of the project. Public construction projects ought to be lucrative due to their sizes and availability of funding that they receive. However, in a situation where you have outstanding payments as huge as US$58,340,766 (Gala, 2014), and in a developing country, it is only clear that contractors working on these projects must be facing financial hardships. The aim of the research was to identify difficulties contractors are facing in view of the existing scenario. This was a quantitative descriptive study. Convenient sampling was used to obtain the sample size of 220. Self-administered structured questionnaire was used to collect data. A desk study of relevant secondary data was also done. The collected data was analysed using excel to obtain frequencies, percentages and mean.
The respondents included contractors, consultants and clients. Sixty-five percent of them had between 11 and 20 years of experience in the construction of roads. Only 7.7% (n=17) were registered engineers. The study revealed that 59% (n=144) of the respondents reported delayed payments as a factor that affected performance negatively. Eighty three percent (n=183) reported lack of skilled labour force.
LIST OF ABBREVIATIONS
ANRP Annual National Roads Programme
CEO Chief Executive Officer
ESIA Environmental and Social Impact Assessment
EU European Union
EVM Earned Value Management
FIDIC Internatinal Federation of Consulting Engineers
FY Financial Year
GDP Gross Domestic Product
GoM Government of Malawi
IT Information Technology
MGDS Malawi Growth Development Strategy
MoFEP&D Ministry of Finance, Economic Planning and Development MoT&PW Ministry of Transport and Public Works
MWK Malawi Kwacha
NCIC National Construction Industry Council ODPP Office of the Director of Public Procurement
PAP Project Acffected People
QMS Quality Management System
RA Roads Authority
RAP Relocation Action Plan
Table of Contents
DECLARATION...2
DEDICATION...3
ACKNOWLEDGEMENT...4
ABSTRACT...5
LIST OF TABLES...10
Table 5.2.1: Contractors project related difficulties...10
CHAPTER 1...11
1.0 Introduction...11
1.1 Background...12
1.2 Problem Statement...12
1.3 Significance of the Study...13
1.4 Aim of the Study...14
Chapter 2...15
2.1 Literature Review...15
2.1.1 Introduction...15
2.1.2 Delays in Project Delivery...15
2.1.3 Risks in Construction Projects...16
2.1.4 Contribution to Country Economy by Construction Sector...16
Chapter 3...18
3.0 Methodology...18
3.1 Introduction...18
3.3 Sampling Method and Sample Size...19
3.2.1 Our Problem...19
3.2.2 Solution...20
3.3 Instrument...21
3.4 Validity and Reliability...21
3.5 Ethical Considerations...22
3.6 Data Management and Analysis...22
Chapter 4...24
4.0 Findings of the Study...24
4.1. General Information...24
4.2 Consultants’ Responses...25
4.3 Contractors’ Responses...29
Table 4.3.1: Contractors project related difficulties...29
4.4 Clients’ Responses...33
4.5 Combined Responses...37
Table 4.5.3: Projects experiencing cost growths during implementation...40
4.6 Secondary Data...41
4.6.1 Audit of Public Arrears of the Road Sector In 2010...42
4.6.2 Audit of Public Arrears of the Road Sector In 2014...42
Table 4.5: Procurement methods used for contracting...42
Chapter 5...44
5.1 Discussions...44
5.2 Conclusions and recommendations...46
5.2.3 Projects experiencing cost growths during implementation...48
5.2.4 Absence of community ownership of projects...49
Bibliography...51
APPENDICES...53
APPENDIX A...53
PART I: FOR CONTRACTORS...53
PART II: FOR CLIENTS AND CONSULTANTS...54
PART III: FOR ALL RESPONDENTS...56
LIST OF TABLES
Table 1.1: Arrears for 2009/2010 to 2013/2014 Table 5.1.1: Contractors project related difficulties
Table 5.1.2: Failure to achieve quality expectations in projects
Table 5.1.3: Projects experiencing cost growth during implementation Table 5.1.4: Absence of community ownership
Table 5.2.1: Contractors project related difficulties
Table 5.2.2: Failure to achieve quality expectations in projects
Table 5.2.3: Projects experiencing cost growths during implementation Table 5.2.4: Absence of community ownership of projects
Table 5.3.1: Contractors project related difficulties
Table 5.3.2: Failure to achieve quality expectations in projects
Table 5.3.3: Projects experiencing cost growths during implementation Table 5.3.4: Absence of community ownership
Table 5.4.1: Contractors project related difficulties
Table 5.4.2: Failure to achieve quality expectations in projects
Table 5.4.3: Projects experiencing cost growths during implementation Table 5.4.4: Absence of community ownership
CHAPTER 1
1.0 Introduction
The road construction industry has been vibrant over the past ten years in Malawi. A major criticism facing the Malawi road construction projects is growing rate of delays in delivery of these projects. The problem of project delay is not unique to Malawi. In Nigeria, it was revealed that seven out of ten projects surveyed suffered delays in their execution (Aibinu, 2002). In addition Haseeb, (2011) affirmed that the delay in completion of construction projects is a worldwide problem.
Road transport constitutes more than 70% of cargo transported in Malawi in which both motorised and non-motorised transports are used, (Siwande, 2011).As stipulated in the Malawi Growth Development Strategy (MGDS), roads are a development catalyst since they provide means by which goods are transported from one part of a world to another. In addition, the 2011-2016 Roads Authority Five Years Strategic and Business Plan states that in medium term, efforts will be made in improving mobility and accessibility of the population to key road corridors within and out of Malawi. This would facilitate the improved mobility and accessibility of rural communities to goods and services at low cost. However, road construction is an investment that requires heavy capital.
project performance in order to minimise or avoid delay and cost problems on construction projects.
1.1 Background
The road network in Malawi continued to deteriorate due to lack of adequate maintenance during the period beginning mid 1990’s to 2005. However, through Road Maintenance Initiative study conducted between 1995 and 1997, financed by the European Union (EU), the National Roads Authority was established under an Act of Parliament. This organisation was mandated to collect funds for the purpose of road maintenance, and to use such funds in the implementation of the maintenance activities. This resulted in realisation of relatively more funds dedicated to road maintenance than was the case before, and the condition of the road network began to improve. However, due to the backlog of road maintenance that existed, these funds were only sufficient for maintenance activities other than upgrading.
In 2005, the government benefited from debt relief, such that all the debts that the country was servicing were cancelled. This resulted in the realisation of more funds in the GoM treasury to the extent that several projects could be implemented adequately. In the roads sector, it was decided that some roads which lead to important facilities such as hospitals, but were still earth/gravel surfaced should be gradually upgraded to bituminous surface to make them all season roads. This proved to be a very good indicator for the performance of the government from the perspective of the stakeholders. As a result, road projects that were planned to upgrade five kilometres were extended under political influence to several tens of kilometres, and the durations of the projects were accordingly extended. Eventually the monthly bill for payment of such projects escalated to levels where government could not cope.
1.2 Problem Statement
Despite GoM making efforts to reduce arrears which were revealed to stand at MWK
how the arrears would be cleared so that contractors and consultants would be able to
perform. Despite measures put in place to reverse the situation, the bill has continued to
rise to MWK27.42 billion by 30th June 2014. This is equivalent to US$58.34 million using
a conversion rate of US$ 1.00 to MWK 470.00 prevailing at the time. This was followed
and the arrears were being reduced gradually. However, since the projects were live,
there was accumulation of amounts to be paid to the contractors and consultants at the
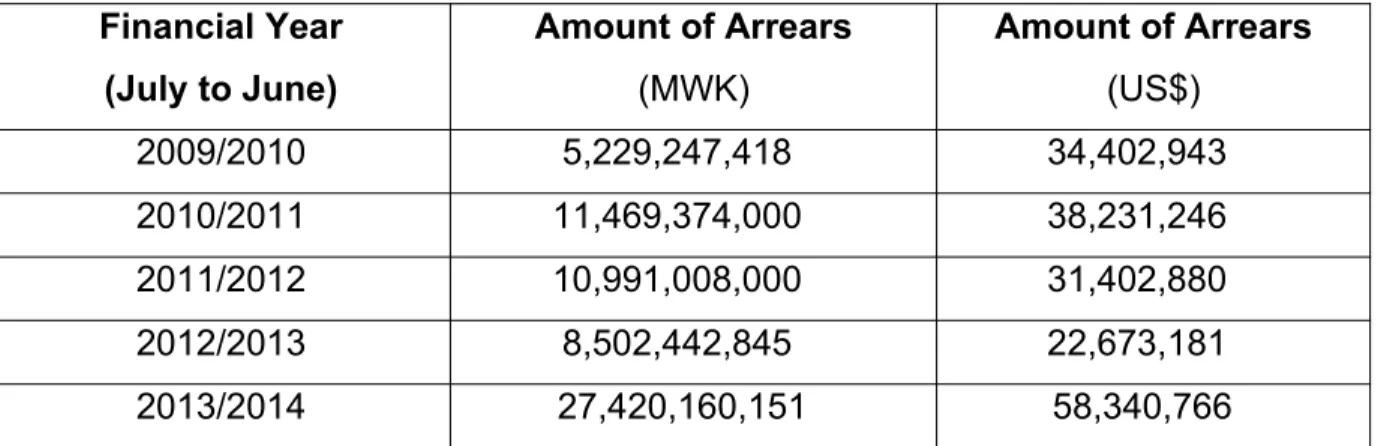
end of each month. Table 1.1 illustrates the situation that prevailed over the years up to
30th June 2014. The Financial Year (FY) in Malawi starts on 1st July and ends on 30th
June.
Table 1.2: Arrears for 2009/2010 to 2013/2014 Financial Year
(July to June)
Amount of Arrears (MWK)
Amount of Arrears (US$)
2009/2010 5,229,247,418 34,402,943
2010/2011 11,469,374,000 38,231,246
2011/2012 10,991,008,000 31,402,880
2012/2013 8,502,442,845 22,673,181
2013/2014 27,420,160,151 58,340,766
1.3 Significance of the Study
The results of this study will assist implementers of road construction projects to develop more effective strategies to adhere to existing guidelines, so that it facilitates improved mobility and accessibility of rural communities to goods and services at low cost. Since there is dearth of information on the impact of deviating from set guidelines in Malawi the results of this study will provide baseline information for further research so as to improve mobility and accessibility of the population to areas of importance. It is hoped that after the study, the recommendations made will be adopted by policy makers to avoid such trends continuing in the future.
1.4 Aim of the Study
The aim of the research is to explore GoM accumulated huge outstanding bills to be paid to contractors and consultants engaged in road construction projects over the period 2007-2014.
1.5 Specific Objectives
The specific objectives
were:-1) To review projects that were implemented or are being implemented by the Roads Authority since 2007 to 2014, including those that are ongoing.
2) To determine to what extent the implementation of these projects adhered to laid down guidelines for project implementation at Roads Authority
Chapter 2
2.1 Literature Review
2.1.1 Introduction
This section presents a review of studies that have been done in relation to the construction industry and public institutions performance. The selected literature was taken because it explains issues that are similar to the study being undertaken (construction of roads) and the set up of the institution (public institution). Fisher, (2010) explains that the first step in literature review involves identifying the different fields of literature that may be appropriate to the study without, at this stage, looking at any of it in detail. So, this means a collection of books, journals and papers that deal with the same issues and that respond to each other in the developing debates mapping and describing the literature about a topic.
2.1.2 Delays in Project Delivery
The problem of delays in the construction industry is a global phenomenon (Sambasivan & Soon, 2007). The magnitudes vary considerably depending on the economy of the country and training of the players. In Nigeria, a major criticism to the construction industry, at least in the early 1990’s, was delays in project delivery, (Aibinu, 2002). In Saudi Arabia, it was found that only 30% of construction projects were completed within the scheduled completion dates. It was also established that the average time overrun was between 10% and 30%, (Assaf, 2006). González, (2013) reported that to stay on top or compete with large organizations, today’s construction organizations need to run their projects within scope, time and cost in the midst of crises and uncertainty to achieve their strategic objectives and vision. According to the author’s observations, in a country where factors that contribute to project delivery delays; such as delayed payments, incomplete design details and variation orders, it is unlikely that construction organisations operating under these conditions would prosper.
He argues that delays can lead to considerable effects such as lawsuits between clients and contractors, loss of productivity and revenue, and contract termination.
2.1.3 Risks in Construction Projects
A broad range of the project management literature points to early warning signals through the treatment of risk management as one important part of the field’s toolbox (Haji-Kazemi, 2013). In addition, Haji-Kazem states that the choice of approach in a given project will be up to the direction of the project management team, in order to exploit as many early warning signs as possible and timely enough to be able to take preventive actions. Sociologists such as Beck and Giddens have argued that in modern society risk has increasingly become central to all aspects of human affairs; that we live in a ‘risk society’ where deliberation about social, economic, political and environmental issues is bound to fail if it does not take risk into account (Flyvbjerg, 2003). An examination of failed Information Technology (IT) projects reveals that long before the failure there were significant symptoms or “early warning signs” (Keppelman, 2006).
Another concept found in literature is that of “earned value management” (EVM). The earned value project management method integrates three critical elements of project management; thus, scope management, cost management and time management (Anbari, 2003). If the scope is not managed well, chances are that it will increase to levels where the cost will increase beyond the budget. In addition it will also entail increasing the implementation time if acceleration costs may not be allowed. However, if earned value management is applied it will be possible at any stage to calculate earned value for individual break down structures by measuring achieved performance against planned performance. Necessary adjustments can be made based on the values of earned value calculated.
2.1.4 Contribution to Country Economy by Construction Sector
Firstly, it is believed that it contributes significantly to the increase of the gross domestic product (GDP). Secondly, it uses unskilled labour intensively (in countries where construction projects are labour intensive), providing a positive effect on employment rates. Thirdly, it interacts with other industries, thereby fostering economic activity. According to the author’s observation, in large road construction projects most of the labour that benefits from their existence are skilled labourers such as artisans, truck drivers, plant operators and materials technicians. This is so because the projects are generally equipment intensive. In Malaysia’s the Construction Sector is one of the important sectors that contribute to its economic growth. The sector accounted for nearly 3.3% of GDP in the year 2005 and employed about 600,000 workers including 109,000 foreign workers (Sambasivan, 2007)
Summary
Chapter 3
3.0 Methodology
3.1 Introduction
This chapter describes the study design, sample and sampling method, instrument, data collection method, data analysis and ethical consideration. This is a quantitative descriptive study. The aim of the research is to explore GoM accumulated huge outstanding bills to be paid to contractors and consultants engaged in road construction projects. The researcher used structured questionnaires to gather information on road construction projects from the key players in road construction industry as clients, consultants or contractors. A desk review was also done on documents that had information on progress of the road construction projects.
3.2 Inclusion Criteria
For the client, members involved directly to a considerable degree in the implementation of such projects were targeted. These included people from the Roads Authority, Roads Fund Administration, Ministry of Transport and Public Works (MoT&PW) and Ministry of Finance, Economic Planning and Development (MoFEP&D). It included engineers, economists, accountants and administrators.
Respondents from the contractors were mostly technical, although a few were finance people. The technical respondents included engineers and technicians, those that were directly involved with the management of construction projects at various levels, and would give informed opinions on the subject.
3.3 Sampling Method and Sample Size
In order to make sure that the research findings may be relied, it is necessary to calculate a sample size that if used, can represent the population under consideration and collect data from the smaller size grouping (Mark Saunders, 2009). Accordingly, the sample size was determined as
Sample size
Where n is the sample size
Z /2 is half the difference between sample size and confidence level.
E is the standard error and
is the standard deviation
This formula can be used when is known and you want to determine the sample size
necessary to establish, with a confidence of , the mean value to within . You can still use this formula if you don’t know your population standard deviation and you have a small sample size. Although it’s unlikely that you know when the population mean is not known, you may be able to determine from a similar process or from a pilot test/simulation.
3.2.1 Our Problem
We would like to establish an unknown problem, that of road construction projects which are started and take too long to finish, with GoM continually accumulating a huge bill of arrears in payments due to contractors and consultants. However, we want the confidence level of our survey to be 95 percent sure that the sample mean is within 1
3.2.2 Solution
We are solving for the sample size .
A 95% degree confidence corresponds to = 0.05. Each of the shaded tails in the
figure below has an area of = 0.025. The region to the left of and to the right of = 0 is 0.5 – 0.025, or 0.475. In the table of the standard normal ( ) distribution, an area
of 0.475 corresponds to a value of 1.96. The critical value is therefore = 1.96.
Figure 1: Normal Distribution Curve
The margin of error = 1 and the standard deviation = 6.95. Using the formula for sample size, we can calculate :
3.3 Instrument
The research instrument was developed based on study objective and construction standard guideline. The construction standard guidelines stipulate standard specifications to be used, conditions of contract that will be used, construction design drawings that guide the contractors when tendering and carrying construction work. The instrument was divided into five parts. Part A obtained general information about the respondents which included age, personal experience in road construction, gender and academic & professional qualifications. Part B obtained information about contractor’s project related difficulties, Part C, Achievement of quality expectations, Part D, Project experiencing growths during implementation, Part E, absence of community ownership of projects, Part F, was a request for general comments with regards to interventions that could improve the implementation of road construction projects in Malawi and Part G, was request for comments with regard to the barriers in the implementation of road construction projects in Malawi, (See Appendix A).
3.4 Validity and Reliability
Validity is concerned with the extent to which the instrument reflects the phenomenon being examined and addresses the appropriateness, meaningfulness, and usefulness of specific conclusion drawn from instrument scores (Burns & Grove, 2009). In order to ensure content validity, the research instrument was reviewed by research experts to establish whether the content being asked was accurate to obtain the desired information. Reliability refers to the accuracy and consistency of information obtained in a study (Polit & Beck, 2008).
3.5 Ethical Considerations
The research instrument was first approved by the research supervisor before it was
used. The respondents were provided with detailed information regarding the research
and their consent was obtained (See Appendix C). Respondents were told that they had
the right to refuse to participate in the study. Their refusal to participate in the study
would not risk their job in anyway. They were free to withdraw from the study at any
point. Respondents were assured of privacy and confidentiality. All data was stored
under lock.
factors that affect performance of contractors Secondary data was analysed done using survey questionnaire questions and use of secondary data. As the research was focusing on why GoM had accumulated such a huge arrears bill as shown in Table 1.1, and what could be done to get out of the deficit pit, secondary data was also considered to be vital, as it would provide factual information on the ground. The secondary data consisted of reports obtained from the implementing agency in the road construction projects and independent reports compiled through a studies conducted with funding from the EU.
The questionnaires were initially prepared for two groups, namely staff from the client’s side and contractors representatives. Eventually it was considered necessary to include one to be given to consultants involved in the design and construction supervision of the road projects, as they might give different opinions from those given by clients and contractors. The difference in the presentation of these questionnaires was only in the introductory section; otherwise the pertinent questions were the same; thus obtaining similar information from all three groups of people.
3.6 Data Management and Analysis
Data were entered and analysed using excel spreadsheet. The descriptive statistics such as frequencies, percentages and mean were calculated to describe the respondents’ perception of the factors affecting performance of contractors. The results are presented in tables in the “Findings” section – Chapter 4.
Chapter 4
4.0 Findings of the Study
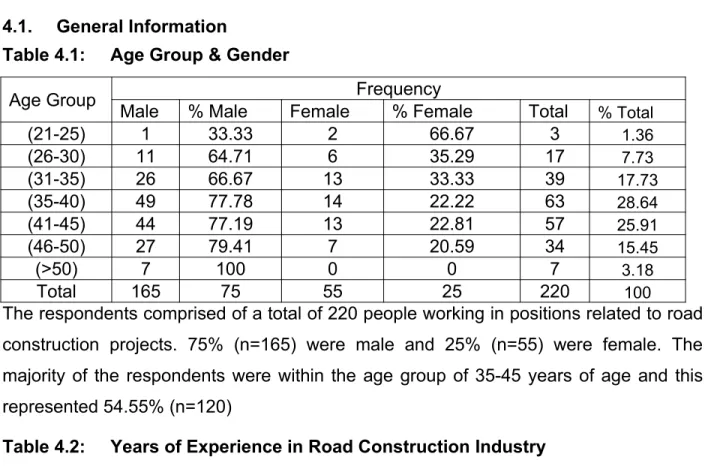
4.1. General Information
Table 4.1: Age Group & Gender
Age Group Frequency
Male % Male Female % Female Total % Total
(21-25) 1 33.33 2 66.67 3 1.36
(26-30) 11 64.71 6 35.29 17 7.73
(31-35) 26 66.67 13 33.33 39 17.73
(35-40) 49 77.78 14 22.22 63 28.64
(41-45) 44 77.19 13 22.81 57 25.91
(46-50) 27 79.41 7 20.59 34 15.45
(>50) 7 100 0 0 7 3.18
Total 165 75 55 25 220 100
The respondents comprised of a total of 220 people working in positions related to road construction projects. 75% (n=165) were male and 25% (n=55) were female. The majority of the respondents were within the age group of 35-45 years of age and this represented 54.55% (n=120)
Table 4.2: Years of Experience in Road Construction Industry Years of Experience in Road Construction Industry
(1-5) (6-10) (11-15) (16-20) >20 N
Frequency 16 43 91 53 17 220
% 7.27 19.55 41.36 24.09 7.73 100
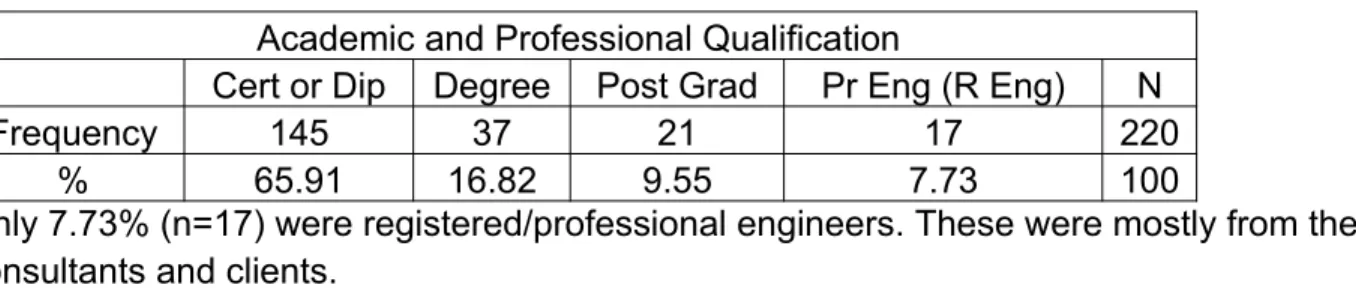
Table 4.3: Academic and Professional Qualification Academic and Professional Qualification
Cert or Dip Degree Post Grad Pr Eng (R Eng) N
Frequency 145 37 21 17 220
% 65.91 16.82 9.55 7.73 100
Only 7.73% (n=17) were registered/professional engineers. These were mostly from the consultants and clients.
4.2 Consultants’ Responses
Table 4.2.1: Contractors project related difficulties
U Minor...Major
M e an S co re R an ki n g
Factor 0 1 2 3 4 5
1.1 Delayed payments by the client Frequency 20 0 0 0 0 0 20 5 1
1.2 Contractor’s cash flow problems Frequency 20 0 0 0 0 1 19 4.95 3
1.3 Lack of access to credit facilities Frequency 20 0 0 0 0 1 19 4.95 3
1.4 Shortage of skilled labour force in themarket Frequency 20 0 0 0 0 0 20 5 1
1.5 Lack of professional management skills bycontractor staff Frequency 20 0 0 0 6 3 11 4.25 7
1.6 Delayed instructions from the consultant Frequency 20 0 1 7 6 6 0 2.85 8
1.7 Incomplete contract documentation Frequency 20 0 13 3 4 0 0 1.55 9
1.8 Unavailability of plant and equipment in themarket Frequency 20 0 0 0 0 3 17 4.85 4
1.9 Inclement weather Frequency 20 0 20 0 0 0 0 1 10
1.10 Bureaucracy from government agencies Frequency 20 0 0 0 1 1 18 4.85 4
Average 3.93
deal with issues on site professionally, which apparently has not been satisfying to the site supervision team. This table and all the others to follow were worked in excel for easy calculation of the mean and average scores based on the pattern of respondents.
Table 4.2.2: Failure to achieve quality expectations in projects
U Minor...Major
M
e
an
S
co
re
R
an
ki
n
g
Factor 0 1 2 3 4 5
2.1 Shortage of skilled labour force in themarket Frequency 20 0 0 2 1 4 13 4.4 4
2.2 No quality management systems (QMS) bycontractors Frequency 20 0 1 2 1 3 13 4.25 5
2.3 Non standardised specifications Frequency 20 0 17 1 2 0 0 1.25 8
2.4 Lack of technical skills by consultant’s sitestaff Frequency 20 0 0 0 2 12 6 4.2 6
2.5 Usage of lowest price tender method ofcontract procurement Frequency 20 0 0 0 1 2 17 4.8 2
2.6 High levels of corruption Frequency 20 0 4 13 3 0 0 1.95 7
2.7 Mistakes and discrepancies in contractdocument Frequency 20 0 0 0 4 2 14 4.5 3
2.8 Contract duration too long (≥ 3 years) Frequency 20 0 0 0 0 3 17 4.85 1
2.9 Shortened contract durations Frequency 20 0 18 2 0 0 0 1.1 9
2.10 Scarcity of materials meeting contractspecifications (gravel / quarry stone) Frequency 20 0 18 2 0 0 0 1.1 9
Average 3.24
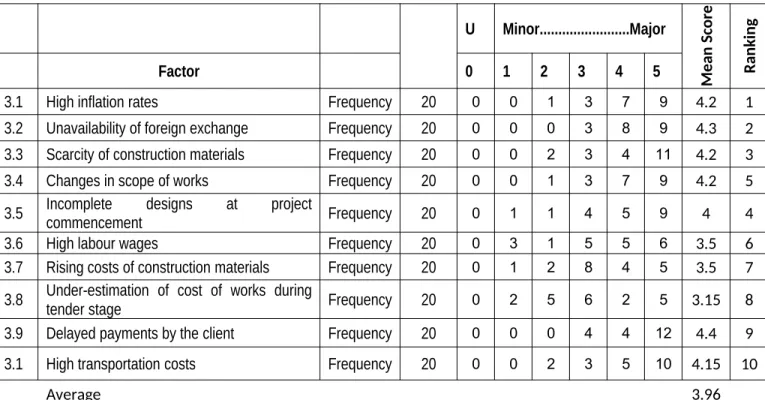
Table 4.2.3: Projects experiencing cost growth during implementation
U Minor...Major
M
e
an
S
co
re
R
an
ki
n
g
Factor 0 1 2 3 4 5
3.1 High inflation rates Frequency 20 0 0 1 3 7 9 4.2 1
3.2 Unavailability of foreign exchange Frequency 20 0 0 0 3 8 9 4.3 2
3.3 Scarcity of construction materials Frequency 20 0 0 2 3 4 11 4.2 3
3.4 Changes in scope of works Frequency 20 0 0 1 3 7 9 4.2 5
3.5 Incomplete designs at projectcommencement Frequency 20 0 1 1 4 5 9 4 4
3.6 High labour wages Frequency 20 0 3 1 5 5 6 3.5 6
3.7 Rising costs of construction materials Frequency 20 0 1 2 8 4 5 3.5 7
3.8 Under-estimation of cost of works duringtender stage Frequency 20 0 2 5 6 2 5 3.15 8
3.9 Delayed payments by the client Frequency 20 0 0 0 4 4 12 4.4 9
3.1 High transportation costs Frequency 20 0 0 2 3 5 10 4.15 10
Average 3.96
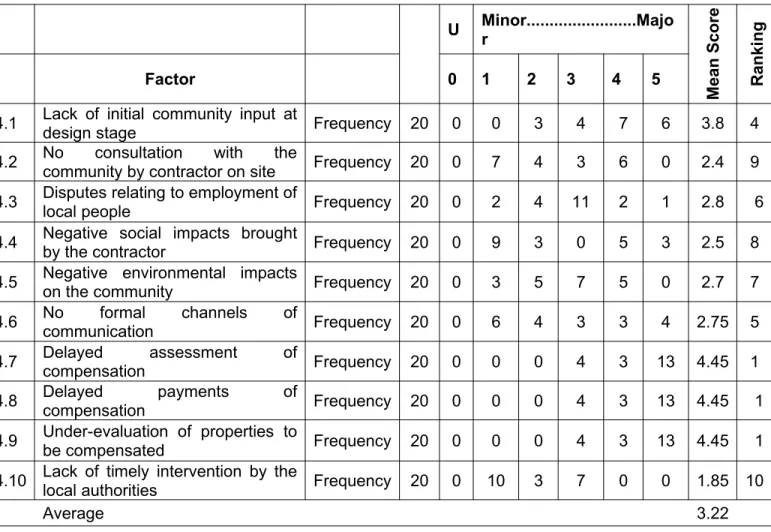
Table 4.2.4: Absence of community ownership U Minor...Majo r M ea n S co re R an ki n g
Factor 0 1 2 3 4 5
4.1 Lack of initial community input atdesign stage Frequency 20 0 0 3 4 7 6 3.8 4 4.2 No consultation with the
community by contractor on site Frequency 20 0 7 4 3 6 0 2.4 9 4.3 Disputes relating to employment of
local people Frequency 20 0 2 4 11 2 1 2.8 6
4.4 Negative social impacts broughtby the contractor Frequency 20 0 9 3 0 5 3 2.5 8 4.5 Negative environmental impactson the community Frequency 20 0 3 5 7 5 0 2.7 7 4.6 No formal channels of
communication Frequency 20 0 6 4 3 3 4 2.75 5
4.7 Delayed assessment of
compensation Frequency 20 0 0 0 4 3 13 4.45 1
4.8 Delayed payments of
compensation Frequency 20 0 0 0 4 3 13 4.45 1
4.9 Under-evaluation of properties to
be compensated Frequency 20 0 0 0 4 3 13 4.45 1
4.10 Lack of timely intervention by the
local authorities Frequency 20 0 10 3 7 0 0 1.85 10
Average 3.22
4.3 Contractors’ Responses
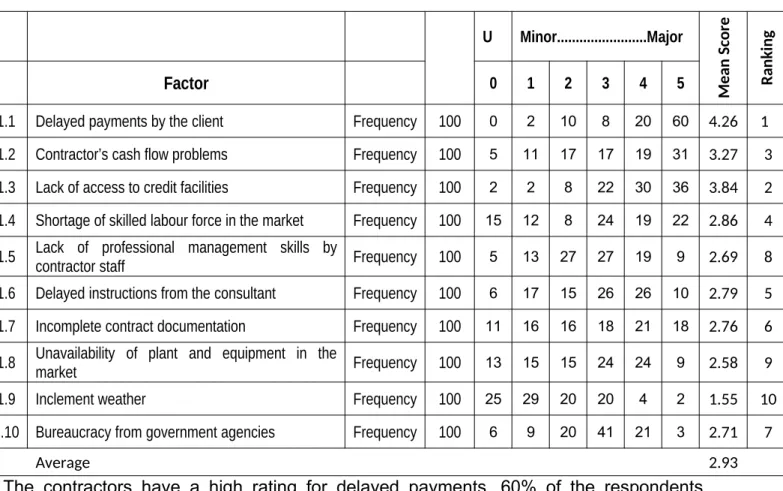
Table 4.3.1: Contractors project related difficulties
U Minor...Major
M
e
an
S
co
re
R
an
ki
n
g
Factor 0 1 2 3 4 5
1.1 Delayed payments by the client Frequency 100 0 2 10 8 20 60 4.26 1
1.2 Contractor’s cash flow problems Frequency 100 5 11 17 17 19 31 3.27 3
1.3 Lack of access to credit facilities Frequency 100 2 2 8 22 30 36 3.84 2
1.4 Shortage of skilled labour force in the market Frequency 100 15 12 8 24 19 22 2.86 4
1.5 Lack of professional management skills bycontractor staff Frequency 100 5 13 27 27 19 9 2.69 8
1.6 Delayed instructions from the consultant Frequency 100 6 17 15 26 26 10 2.79 5
1.7 Incomplete contract documentation Frequency 100 11 16 16 18 21 18 2.76 6
1.8 Unavailability of plant and equipment in themarket Frequency 100 13 15 15 24 24 9 2.58 9
1.9 Inclement weather Frequency 100 25 29 20 20 4 2 1.55 10
1.10 Bureaucracy from government agencies Frequency 100 6 9 20 41 21 3 2.71 7
Average 2.93
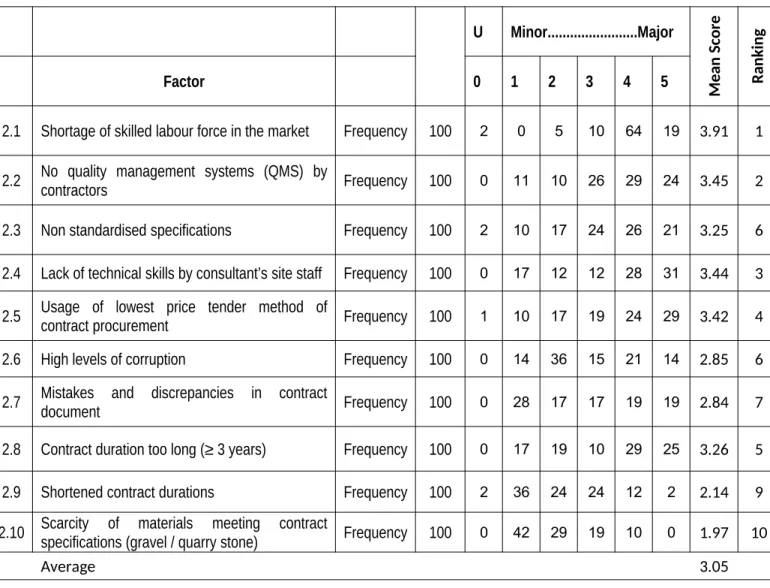
Table 4.3.2: Failure to achieve quality expectations in projects
U Minor...Major
M
e
an
S
co
re
R
an
ki
n
g
Factor 0 1 2 3 4 5
2.1 Shortage of skilled labour force in the market Frequency 100 2 0 5 10 64 19 3.91 1
2.2 No quality management systems (QMS) bycontractors Frequency 100 0 11 10 26 29 24 3.45 2
2.3 Non standardised specifications Frequency 100 2 10 17 24 26 21 3.25 6
2.4 Lack of technical skills by consultant’s site staff Frequency 100 0 17 12 12 28 31 3.44 3
2.5 Usage of lowest price tender method ofcontract procurement Frequency 100 1 10 17 19 24 29 3.42 4
2.6 High levels of corruption Frequency 100 0 14 36 15 21 14 2.85 6
2.7 Mistakes and discrepancies in contractdocument Frequency 100 0 28 17 17 19 19 2.84 7
2.8 Contract duration too long (≥ 3 years) Frequency 100 0 17 19 10 29 25 3.26 5
2.9 Shortened contract durations Frequency 100 2 36 24 24 12 2 2.14 9
2.10 Scarcity of materials meeting contractspecifications (gravel / quarry stone) Frequency 100 0 42 29 19 10 0 1.97 10
Average 3.05
desired in the construction industry. If these can be enhanced with appropriate material, the problem of shortage of skilled labour may be alleviated.
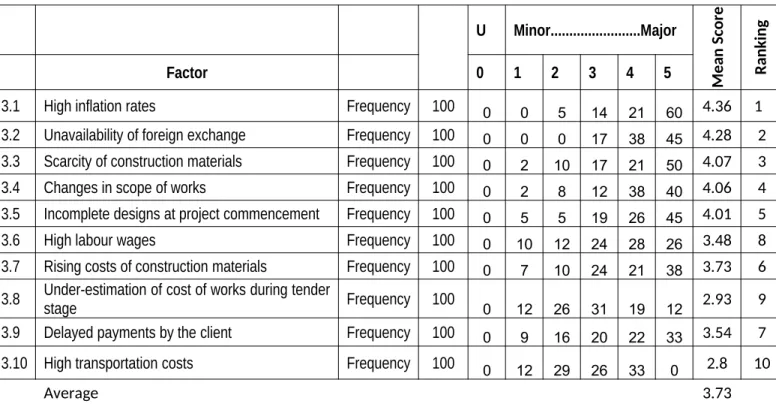
Table 4.3.3: Projects experiencing cost growths during implementation
U Minor...Major
M
e
an
S
co
re
R
an
ki
n
g
Factor 0 1 2 3 4 5
3.1 High inflation rates Frequency 100 0 0 5 14 21 60 4.36 1
3.2 Unavailability of foreign exchange Frequency 100 0 0 0 17 38 45 4.28 2
3.3 Scarcity of construction materials Frequency 100 0 2 10 17 21 50 4.07 3
3.4 Changes in scope of works Frequency 100 0 2 8 12 38 40 4.06 4
3.5 Incomplete designs at project commencement Frequency 100 0 5 5 19 26 45 4.01 5
3.6 High labour wages Frequency 100 0 10 12 24 28 26 3.48 8
3.7 Rising costs of construction materials Frequency 100 0 7 10 24 21 38 3.73 6
3.8 Under-estimation of cost of works during tenderstage Frequency 100
0 12 26 31 19 12 2.93 9
3.9 Delayed payments by the client Frequency 100 0 9 16 20 22 33 3.54 7
3.10 High transportation costs Frequency 100 0 12 29 26 33 0 2.8 10
Average 3.73
Table 4.3.4: Absence of community ownership of projects
U Minor...Major
M
e
an
S
co
re
R
an
ki
n
g
Factor 0 1 2 3 4 5
4.1 Lack of initial community input at design stage Frequency 100 7 7 6 26 33 21 3.34 3
4.2 No consultation with the community bycontractor on site Frequency 100
5 7 24 7 19 38 3.42 1
4.3 Disputes relating to employment of local people Frequency 100 5 11 5 19 36 24 3.42 1
4.4 Negative social impacts brought by thecontractor Frequency 100
7 5 17 21 29 21 3.23 4
4.5 Negative environmental impacts on thecommunity Frequency 100
5 10 26 14 24 21 3.05 5
4.6 No formal channels of communication Frequency 100 0 19 21 26 10 24 2.99 6
4.7 Delayed assessment of compensation Frequency 100 0 24 19 33 12 12 2.69 7
4.8 Delayed payments of compensation Frequency 100 2 21 24 34 12 7 2.54 8
4.9 Under-evaluation of properties to becompensated Frequency 100
2 35 19 24 10 10 2.35 9
4.10 Lack of timely intervention by the localauthorities Frequency 100
2 31 33 19 10 5 2.19 10
Average 2.92
4.4 Clients’ Responses
Table 4.4.1: Contractors project related difficulties
U Minor...Major
M
e
an
S
co
re
R
an
ki
n
g
Factor 0 1 2 3 4 5
1.1 Delayed payments by the client Frequency 100 0 2 20 20 8 50 3.84 1
1.2 Contractor’s cash flow problems Frequency 100 5 11 17 17 19 31 3.27 3
1.3 Lack of access to credit facilities Frequency 100 2 8 3 29 30 28 3.61 2
14 Shortage of skilled labour force in the market Frequency 100 15 12 8 24 19 22 2.86 4
1.5 Lack of professional management skills bycontractor staff Frequency 100 5 13 27 27 19 9 2.69 5
1.6 Delayed instructions from the consultant Frequency 100 6 17 26 26 15 10 2.57 6
1.7 Incomplete contract documentation Frequency 100 11 21 18 18 16 16 2.55 7
1.8 Unavailability of plant and equipment in themarket Frequency 100 13 15 24 24 15 9 2.4 8
1.9 Inclement weather Frequency 100 25 29 20 20 4 2 1.55 9
1.10 Bureaucracy from government agencies Frequency 100 41 20 20 10 6 3 1.29 10
Average 2.66
Table 4.4.2: Failure to achieve quality expectations in projects
U Minor...Major
M
e
an
S
co
re
R
an
ki
n
g
Factor 0 1 2 3 4 5
2.1 Shortage of skilled labour force in the market Frequency 100 2 0 10 5 19 64 4.31 1
2.2 No quality management systems (QMS) bycontractors Frequency 100 0 12 10 23 26 29 3.5 2
2.3 Non standardised specifications Frequency 100 2 10 17 24 26 21 3.25 3
2.4 Lack of technical skills by consultant’s site staff Frequency 100 10 17 12 18 12 31 2.98 5
2.5 Usage of lowest price tender method of contractprocurement Frequency 100 2 10 23 19 29 17 3.14 4
2.6 High levels of corruption Frequency 100 5 14 10 36 21 14 2.96 6
2.7 Mistakes and discrepancies in contract document Frequency 100 0 28 17 17 19 19 2.84 7
2.8 Contract duration too long (≥ 3 years) Frequency 100 0 25 19 29 10 17 2.75 8
2.9 Shortened contract durations Frequency 100 2 36 24 24 12 2 2.14 9
2.10 Scarcity of materials meeting contractspecifications (gravel / quarry stone) Frequency 100 0 42 29 19 10 0 1.97 10
Average 2.98
Table 4.4.3: Projects experiencing cost growths during implementation
U Minor...Major
M
e
an
S
co
re
R
an
ki
n
g
Factor 0 1 2 3 4 5
3.1 High inflation rates Frequency 100 0 0 5 14 21 60 4.36 1
3.2 Unavailability of foreign exchange Frequency 100 0 0 0 17 45 38 4.21 2
3.3 Scarcity of construction materials Frequency 100 0 2 10 17 21 50 4.07 3
3.4 Changes in scope of works Frequency 100 2 2 8 12 38 38 3.96 5
3.5 Incomplete designs at project commencement Frequency 100 0 5 5 19 26 45 4.01 4
3.6 High labour wages Frequency 100 0 10 12 24 28 26 3.48 6
3.7 Rising costs of construction materials Frequency 100 0 7 10 38 21 24 3.45 7
3.8 Under-estimation of cost of works during tenderstage Frequency 100 0 12 26 31 19 12 2.93 8
3.9 Delayed payments by the client Frequency 100 2 14 21 31 22 10 2.87 9
3.10 High transportation costs Frequency 100 0 29 33 26 12 0 2.21 10
Average 3.56
prices vary from their original values either upwards or downwards, the calculated price escalation factor is less than one or greater than one.
Table 4.4.4: Absence of community ownership
U Minor...Major M e an S co re R an ki n g
Factor 0 1 2 3 4 5
4.1 Lack of initial community input at design stage Frequency 100 7 7 6 21 26 33 3.51 3
4.2 No consultation with the community by contractoron site Frequency 100
5 7 19 7 24 38 3.52 2
4.3 Disputes relating to employment of local people Frequency 100 5 11 5 19 24 36 3.54 1
4.4 Negative social impacts brought by the contractor Frequency 100 7 5 17 29 21 21 3.15 5
4.5 Negative environmental impacts on thecommunity Frequency 100
5 10 14 26 24 21 3.17 4
4.6 No formal channels of communication Frequency 100 0 19 21 26 24 10 2.85 7
4.7 Delayed assessment of compensation Frequency 100 0 12 19 33 24 12 3.05 6
4.8 Delayed payments of compensation Frequency 100 2 21 34 24 12 7 2.44 9
4.9 Under-evaluation of properties to becompensated Frequency 100
2 19 35 24 10 10 2.51 8
4.10 Lack of timely intervention by the local authorities Frequency 100 2 31 33 19 10 5 2.19 10
Average 2.99
The clients perceive community ownership of road construction projects as an important factor in enhancing its performance. Probably this is because vandalise parts of the road infrastructure. During the month of January 2015, several roads had some sections washed away. On following up to repair the damages, it was found that metal pipe culverts had been stolen during the dry season. When the rain came, the fill under the bituminous paved road collapsed. Such cases make the clients staff view lack of ownership of the roads by the communities where this occurs. There is also encroachment into the road reserve by way of cultivating crops; right in the side drains of the roads.
be worth relying upon. Thus, the three sets of respondents were again merged, giving a total sample size of 220 which is higher than the calculated sample size of 186.
4.5 Combined Responses
The first group of factors to be assessed related to difficulties contractors encounter as they execute construction projects.
Table 4.5.1: Contractors project related difficulties
U Minor...Major
M
e
an
S
co
re
R
an
ki
n
g
Factor 0 1 2 3 4 5
1.1 Delayed payments by the client Frequency 220 0 4 30 28 28 130 4.14 1
1.2 Contractor’s cash flow problems Frequency 220 10 22 34 34 39 81 3.42 3
1.3 Lack of access to credit facilities Frequency 220 4 10 11 51 61 83 3.84 2
1.4 Shortage of skilled labour force in the market Frequency 220 30 24 16 48 38 64 3.05 4
1.5 Lack of professional management skills by
contractor staff Frequency 220 10 26 54 60 41 29 2.83 5 1.6 Delayed instructions from the consultant Frequency 220 12 35 48 58 47 20 2.7 6
1.7 Incomplete contract documentation Frequency 220 22 50 37 40 37 34 2.55 8
1.8 Unavailability of plant and equipment in the
market Frequency 220 26 30 39 48 42 35 2.7 6 1.9 Inclement weather Frequency 220 50 78 40 40 8 4 1.5 10
1.10 Bureaucracy from government agencies Frequency 220 47 29 40 52 28 24 2.26 9
Average 2.9
formula:-µ = Sum of all Likert scale value multiplied by frequency of respondents under that entry divided by the total sample number for all the six entries, rounded to two decimal places.
Mathematically presented, taking value on Likert scale as A1, A2 up to A6, sample size N and the frequency entered under particular Likert scale rating F1, F2 up to F6, this can be presented as
below:-µ = ROUND(Sum(A1xF1/N + A2xF2/N + A3xF3/N + A4xF4/N + A5xF5/N + A6xF6/N),2)
This was done on every factor. The unsure respondents of course had a total of zero as their numbers were multiplied by zero on the Likert scale. The Likert scale was chosen because it was observed to be used in a number of literatures where questionnaire surveys were used, and was considered to be authentically acceptable. The group factors average was calculated by dividing the sum of mean scores for that group by ten (10) as there were ten factors per grouping.
Table 4.5.2: Failure to achieve quality expectations in projects
U Minor...Major
M
e
an
S
co
re
R
an
ki
n
g
Factor 0 1 2 3 4 5
2.1 Shortage of skilled labour force in the market Frequency 220 4 0 17 16 87 96 4.14 1
2.2 No quality management systems (QMS) bycontractors Frequency 220 0 24 22 50 58 66 3.55 2
2.3 Non standardised specifications Frequency 220 4 37 35 50 52 42 3.07 6
2.4 Lack of technical skills by consultant’s site staff Frequency 220 10 34 24 32 52 68 3.3 4
2.5 Usage of lowest price tender method of contractprocurement Frequency 220 3 20 40 39 55 63 3.42 3
2.6 High levels of corruption Frequency 220 5 32 59 54 42 28 2.82 8
2.7 Mistakes and discrepancies in contract document Frequency 220 0 56 34 38 40 52 2.99 7
2.8 Contract duration too long (≥ 3 years) Frequency 220 0 42 38 39 42 59 3.17 5
2.9 Shortened contract durations Frequency 220 4 90 50 48 24 4 2.05 9
2.10 Scarcity of materials meeting contractspecifications (gravel / quarry stone) Frequency 220 0 102 60 38 20 0 1.89 10
Average 3.04
The individual group “mean scores” averages were 2.98 for clients, 3.05 for contractors and 3.24 for consultants. After combining, the mean score average was calculated as 3.04. Following the explanation given above under first group of factors, it can be observed that the maximum mean score can only be 5. With the exception of the score for the consultants, the two average mean scores for clients and contractors are very close to the combined average mean score. The discrepancy displayed by the results from the consults can be explained as a result of the small sample of 20 respondents compared with 100 respondents for the clients and contractors. This also amplifies the need to have a minimum sample size (Mark Saunders, 2009).
Table 4.5.3: Projects experiencing cost growths during implementation
U Minor...Major
M
e
an
S
co
re
R
an
ki
n
g
Factor 0 1 2 3 4 5
3.1 High inflation rates Frequency 220 0 0 11 31 49 129 4.35 1
3.2 Unavailability of foreign exchange Frequency 220 0 0 0 37 91 92 4.25 2
3.3 Scarcity of construction materials Frequency 220 0 4 22 37 46 111 4.08 3
3.4 Changes in scope of works Frequency 220 2 4 17 27 83 87 4.03 4
3.5 Incomplete designs at project commencement Frequency 220 0 11 11 42 57 99 4.01 5
3.6 High labour wages Frequency 220 0 23 25 53 61 58 3.48 7
3.7 Rising costs of construction materials Frequency 220 0 15 22 70 46 67 3.58 6
3.8 Under-estimation of cost of works during tenderstage Frequency 220 0 26 57 68 40 29 2.95 9
3.9 Delayed payments by the client Frequency 220 2 23 37 55 48 55 3.31 8
3.10 High transportation costs Frequency 220 0 41 64 55 50 10 2.65 10
Average 3.67
Table 4.5.4: Absence of community ownership
U Minor...Major
M
e
an
S
co
re
R
an
ki
n
g
Factor 0 1 2 3 4 5
4.1 Lack of initial community input at design stage Frequency 220 14 14 15 51 66 60 3.46 1
4.2 No consultation with the community by contractoron site Frequency 220 10 21 47 17 49 76 3.37 3
4.3 Disputes relating to employment of local people Frequency 220 10 24 14 49 62 61 3.42 2
4.4 Negative social impacts brought by the contractor Frequency 220 14 19 37 50 55 45 3.13 4
4.5 Negative environmental impacts on thecommunity Frequency 220 10 23 45 47 53 42 3.07 5
4.6 No formal channels of communication Frequency 220 0 44 46 55 37 38 2.9 7
4.7 Delayed assessment of compensation Frequency 220 0 36 38 70 39 37 3.01 6
4.8 Delayed payments of compensation Frequency 220 4 42 58 62 27 27 2.67 8
4.9 Under-evaluation of properties to becompensated Frequency 220 4 54 54 52 23 33 2.61 9
4.10 Lack of timely intervention by the local authorities Frequency 220 4 72 69 45 20 10 2.16 10
Average 2.98
Under this group of factors, the individual respondents grouping scores were 2.99 for the clients, 2.92 for contractors and 3.22 for consultants. The average mean score is 2.98, only deviating much from that of the consultants’ respondents because of the small sample size.
Having analysed the data as above, it was then scrutinised to relate the findings to the research question. This was done in the next chapter.
4.6 Secondary Data
4.6.1 Audit of Public Arrears of the Road Sector In 2010
The Audit of Public Arrears of the Road Sector in 2010 established that as of 31st January 2010, there were twenty-eight (28) live projects. Out of these, twelve (12) had outstanding payments amounting to MWK3.650 billion. There were potential claims at this date amounting to MWK17.8 billion due to extension of time arising from delay in providing design drawings, additional quantities of works and idle time for the diesel shortage (Gala, 2014)
4.6.2 Audit of Public Arrears of the Road Sector In 2014
The Audit of Public Arrears of the Road Sector in 2014 also included procurement processes to establish whether Procurement Act guidelines were followed. It is a requirement that when contracts are tendered, the award should be made only after the MoFEP&D and Office of the Director of Public Procurement (ODPP) confirmed availability of funds for the project and “No Objection” the recommended award. The table below gives an adjusted presentation of the report on procurement as of 30th June 2014. The adjustments have been made in taking out percentages of contracts procured by particular method, and introduction of a column in US$ equivalent of the figures given in Malawi Kwacha (MWK).
Table 4.5: Procurement methods used for contracting
Procurement method No. of
Contracts
Value (MWK) Value (US$)
Open tendering 2 11,240,438,850.82 23,915,827.34
Short listing 0 0 0
Single sourcing 0 0 0
TOTAL 2 11,240,438,850.82 23,915,827.34
Source: (Gala, 2014)
documentation. The question is, if the procedures of procurement are followed, i.e. getting confirmation of availability of funds for the impending project and seeking “No Bjection” from ODPP, why could there be a challenge to effect payments to contractors or consultants? It is the opinion of the author that such contracts are procured hestily due to pressure. Aware that such procurements would result in the projects facing similar challenges as those where there is still outstanding amounts, the officers play it safe by proceeding only after the procedures in the Procurement Guidelines are fulfilled. However, it is one thing to fulfill thesee procedures which are only paper works, but to make funds available for the projects may not be guranteed.
Chapter 5
5.1 Discussions
This descriptive quantitative study evaluated the perceptions of respondents who were mostly engineers and technicians involved in road construction with regard to factors affecting performance of the contractors. The researcher analysed responses with regard to those factors that directly related to the objective of the study. These factors were addressing the question of whether set guidelines in the implementation of the road projects were adhered to. It was the intention of the researcher to touch on issues of procurement, road design and construction drawings, standard specifications for road construction, payments to contractors and compensation for project affected people.
In the third group of factors under the individual grouping had an average mean score of 3.56 for clients, 3.73 for contractors and 3.96 for consultants. After combining the average mean score calculated was 3.67. Actually this is the group of factors that had the highest scores in any way the mean score was calculated. This signifies the importance of this group of factors in the construction industry. It is also related to the research question’s subject of inquiry. There are issues of change of scope of works, delayed payments for work already done, high inflation rates. While some of the factors may not be avoided, such as high inflation rates, rising costs of construction materials and high labour wages, one major factor avoidable is changes in scope of works.
The credibility of research findings depends on the source of data used, and how this data is processed into information that can be relied upon. The methodology in the conducting of the research is also critical to the credibility of the research findings (Saunders, 2009). In line with this the researcher had to calculate the sample size. The sample size matters, as the significance of the data collected through survey such as questionnaire varies depending on the size.
size. The sample size was calculated to be 186. This is not an easy number to get if you are looking for people with particular backgrounds and occupation. For this reason, players in the road construction industry from the client point of view, contractors and consultants were all used so that the requirement of the sample size should be met.
The effects of using sample size smaller than minimum have been appreciated in this research as observed from the respondents coming from the consultants companies where the respondents were much less than the required number. However, where the numbers of respondents were above fifty per cent of the sample size, the results proved to be closer to the ideal.
The secondary data used in this research has brought out some profound facts about how road construction projects have been managed over the past ten years in Malawi. If the trend continues as has been established in this research, GoM is likely to perpetually be in conflict with contractors. There have been deliberate moves shown on paper how this situation can be stopped. However, nothing material is being done as the bills continue to grow.
The budget allocated for road construction projects is only on paper. In the Financial Year (FY) 2013/2014 the vote for road construction was allocated MWK 12 billion. This was not adequate considering that at the close of 2012/2013 FY there was an outstanding bill of MWK8,502,442,845. It may not be surprising that the bill short to MWK27,420,160,151 by the close of 2013/2014. What is more painful is that the audit report by Gala, (Gala, 2014) revealed that no payments were made by GoM to contractors and consultants working on road construction projects between 1st July 2013 and 30th June 2014. This clearly shows that the budget is not adhered to by GoM. If the amount indicated in the budget documents were disbursed in the year, that would be an indication of seriousness.
5.2 Conclusions and recommendations
5.2.1 Contractors project related difficulties
The results of the research have demonstrated that contractors’ perception on difficulties encountered during project implementation is mostly due to the clients’ actions. Delayed payments were rated high on the Likert scale, clearly demonstrating that they get affected when payments are delayed. Sixty (60) of the one hundred (100) respondents strongly believe that delayed payments are a challenge. Even the consultants’ respondents demonstrated likewise as all the twenty (20) respondents indicated they strongly believed it was significant in impacting on the performance of the contractors. In general, even the clients’ respondents have affirmed the importance of making timely payments. This is why the combined analysis has a high mean score of 4.14 out of 5 for this factor.
The researcher recommends the following actions to be taken by
GoM:-a) That government should leave the administration of road construction to the responsible ministry and the Roads Authority (RA), with Roads Fund Administration (RFA) handling payments according to budget and Annual National Roads Programme (ANRP)
b) That there should be no new contracts until all the arrears have been cleared, or unless grant aid has been identified
c) That budget allocations should be honoured, other than putting figures and making no payments up to the end of Financial Year (FY) as was the case in the 2013/2014 FY.
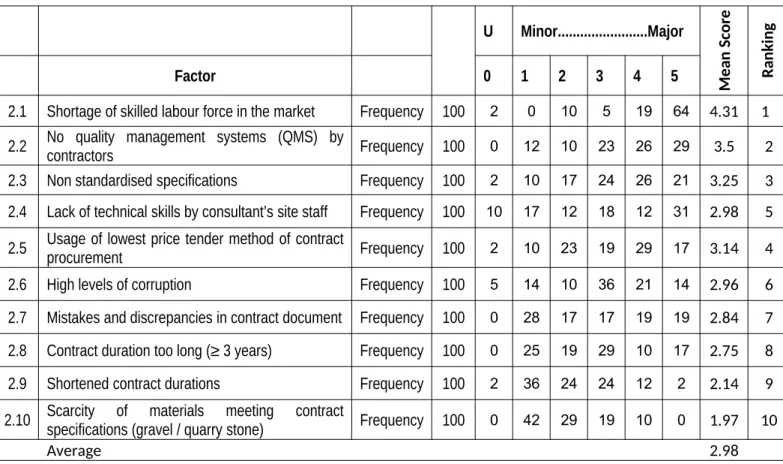
5.2.2 Failure to achieve quality expectations in projects
Although the consultants’ respondents sample was small at 20 compared to those for clients and contractors at 100 each, their mean score of 4.4 reflects their perception which is based on their experiences with the contractors’ personnel at all levels. Going through monthly reports which are prepared by consultants, almost every report talks about contractor’s lack of organisation and planning. This makes the consults’ staff on site develop the perception that the contractors’ site personnel are not experienced or lack the necessary training.
There might be some truth in the way this issue has come out because all the three groupings scores highest under this factor. It is the opinion of this author that contractors must allow their staff to go for refresher courses. Apart from learning from the facilitators at refresher courses, the participants learn from each other and they share experiences. Besides that, when you interact with people of your field of training, you tend to realise how much or little you know. If you discover that you actually know a lot than you thought, your confidence grows and you are likely to perform better than before due to the confidence developed. On the other hand, when you realise that you are lacking in the knowledge of your field, it might be your opportunity to link up with the people you admired for further development, and this will eventually give confidence as you work.
It has been observed that contractors in Malawi only allow their staff to go on leave during the Christmas and New Year Holidays. This implies that many of them get exhausted, but are still forced to go to work as their staying away from work is considered a loss by their employers.
financial proposal assessed. Thus, whoever passes the threshold mark at technical evaluation will be considered for awarding the contract. Otherwise if the contract is awarded to one whose tender price was higher, it will be an audit query, and in this dispensation of many cases of corruption, this would be perceived to be at the influence of corruption.
5.2.3 Projects experiencing cost growths during implementation
Under this category the issue of delayed payments reappears. This has already been discussed and recommendations have been made under 5.2.1.
However, change in scope of works is new and is commented on as
follows:-a) Change in scope of works is allowed in standard contract documents such as International Federation of Consulting Engineers (FIDIC), but there is a limit as to how much changes can be made without the contractor revising his rates. If it involves work that is in the critical path, the contractor would be entitled to extension of time. This would be a source of increase in contract price. Thus, RA should make thorough checks in the road designs submitted by consultants to ascertain completeness. This way, there would not be need to introduce any changes in scope of work.
b) The challenge has been that policy makers would instruct changes to the scope of works. This gets out of control and the thresholds mentioned above are exceeded and contractors normally demand extension of time with time related costs.
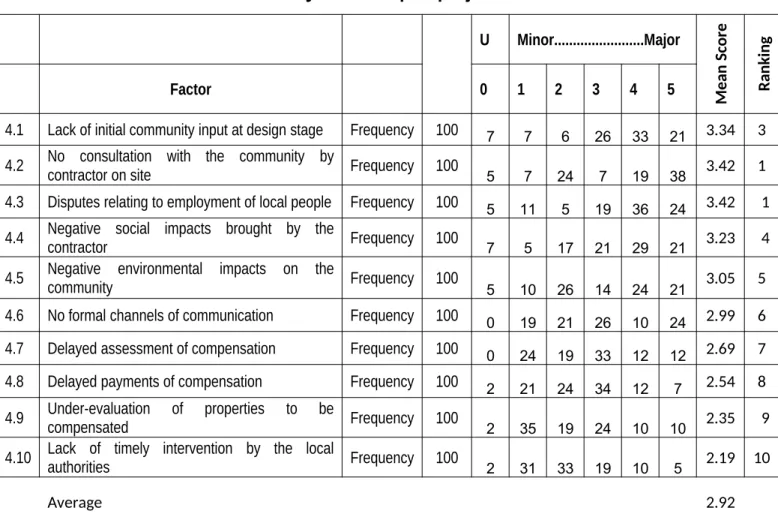
5.2.4 Absence of community ownership of projects
Under this category of factors affecting project implementation, the average mean scores were 3.22 for consultants’ respondents, 2.92 for contractors’ respondents and 2.99 for clients’ respondents. In general, contractors’ and consultants’ respondents rated this lower than the first one; Contractors project related difficulties. The clients’ respondents however rated it higher. This is a reflection of generally perceived ideas of each of the respondents groups. The clients are mindful of compensation of project affected people (PAP), which affects progress on site. Sometimes members of the community gang up and stop works at some sections, arguing that their compensations must be paid before works can be carried out.
To make clear what goes in the minds of the clients, this explanation will help. Monthly productions at a site during dry season when all plants and materials are in place can be in the region of MWK250 million to MWK350 million. This translates to production rates of MWK8.33 million to MWK 11.66 million a day. Compensations are paid by RFA after they have been given funding by the MoFEP&D. The compensation money in question at the particular section might add up to MWK20 million. However, the contractor may be stopped from working for a whole week. Even if the lower estimate of daily production is assumed, the loss claims that the contractor would lodge could be at MWK 58.31 million for the week. So for the clients this section also has factors that can impact negatively on the performance of the project.
The author’s recommendations on this set of factors that relate to stakeholders
Bibliography
A. A. Aibinu, G. O. J., 2002. The effects of construction delays on project delivery in Nigerian construction industry. International Journal of Project Management, Volume 20, pp. 593-599.
Anbari, F. T., 2003. Earned Value Project Management Method and Extensions. Project Management Institute, 34(4), pp. 12-23.
Assaf, S. A. &. A.-H. S., 2006. Causes of delay in large construction projects. International Journal of Project Management, 24(4), pp. 349-357.
Bunrs, N. &. G. S. K., 2009. The Practice of Nursing Research Apraisal, Synthesis and Generation of Evidence. 6th ed. St. Louis: Saunders.
Camilleri, E., 2011. Project Success: Critical Factors and Behaviours. 1st ed. Malta: Ashgate Publishing. Cooke-Davies, T., 2002. The ‘‘real’’ success factors on projects. International Journal of Project Management, Volume 20, pp. 185-190.
D, L., 2007. Project Management. 4th ed. New York: Kunkeyani .
Fisher, C., 2010. Researching and Writing a Dissertation: An Essential Guide for Buisiness Students. 3rd ed. Harlow: Pearson Education Limited.
Gala, S., 2014. Report on GoM Arrears up to 30 June 2014, Lilongwe: Unpublished.
German Eduardo Giraldo González, e. a., 2013. Project Management Profile Characterization in the Construction Sector in Bogoá, Colombia. Project Management Journal, 44(6), pp. 68-93.
Hillson, D., 2009. Managing Risk in Projects. 1st ed. Surrey: Gower Publishing Limited.
Ibrahim Mahamid, e. a., 2014. Major Factors Influencing Employee Productivity in the KSA Public Construction Projects. International Journal of Civil & Environmental Engineering, 14(1).
Leon A Keppelman, R. M. &. L. Z., 2006. Early Warning Signs of it Project Failure: The Dominant Dozen. Information Systems Management, 23(4), pp. 31-36.
M. Haseeb, X.-L. A. B. M.-u.-D. W. R., 2011. Causes and Effects of Delays in Large Construction Projects of Pakistan. Kuwait Chapter of Arabian Journal of Business and Management Review, 1(4), pp. 18-42. Mark Saunders, P. L. a. A. T., 2009. Research Methods for Business Students. 5th ed. Harlow: Pearson Education Limited.
Polit, D. F. &. H. B. P., 1999. Nursing Research Principles and Methods. Philadelphia: William and Wilkins. Sara Haji-Kazemi, B. A. &. H. P. K., 2013. A Review of Possible Approaches for Detecting Early Warning Signs in Projects. Project Management Journal, 44(5), pp. 55-69.
Sekaran, U., 2003. Research Methods for Business: A Skill-Building Approach. 4th ed. New York: John Wiley & Sons, Inc..
APPENDICES APPENDIX A
PART I: FOR CONTRACTORS 1. General Information
Please tick your answers in the appropriate box provided.
1.1 Please state the name of your organisation ………
1.2 Please state your organization’s registration category with the National Construction Industry Council of Malawi (NCIC).
100 million 200 million 500 million Unlimited
1.3 Please state the length of your organization’s experience in the road construction Industry.
1-5 years 6-10 years 11-15 years 16-20 years > 20 years
1.4 Please state your average annual turnover of construction work (in million of Malawi kwacha) in the last 5 years?
1.5 Please state your gender?
Male Female
1.6Please state the length of your personal experience in the road construction industry?
1-5 years 5-10 years 10-15 years 15-20 years > 20 years
1.7 Please state your highest academic qualification.
MSCE Tradesman Cert or Dip Degree Post Grad
Note
MSCE= Malawi School Certificate of Education or equivalent high school qualification
Tradesman= Trade test certificate from Technical college Cert or Dip= City and Guilds Certificate or University Diploma
PART II: FOR CLIENTS AND CONSULTANTS 2. General Information
Please tick your answers in the appropriate box provided.
1.9 Name of organisation………
1.10 Please state your gender
Male Female
1.11 Please state your current position in the organisation (e.g. CEO, Director, etc)
………
1.12 Please state the length of your experience with your current employer.
1-5 years 6-10 years 11-15 years 16-20 years > 20 years
1.13 Please state the length of your personal experience in the road construction industry.
1-5 years 6-10 years 11-15 years 16-20 years > 20 years
1.14 Please state your highest qualifications.
Cert or Dip Degree Post Grad Pr Eng(R