Vol. 2 (2012) No. 1 ISSN: 2088-5334
Frame Optimization using Neural Network
Mohd Suhairil Meon1, Muhammad Azhan Anuar2, Mohd Hanif Mohd Ramli3, Wahyu Kuntjoro4,
Zulkifli Muhammad5
Faculty of Mechanical Engineering, Universiti Teknologi MARA, UiTM Shah Alam, 40450, Shah Alam, Selangor E-mail: 1[email protected], 2[email protected], 3[email protected], 4[email protected],
Abstract—The development of Neural-network (NN) technology stemmed from the desire to create an artificial system that could perform “intelligent” tasks similar to those performed by the human brain. In this paper the performance of NN to the structural optimization concept of frame structure is presented. The optimum set of frame designs is obtained using Finite Element (FE) software where stress and displacement constraints has been chosen as the optimum criteria. The optimized data then used to train the NN through Back Propagation Neural-network technique (BPNN) to identify the capability of this strategy to predict the exact data. Three case studies were performed with different complexity of structural configuration. Result indicates the Neural-network capable of predicting the exact solution with proper training but this ability depends on the complexity of the frame structural optimization itself.
Keywords— Neural Network; Structural Optimization; Artificial Intelligent
I. INTRODUCTION
Optimization is an application of numerical algorithms and techniques in engineering applications which used to improve the system's performance, weight, reliability, and/or cost. Based on these advantages, researchers always improvise their strategy in this area by introducing new techniques or methodologies to meet the optimization criteria. The structural design also adapts to the trend where optimization concept is always implemented in any structural design decision.
An optimum structural design is a design that minimizes (or maximize) a certain objective function, and still meets its design requirements. For many structures, the objective function normally is weight of structure, while the design requirements are strength and stiffness among others. Normally, the optimization is performed on the size of the structural members.
Optimization techniques grow tremendously in this century. Neural-network (NN) for example has become a popular approach to solve the optimization problems. Its ability to perform constraints check while require less computational effort to produce optimized results amazed the researchers to use it as well as to produce modified or extended algorithms. The strength of the neural networks lies in their ability to represent both linear and non-linear relationships and capable to learn these relationships directly from the data being modeled.
In real life, identification of the optimum design of an industrial problem is often not possible because of the size of the problem and lack of knowledge. In this situation, design optimisation is essentially seen as design improvement [1]. Many engineering design problems are too complex to be solved with mathematical programming methods, thus heuristic search methods is quite helpful to overcome this difficulty [2].
Performing structural optimization by involving its configurations as variables will offer more flexibility in the design and also opens up the design space. Mathematical programming is commonly used for optimization [3],[4],[5]. The genetic algorithm is also an attractive approach due to its capability to deal with stochastic problems [6]. The genetic algorithm techniques are based on the mechanism of natural selection and natural genetics.
For large and complex structures, the analysis stage is performed using the finite element method to get structural
response such as stress and displacements [8]. With
as thickness, height, and width. The logical step to take is to perform optimization based on the measurable design [9].
Optimization can be extended to include the location of the structural joints, hence optimization of configuration. An approach to do this is by performing the optimization of both the member dimensions and joint locations in one-shot using mathematical programming. Kuntjoro et.al performed optimization of truss structure configuration based on mathematical programming [10]. Linear Extended Interior Penalty Function Method was used.
The latest optimization techniques used in size and shape optimization can be applied to topology optimization. Leiva et.al [11] discussed the work done to completely integrate topology optimization with finite element analysis in the general-purpose structural analysis and optimization program GENESIS. Topology optimization (member disposition) of truss structures, based on deletion of ineffective structural members, was researched by Kuntjoro et.al [12].
In the field of genetic algorithm application, G.A. Chapman et al. [13], performed a topology optimization of a cantilever plate. R.J. Balling et al. [14] did a research on the optimum shape/sizes/topology of skeletal structures based on strength constraints.
This proposed research will explore a popular Artificial Intelligence tool, which is Neural Network, for optimization of frame structure. Stress and displacement constraints will be considered with minimum weight as the optimum criteria. A neural network is a powerful data modeling tool that is able to capture and represent complex input/output relationships. The motivation for the development of neural network technology stemmed from the desire to develop an artificial system that could perform "intelligent" tasks similar to those performed by the human brain [15]. The true power and advantage of neural networks lies in their ability to represent both linear and non-linear relationships and in their ability to learn these relationships directly from the data being modeled. Neural networks resemble the human brain in the following two ways:
A neural network acquires knowledge through
learning.
A neural network's knowledge is stored within
inter-neuron connection strengths known as synaptic weights.
Adeli et al. [16] had studied the optimization of a space structures by Neural Dynamics which had been done to minimize the weight design of space trusses subjected to the stress and displacement constraint under different dynamic loading conditions. Iranmanesh and Kaveh [17] did an optimization of truss structures using counterpropagation neural network. They trained two artificial neural networks, one for the constraints and the other one for the constraint gradients. Accurate results were reported. M. Papadrakakis and N. D. Lagaros [7] had investigated the optimization procedure using evolution strategies (ES), practically are more robust and present a better global behaviour than mathematical approaches.
N. D. Lagaros et al. [18] studied about an adoption of Neural-network strategy for improving the computational performance of structural optimization. The prediction
NN scheme coupled with domain decomposition solution techniques were investigated. Papadrakakis et al. [22] in their study stated that the benefit of a properly trained NN is that it requires a trivial computational effort to produced an acceptable approximate solution. The NN sheme is suggested if computing time and a quick estimation is required.
II. METHODOLOGY A. Design Optimization of 2D Frame
In design optimization, the main objective is to minimize the weight of structure, under some requirements or constraints. A discrete structural optimization problem can be formulated as:
Minimize F (z)
Subject to gi (z) ≤0, i = 1, 2,..m
sjRd , j = 1, 2,...n
where F (z) and gi (z) represent the objective function and
behavioral constraint. Indices m and n referred to the number
of constraints and design variables respectively while sj (j =
1, 2,...n) can use values from this set only.
In this study, Finite element simulation is done according to the objective and constraints required as follows:
1) Design variables: The variables are width and height of the cross-section of beam used.
Width B : 0.1 ≤B ≤ 500 mm
Height H : 0.1 ≤H ≤ 500 mm
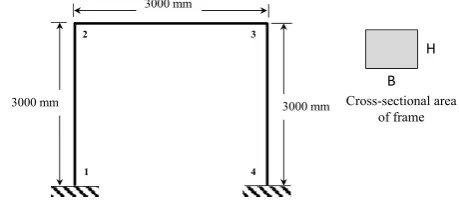
2) State variables: Our main focuses were the stress at all point and location and also the deflection at node 2 and 3 only. Node 1 and 3 are fixed as illustrated in Fig.1.
Stress at any point : 1 ≤σ≤ 200 MPa
Deflection at node 2 and 3 : 0.1 ≤ u ≤ 1 mm
3) Objective function: Volume of the structure need to be minimized.
The geometry of the frame as shown in Fig. 1 is relatively simple and can be further enhanced if NN application succesfully implemented in this project.
Fig. 1 Geometry of frame used for finite element simulation
Material used for this study is steel under condition of isotropic linear elastic behavior. Others important data such as modulus of elasticity, Yield strength, and poisson’s ratio are shown in Table 1.
4
3000 mm 3000 mm
3000 mm
1
3 2
H
B
TABLEI
DATA USED FOR CALCULATION OF OPTIMIZATION OF FRAME
Parameter Value
Modulus of elasticity, E (GPa) 200
Yield strength, Y (MPa) 200
Poisson’s ratio, 0.3
Width, B (initial value) (mm) 20
Height, H (initial value) (mm) 20
Variation of loading’s magnitude and location will be discussed in case study section later. Optimized data as well as initial data for each case will be used for NN training process.
B. Implementation of Neural Network
The main objective of adopting this method is to investigate the capability of NN to perform the constrains check. The selection of appropriate Input/Output (I/O) training data plays major role in NN training. The distribution of samples are much more vital rather than the number of training pattern.
In general, there are many types of NN techniques introduced, and there is no specific method can be used for all problems. In this study, a Back Propagation Neural-network (BPNN) approach has been used. A multilayer BPNN model is designed by using Matlab neural-network toolbox.
As shown in Fig. 2, BPNN consists of multiple interconnected processing elements that belongs to particular layers. BPNN can be realised as a mapping from input vectors to output vectors. Mathematical relation of BPNN will not be discussed here. The input of each neurons comes from the output of the neurons contained in the preceeding layers.
Fig. 2 Architecture of the the applied BPNN
The steps involved in implementing BPNN predictive tool consists of:
1) Data learning rate (LR): Data learning rate is set to be 40, 50 and 60 (actual data evaluated from Finite Element method are 100) to achieve bests result approaching actual data.
2) Number of neurons and hidden layers: The number of neurons and hidden layers were increased for several times
until the results converged at one satisfaction level. Finalised
number of hidden layers can be seen from Fig.2.
3) Epoch number: The epoch number is number of training per iteration process. Epoch number was tuned by comparing the mean square error and time taken to achieve data prediction. Based on these two relationships, the best
epoch number was 500.
III.CASE STUDY
In this study, three cases has been identified for optimization using NN. Different load cases of simple 2D frame structure as shown in Fig. 3 to Fig. 5 had been used to check whether NN could predict exact solution (constraints check) or not.
Fig. 3 Configuration of applied load for case 1: Equal load applied, Pv,2
and Pv,3 , starting from 10000 N until 20000 N
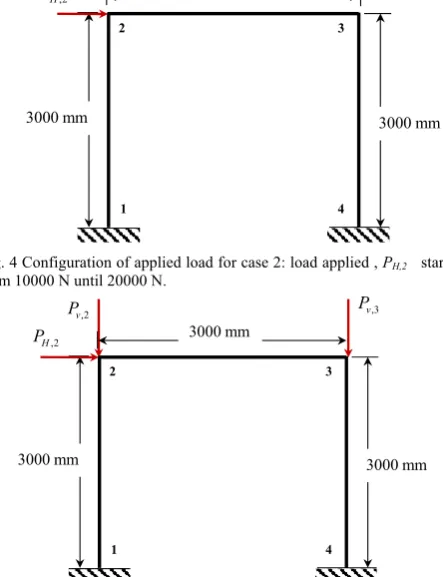
Fig. 4 Configuration of applied load for case 2: load applied , PH,2 starting
from 10000 N until 20000 N.
Fig. 5 Configuration of applied load for case 3: Constant load of 20000 N applied for Pv,2 and Pv,3 while load applied for PH,2 varies from 10000 N
until 20000 N. 1
x obj1
Input layer Hidden layer 1 Hidden layer 2 Output layer
4
3000 mm 3000 mm
3000 mm
1
3 2
,2
v
P Pv,3
4
3000 mm 3000 mm
3000 mm
1
3 2
,2
H P
4
3000 mm 3000 mm
3000 mm
1
3 2
,2
H P
,3
v P
,2
IV.RESULT AND DISCUSSION
In this paper, only optimization data for deflection at node number 2 will be discussed. Other parameters had successfully been conducted and had shown similar pattern with this one.
A. Effect of learning rate for each case
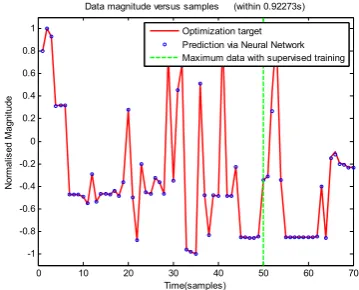
Fig. 6(a) to 6(c) illustrated the results which were based on the simulation of NN performance on case 1. Three level of learning rate are applied to this case which were 40, 50 and 60. The loading configuration in case 1 was the most common one and hence, the maximum mean square error (MSE) was easily converged to 0.0054 without computational burden. This MSE varies as the learning rate changes. It is observed that the MSE decreases as learning rate increase from 40 to 60. Fig. 6(d) shows these changes, while Fig. 6(a) until 6(c) portray the MSE value for each learning rate.
Fig. 6(a) Result from training of NN for case 1, based on LR = 40
Fig. 6 (b) Result from training of NN for case 1, based on LR = 50
Fig. 6(d) Mean square error for case 1
Fig. 7(a) Result from training of NN for case 2, based on LR = 40
Fig. 7 (b) Result from training of NN for case 2, based on LR = 50
0 10 20 30 40 50 60 70
-1 -0.8 -0.6 -0.4 -0.2 0 0.2 0.4 0.6 0.8 1
Data magnitude versus samples (within 0.461s)
Time(samples) N or m al is ed M agnit ud e Optimization target Prediction via Neural Network Maximum data with supervised training
0 10 20 30 40 50 60 70
-1 -0.8 -0.6 -0.4 -0.2 0 0.2 0.4 0.6 0.8 1
Data magnitude versus samples (within 0.49869s)
Time(samples) N orm al is ed M agni tude Optimization target Prediction via Neural Network Maximum data with supervised training
0 10 20 30 40 50 60 70
-1 -0.8 -0.6 -0.4 -0.2 0 0.2 0.4 0.6 0.8 1
Data magnitude versus samples (within 0.48481s)
Time(samples) No rm al is ed M ag ni tud e Optimization target Prediction via Neural Network Maximum data with supervised training
0 10 20 30 40 50 60 70
-1 -0.8 -0.6 -0.4 -0.2 0 0.2 0.4 0.6 0.8 1
Data magnitude versus samples (within 1.1354s)
Time(samples) Norm al is ed M agni tu de Optimization target Prediction via Neural Network Maximum data with supervised training
0 10 20 30 40 50 60 70
-1 -0.8 -0.6 -0.4 -0.2 0 0.2 0.4 0.6 0.8 1
Data magnitude versus samples (within 0.92273s)
Time(samples) Norm al is ed M agni tu de Optimization target Prediction via Neural Network Maximum data with supervised training
0 10 20 30 40 50 60 70
-1 -0.8 -0.6 -0.4 -0.2 0 0.2 0.4 0.6 0.8 1
Data magnitude versus samples (within 0.44642s)
Time(samples) No rm al is ed M ag ni tud e Optimization target Prediction via Neural Network Maximum data with supervised training
40 50 60
Fig. 7(d) Mean square error for case 2
The NNs for case 2 is illustrated in Fig 7(a) to 7(c). From Fig. 7(d), it can be seen that compared to case 1, case 2 exhibits higher mean square error at LR = 40.
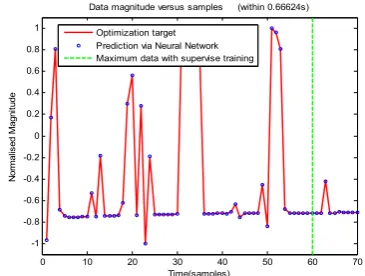
The trend of performance of NN had shown similarity for case 3 as shown in Fig. 8(a) to 8(d). It shows reduction of mean square error when the learning rate is increased.
The predictions improve more on training samples with 60 data (close to 70). There is no significant error regarding the actual data and the neural-network prediction. Good agreement can be seen in Fig. 6 (c), fig. 7 (c) and fig. 8 (c) where the actual data and the prediction data are overlapping with each other.
Fig. 8(a) Result from training of NN for case 3, based on LR = 40
Fig. 8 (b) Result from training of NN for case 3, based on LR = 50
Fig. 8 (c) Result from training of NN for case 3, based on LR = 60
Fig. 8(d) Mean square error for case 3
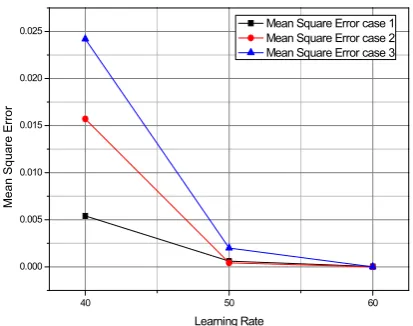
B. Mean Square error (mse) Differences
The performance of NN here was measured based on the value of mean square error. Higher mean square error indicates poor performance of neural-network. In Fig. 9, the comparison for NN performance is made for all three cases, showing that, highest mean square error was recorded for case 3 at LR = 40, followed by case 2 and case 1.
The complexity of the structure itself influences the value of mse (e.g. configuration of load). But with proper training, for instance increasing the learning rate to 50, better prediction is obtained. It was observed that the more complex the structures, the longer time taken to complete the process but in returns, a better predictive values and very small mean square error were accomplished.
0 10 20 30 40 50 60 70
-1 -0.8 -0.6 -0.4 -0.2 0 0.2 0.4 0.6 0.8 1
Data magnitude versus samples (within 2.5009s)
Time(samples)
N
or
m
al
is
ed M
agn
itude
Optimization target Prediction via Neural Network Maximum data with supervise training
0 10 20 30 40 50 60 70
-1 -0.8 -0.6 -0.4 -0.2 0 0.2 0.4 0.6 0.8 1
Data magnitude versus samples (within 2.5009s)
Time(samples)
Norm
al
is
ed M
agni
tu
de
Optimization target Prediction via Neural Network Maximum data with supervise training
0 10 20 30 40 50 60 70
-1 -0.8 -0.6 -0.4 -0.2 0 0.2 0.4 0.6 0.8 1
Data magnitude versus samples (within 0.66624s)
Time(samples)
N
or
m
al
is
ed
M
agni
tud
e
Optimization target Prediction via Neural Network Maximum data with supervise training
40 50 60
-0.002 0.000 0.002 0.004 0.006 0.008 0.010 0.012 0.014 0.016
Mea
n S
quar
e E
rr
or
Learning Rate
40 50 60
0.000 0.005 0.010 0.015 0.020 0.025
Mean
S
quare
E
rror
40 50 60 0.000
0.005 0.010 0.015 0.020 0.025
M
ean Squ
a
re
E
rr
o
r
Learning Rate
Mean Square Error case 1 Mean Square Error case 2 Mean Square Error case 3
Fig. 9 Comparison of Mean square error for each case
V. CONCLUSIONS
Design optimization of frame structure using approximations based on feed-forward back-propagation neural network was explored in this paper. Implementation of NN has successfully conducted in this project with proper training of optimized data. Three cases have been investigated, and results show neural network performs well to predict the optimization criteria. Some adjustment of learning rate, epoch number as well as number of neurons and hidden layers has been done in order to increase the efficiency of NN performance. Mean square error analysis reveals that higher learning rate applied to particular situation, will yield better performance of NN scheme obtained.
NOMENCLATURE
NN Neural Network
mse mean square error
LR Learning rate
BPNN Back Propagation Neural-network
ES evolution strategies
FE Finite element
ACKNOWLEDGMENT
The authors are pleased to acknowledge Research Management Institute (RMI) and Universiti Teknologi MARA (UiTM) for providing financial support for this study through a research grant Dana Kecemerlangan {600-RMI/ST/DANA 5/3/Dst (199/2009)}.
REFERENCES
[1] Rajkumar Roy, Srichand Hinduja, Roberto Teti, Recent advances in engineering design optimisation: Challenges and future trends, CIRP Annals - Manufacturing Technology 57 (2008) 697–715
[2] Gang Li , Ren-Gen Zhou , Lian Duan , Wai-Fah Chen , Multiobjective and multilevel optimization for steel frames, Engineering Structures 21 (1999) 519–529
[3] G.N. Vanderplaats, Numerical Optimization Techniques for Engineering Design: With Applications, McGraw-Hill, New York, 1984.
[4] J.S. Arora, Introduction to Optimum Design, McGraw-Hill, Singapore, 1989.
[5] A.J. Morris, Foundations of Structural Optimization: A Unified Approach, John Wiley & Sons, Chichester, 1982.
[6] M. Gen, R. Cheng, Genetic Algorithms and Engineering Optimization, John Wiley & Sons, Inc., New York, 2000
[7] Manolis Papadrakakis, Nikos D. Lagaros, Reliability-based structural optimization using neural networks and Monte Carlo simulation, Comput. Methods Appl. Mech. Engrg. 191 (2002) 3491– 3507
[8] W Kuntjoro, An Introduction to the Finite Element Method, McGraw-Hill, Singapore 2005.
[9] W. Kuntjoro, A.K. Hussain, M.N. Berhan, Structural Optimization using Measurable Design Variables, Scientific Research journal Vol 1 No 1 2003, UiTM, Malaysia.
[10] W. Kuntjoro, J. Mahmud, Truss Structural Configuration Optimization using The Extended Interior Penalty method, ANZIAM Journal 46 (E) pp.C1272-C1287 2005.
[11] J.P. Leiva, B.C. Watson, I. Kosaka, Modern Structural Optimization Concepts Applied to Topology Optimization, AIAA-99-1388, 1999. [12] W. Kuntjoro, J. Mahmud, Truss Topology Optimization using
Mathematical Programming, RC-ASTI 2007, Bandung, Indonesia, 2007.
[13] C.D. Chapman, K. Saitou, M.J. Jakiela, Genetic Algorithms as an Approach to Configuration and Topology Design, Journal of Mechanical Design Vol.116, December 1994.
[14] R.J. Balling, R.R. Briggs, K. Gillman, Multiple Optimum Shape/Sizes/Topology Designs for Skeletal Structures Using a Genetic Algorithm, Journal of Structural Engineering @ ASCE, July 2006.
[15] N.B, Karayiannis, A.N, Venetsanopoulos, Artificial Neural Networks: Learning Algorithm, Performance Evaluation and Applications, Kluwer Academic Publisher, 1993.
[16] Hojjat Adeli, Hyo Seon Park, Optimization of Space Structures by Neural Dynamics, Neural Networks, Vol. 8, No. 5, pp. 769-781, 1995 [17] A Iranmanesh, A Kaveh, Optimization of Space Structures by Neural Dynamics, International Journal for Numerical Methods in Engineering, Vol. 46, Issue 2, pp. 297-311, 1999
[18] Nikolaos D. Lagaros, Dimos C. Charmpis, Manolis Papadrakakis, An adaptive neural network strategy for improving the computational performance of evolutionary structural optimization, Comput. Methods Appl. Mech. Engrg. 194 (2005) 3374–3393
[19] S. Gholizadeh, O.A. Samavati, Structural optimization by wavelet transforms and neural networks, Applied Mathematical Modelling 35 (2011) 915–929
[20] A. Kaveh, S. Talatahari, An improved ant colony optimization for the design of planar steel frames, Engineering Structures 32 (2010) 864-873
[21] Li Zhang, Ganesh Subbarayan, An evaluation of back-propagation neural networks for the optimal design of structural systems: Part II.Numerical evaluation, Comput. Methods Appl. Mech. Engrg. 191 (2002) 2887–2904
[22] Manolis Papadrakakis , Nikos D. Lagaros, Yiannis Tsompanakis, Structural optimization using evolution strategies and neural networks, Comput. Methods Appl. Mech. Engrg. 156 (1998) 309-333 [23] Fei Yin, Huajie Mao, Lin Hua, A hybrid of back propagation neural
network and genetic algorithm for optimization of injection molding process parameters, Materials and Design 32 (2011) 3457–3464 [24] Fabio D.Freitas , Alberto F.De Souza , Ailson R.de Almeida,