*Corresponding author: Janani.P ISSN: 0976-3031
SURVEY OF DATA AGGREGATION TECHNIQUES IN INTERNET OF THINGS (IoT)
Janani.P
1., Siddhant Verma
1
Department of ECE,
DOI: http://dx.doi.org/10.24327/ijrsr.
ARTICLE INFO ABSTRACT
The Internet of Things (IoT) is developing fast where the world we live in from the way we drive to how we make purchases. Smart sensing sensors
us each
of data that can be converted into information. Information helps us better understand the environment. Wireless Sensor Networks is a major constituent of it. Dat
a vital role in enhancing overall efficiency of such networks. In this paper we present comparative analysis of a few data aggregation techniques in Internet of Things with reference to the below parameters.
INTRODUCTION
The Internet of Things (IoT) is an evolution of
and embedded application s that are being connected to the internet integrating greater Computing capabilities and use data analytics to extract meaningful information. And when these intelligent devices and systems of systems share data over t cloud and analyse it they can transform, our business our lives and our world in countless ways whether it is improving medical outcomes, creating better products faster with lower development costs, optimizing energy generation and consumption. E.g.: imagine an intelligent device such as a smart traffic camera which can monitor the road for traffic congestion, accidents and weather conditions and communicate that status to a gateway that combines it with data from other cameras creating an intelligent city wide traffic system. Hence how will it be if that intelligent traffic system connected to other citywide transportation systems which get data from their own intelligent devices creating an ever
system of systems? The really big possibilities come from analysing the end-to-end data across that system of system.
Available Online at
International
Vol. 9, Issue,
Copyright © Janani.P et al, 2018, this is an open
Attribution License, which permits unrestricted use, distribution and reproduction in any medium, provided the original work properly cited.
Article History:
Received 18th October, 2017
Received in revised form 10th November, 2017
Accepted 06th December, 2017
Published online 28th January, 2018
Key Words:
Internet of Things, Wireless Sensor Networks, Data Aggregation, Power Consumption/Bandwidth, network heterogeneity.
Research Article
SURVEY OF DATA AGGREGATION TECHNIQUES IN INTERNET OF THINGS (IoT)
Siddhant Verma
2and Aditya Kumar Sinha
Department of ECE, Veltech University, Avadi Chennai, Tamil Nadu, India
2,3
CDAC, Pune, Maharastra, India
DOI: http://dx.doi.org/10.24327/ijrsr.2018.0901.1514
ABSTRACT
The Internet of Things (IoT) is developing fast where the world we live in from the way we drive to how we make purchases. Smart sensing sensors and chips are embedded in the
us each transmitting valuable data each and every second. These devices are sharing large quantities of data that can be converted into information. Information helps us better understand the environment. Wireless Sensor Networks is a major constituent of it. Dat
a vital role in enhancing overall efficiency of such networks. In this paper we present comparative analysis of a few data aggregation techniques in Internet of Things with reference to the below parameters.
The Internet of Things (IoT) is an evolution of mobile home and embedded application s that are being connected to the Computing capabilities and use data analytics to extract meaningful information. And when these intelligent devices and systems of systems share data over the cloud and analyse it they can transform, our business our lives and our world in countless ways whether it is improving medical outcomes, creating better products faster with lower development costs, optimizing energy generation and magine an intelligent device such as a smart traffic camera which can monitor the road for traffic congestion, accidents and weather conditions and communicate that status to a gateway that combines it with data from other traffic system. Hence how will it be if that intelligent traffic system connected to other citywide transportation systems which get data from their own intelligent devices creating an ever-larger intelligent ibilities come from end data across that system of system.
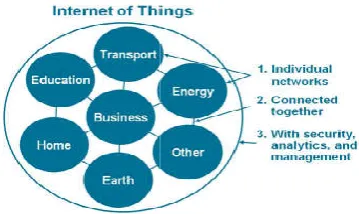
Fig 1 IoT as Network of Networks
Data Aggregation
Data Aggregation is a process in which information is gathered and expressed in a summary form, for purposes such as statistical analysis. A common aggregation purpose is to get more information about particular groups based on specific variables. For E.g. Raw data can be aggregated over a given time period to provide statistics such as average, minimum, maximum, sum and count. After the data is aggregated and written to a view or report you can analyse the aggregated data to gain insights about particular resources or resource groups. There are two types of data aggregation, Time aggregation and spatial aggregation.
Available Online at http://www.recentscientific.com
International Journal of Recent Scientific Research
, Issue, 1(K), pp. 23675-23679, January, 2018
, this is an open-access article distributed under the terms of the Creative Commons Attribution License, which permits unrestricted use, distribution and reproduction in any medium, provided the original work
CODEN: IJRSFP (USA)
SURVEY OF DATA AGGREGATION TECHNIQUES IN INTERNET OF THINGS (IoT)
and Aditya Kumar Sinha
3Veltech University, Avadi Chennai, Tamil Nadu, India
The Internet of Things (IoT) is developing fast where the world we live in from the way we drive to and chips are embedded in the things that surround transmitting valuable data each and every second. These devices are sharing large quantities of data that can be converted into information. Information helps us better understand the environment. Wireless Sensor Networks is a major constituent of it. Data Aggregation scheme plays a vital role in enhancing overall efficiency of such networks. In this paper we present comparative analysis of a few data aggregation techniques in Internet of Things with reference to the below
IoT as Network of Networks
Data Aggregation is a process in which information is gathered and expressed in a summary form, for purposes such as istical analysis. A common aggregation purpose is to get more information about particular groups based on specific variables. For E.g. Raw data can be aggregated over a given time period to provide statistics such as average, minimum, nt. After the data is aggregated and written to a view or report you can analyse the aggregated data to gain insights about particular resources or resource groups. There are two types of data aggregation, Time aggregation and
International Journal of
Recent Scientific
Research
Time Aggregation: all data points for a single resource over a specified time period.
Spatial Aggregation: all data points for a group of resource over a specified time period.
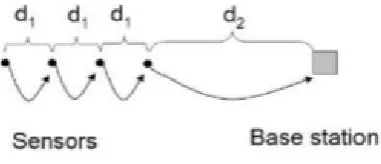
Fig 2 without and with data aggregation
Above represents the models one with data aggregation and other without data aggregation. In these the 1,2,3,5,6,7 nodes are called periodic sensor nodes that assemble data from the environment and send them to the upper nodes. The upper two nodes are called the relay nodes or the aggregator
perform the aggregation of the collected data packets by the children nodes. In the non-data aggregation model node 4 send all the three data packets (1,2,3) to the base station. But in second model that is with data aggregation only one data packet is transmitted by the aggregation node 8 to the base station. Hence in IoT networks using data aggregation method we can reduce the number of data burden before they are transmitted to the base station.
Implementation of WSN’s Device Addressing using
Wireless sensor networks (WSN) is a set of sensors that is interconnected used for monitoring and recording the physical conditions of the environment and maintaining the collected information at the central sensor node. Here they have presented a cloud centric vision for worldwide implementation of Internet of Things. A cloud implementation using Aneka [21], [22] which is based on interaction of private and public clouds is presented [1].
The future of the next generation mobile system is most l to depend on the creativity of the users for designing new applications that would come into trends. They have used a user-centric cloud based model for approaching this goal through the interaction of private and public clouds. In this manner the needs of the end-user are brought to the forth. Allowing the necessary flexibility to meet the diverse and sometimes competing needs of different sectors, for which they propose a framework enabled by a scalable cloud to provide the capacity to utilize the IoT.
Implementation
1. The addressing of device will be done based on a secure Hashing Algorithm (SHA) where each device ID will be first hash and then used for device tracking and control. 2. For data aggregation - using a threshold based
aggregation scheme this will reduce total number of byte communication which reduces the power consumption. 3. The Kerberos based security system will be developed
for authentication of user.
As hash based algorithm is used it reduces the total number of bytes in data thereby reducing the power consumption. We can all data points for a single resource all data points for a group of resource over a specified time period.
without and with data aggregation
data aggregation and other without data aggregation. In these the 1,2,3,5,6,7 nodes are called periodic sensor nodes that assemble data from the environment and send them to the upper nodes. The upper two nodes are called the relay nodes or the aggregator nodes that perform the aggregation of the collected data packets by the data aggregation model node 4 send all the three data packets (1,2,3) to the base station. But in second model that is with data aggregation only one data cket is transmitted by the aggregation node 8 to the base station. Hence in IoT networks using data aggregation method we can reduce the number of data burden before they are
Implementation of WSN’s Device Addressing using ANEKA
Wireless sensor networks (WSN) is a set of sensors that is interconnected used for monitoring and recording the physical conditions of the environment and maintaining the collected information at the central sensor node. Here they have cloud centric vision for worldwide implementation of Internet of Things. A cloud implementation using Aneka [21], [22] which is based on interaction of private and public
The future of the next generation mobile system is most likely to depend on the creativity of the users for designing new applications that would come into trends. They have used a centric cloud based model for approaching this goal through the interaction of private and public clouds. In this user are brought to the forth. Allowing the necessary flexibility to meet the diverse and sometimes competing needs of different sectors, for which they propose a framework enabled by a scalable cloud to provide the
The addressing of device will be done based on a secure Hashing Algorithm (SHA) where each device ID will be first hash and then used for device tracking and control.
using a threshold based his will reduce total number of byte communication which reduces the power consumption. The Kerberos based security system will be developed
As hash based algorithm is used it reduces the total number of reducing the power consumption. We can
add the concept of machine learning and artificial intelligence in the system in order to get more efficient data collection and control.
Compressed Sensing with Side Information
Distributed Compressed sensing
for data aggregation, where random measurements are transmitted from each sensor and the data are recovered at the joint decoder. As the measurements are sent directly from the sensor to the sink node, this architecture leads
and unbalanced battery consumption in large
Hence we use Multi-hop transmission with the main goal to balance the power consumption of the sensing devices. Using compressed sensing we can reduce the sampling and computation costs for sensing
representation (i.e.) the number of measurements that need to be stored are vastly reduced. This makes signal processing and reconstruction much simpler and has a wide variety of application in the real world
Holography, digital image processing etc. Such that they have used [2] large-scale data aggregation mechanism that is based on an extension of the framework in [4], [5] which addressed the problem of compressed sensing with side inf
Hence they follow a
multi-which lies in contrast with the transmission mechanism. Data Gathering with Compressed Sensing
In this paper where multi-hop scenario for which each node is said to be sending its data
nodes. Instance take let x (i)
sensor i ∈ {1, 2, N}. Above figure shows the approach of [6][7] in which the fuction is initiated by sensor 1, which is said to be generating φj,1 and transmits the value φj,1x(1) to node 2. it is given that node i generates a random number φj,i, computes the value φj,ix(i), adds it to the sum of the previous relayed values and sendsi n=1 φj,nx(n) to node i +1.This gets repeated until the node N sends its information to the sink node. hence this whole procedure is said to be repeated for M times, each indexed by j=1,...M. Hence, the sink node obtains M weighted sums{y (j)} M j=1, which can be expressed as
y = [φ1 ...φi ...FN] ·x = Φ·x
Here the retraining the sensor values x in the sink node is done by CS algorithms, such as OMP [8], CoSaMP [9], AMP [10] or BP-CS [11]. The sink node broadcasts a random seed to the entire network from this global seed where e
generates its own seed based on its unique ID. As the pseudo random number generator is pre
sensing coefficients are generated.
Fig 3
Multi-add the concept of machine learning and artificial intelligence in the system in order to get more efficient data collection and
Compressed Sensing with Side Information
Distributed Compressed sensing (DCS) [3] is another solution for data aggregation, where random measurements are transmitted from each sensor and the data are recovered at the joint decoder. As the measurements are sent directly from the sensor to the sink node, this architecture leads to significant and unbalanced battery consumption in large-scale setups. hop transmission with the main goal to balance the power consumption of the sensing devices. Using compressed sensing we can reduce the sampling and ts for sensing signals that have a compressible representation (i.e.) the number of measurements that need to be stored are vastly reduced. This makes signal processing and reconstruction much simpler and has a wide variety of application in the real world including Photography, Holography, digital image processing etc. Such that they have scale data aggregation mechanism that is based on an extension of the framework in [4], [5] which addressed the problem of compressed sensing with side information. -hop data transmission scenario, which lies in contrast with the transmission mechanism. Data Gathering with Compressed Sensing
hop scenario for which each node is said to be sending its data and the relayed data from other take let x (i) ∈ R points to the reading of the {1, 2, N}. Above figure shows the approach of [6][7] in which the fuction is initiated by sensor 1, which is said to be s the value φj,1x(1) to node 2. it is given that node i generates a random number φj,i, computes the value φj,ix(i), adds it to the sum of the previous relayed values and sendsi n=1 φj,nx(n) to node i +1.This gets repeated until ation to the sink node. hence this whole procedure is said to be repeated for M times, each indexed by j=1,...M. Hence, the sink node obtains M weighted sums{y (j)} M j=1, which can be expressed as
Here the retraining the sensor values x in the sink node is done such as OMP [8], CoSaMP [9], AMP [10] or CS [11]. The sink node broadcasts a random seed to the entire network from this global seed where each sensor then generates its own seed based on its unique ID. As the pseudo-random number generator is pre-installed on every sesnor the sensing coefficients are generated.
International Journal of Recent Scientific Research Vol. 9, Issue, 1(K), pp. 23675-23679, January, 2018
Semantic Approach to Home Automation
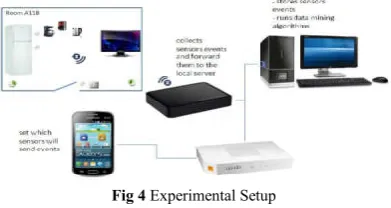
Here [12] they have discussed about the variety issues such as incompatible data formats, non-alignment of data structures and inconsistent data semantics. it is mainly focussed on Smart Home Automation provided with real time data. It enables the reasoning mechanism which would be conducted on the aggregated data through which presence, activities of people and abnormal situations are comparatively organized in an easy manner. Hence semantic technologies have been recognized for integrating database schema, data modelling and processing. Experimental setup of Home Automation
This approach has been setup in today’s home, as the experimental platform is of self-home automation solution called Home live [13]. This technology enables people to use their home appliances remotely. Here every smart device is named specifically .For E.g.: plugs are named MLPlug1, MLPlug2, MLPlug3, MLPlug4 and MLPlug5. Hence these devices are wirelessly connected through the Z-wave wireless technology[16]. The Home Automation Box (HAB) serves as a dedicated gateway which further makes it possible to access these devices from their unique IP as shown in above fig 3. This collects all devices events and forwards them to the local server which will handle the aggregation and interpretation of data. Such devices are formatted in json, following a fixed “key-value” schema.
Fig 4 Experimental Setup
From this comprehensive event description which consists of 10 key value pairs, we will mainly keep the following four; Timestamp is the date the event was received by the HAB. It is expressed as the number of seconds elapsed since it has been installed.
Name is the name of the device. As mentioned earlier it is that type of sensor could be identified from its name. For instance we know from the name MLPlug1 that the event has been issued by a smartplug.
Variable is the physical parameter that the event is about. In the event this parameter is the current electrical power consumed by the appliance it supplies.
{
“device id”: “22”,
“device Type”: “Binary light”, “homelive”: “47122383”, “id”: “3”,
“name”: “A118”, “room”: “A118”,
“service”: “EnergyMetering”, “timestamp”: “1428595051”, “variable”: “Watts”,
“value”: “45” }
The above definitions of the keys are necessary for the reader to understand what the values associated to these key mean, although the name of the keys have been chosen in a way that the reader would have figured out these definitions easily by himself. For an information processing system to correctly interpret an event, the meaning should be made explicit and even be embedded in the representation itself. Adapting semantic modelling technologies opens up an avenue of user experience improvements. Aggregating information in the picture makes it possible for occupants to converse with their home with questions such as “what is the temperature in the kitchen?” This query would be decomposed into looking up all devices located in the kitchen (device location) then identifying which of those devices is the thermometer (device function) and finally retrieving the current temperature measured by this device.
SIEM systems with Internet of Things
To analyse security of IoT using data receiving from the IoT devices, they proposed to use a concept of SIEM system that controls data from all nodes in the network.
SIEM system to IoT features causes integration issues as follows,
1. Data volume minimization.
2. Ensuring integrity of data transmitted to SIEM system. 3. Guaranteed data delivery from IoT devices to SIEM
system.
This paper [17] reviews proposed solutions for each of the above issues. To reduce the dimensionality of transmitted data it is suggested to use aggregation of messages on remote nodes in the framework of similar clusters. It is needed to decrease the throughput for the devices next to the SIEM system because low capacity devices cannot transfer large amount of data. For data integrity it is proposed to use digital signatures. To strictly ensure delivery of data to the SIEM system we review a method of constructing a safe route in DVT based on bio inspired swarm algorithm.
Guaranteed Data Delivery
Swarm algorithms represent a class of bio inspired algorithms based on interaction of a large numberof simple, shallow, agents. Pheromone level is set for each neighbour and is adjusted during a session. The pheromone can be positive, what means that the node can be used for data sending and for getting messages about pheromone level changing from it. Pheromone can also be negative, what means that devices should not send data through that node (they can send data through that node if there are no neighbours with positive level of pheromone). Also messages about pheromone level changing are not taken from the neighbours with a negative level of pheromone. Negative pheromone can destroy positive pheromone.
response time is increased, the timer of obsolescence is not reset, and the reference value of time is set as the average time between the old reference value and the new received value. If the selected node has a positive (not the highest) pheromone level, then the time during which a reply was received from the SIEM system is measured. If it is less than or equal to the reference value, the reference time is changed to new, pheromone level of device increases; the timer of obsolescence is set on the maximum value. If the answer is greater than the reference time, the reference time does not change; the timer of obsolescence value is set at half of the maximum value. If the selected node has negative pheromone level (this is possible only if there are no nodes with positive and neutral pheromone level), and a response was received from the SIEM system, the reference time value is changed to a new, and the pheromone level value is set to the neutral.
The device generates negative pheromone in one of three cases:
1. There was received a message from SIEM system that the data was not aggregated.
2. There was not received a message from SIEM system. 3. There was received an incorrect message from SIEM system (or message about substitution of the signature).
Thus To reduce traffic amounts there has been proposed a method of data aggregation and devices clustering. To protect data transmitted in the DVT there was suggested a utilization of digital signing that can be implemented both on the devices and on the devices which perform data aggregation. Since the integrity of the data does not guarantee that data will be delivered, the paper has proposed a method for constructing a safe route based on swarm algorithms. This method can quickly exclude the devices which do not pass traffic.
Surveyed Parameters
IoT is the future of technology which will decide how we control and interact with our day to day devices and make them work more efficiently. The main problem with IoT is improper use of power, non-standards addressing scheme and lack of security. Our problem is to overcome and remove all these drawbacks. The surveyed parameters are as discussed below; Techniques
IoT based network: as hash based addressing scheme is used this will reduce total number of byte thereby developing data aggregation to reduce power consumption. Kerberos based security system is developed for authentication of user. E.g.: AWS Elastic Beanstalk, it is offered by Amazon Web Service. The AWS Elastic Beanstalk makes the job easy for developers to quickly manage application in the cloud. As developers simply upload their application and AWS automatically handles the deployment details of capacity provisioning, auto scaling, load balancing etc.
Fig 5 AWS Elastic Beanstalk
Self Home Automation - as the smart devices are given unique name and ID and are connected through wireless technology, which provides for faster and efficient data aggregation. This reduces data packet loss and every information is efficiently routed to the destination.
Compressed Sensing - the information is passed to the first node which then passes it to the next node with the relayed information and its own information. Eg: Air Pollution monitoring system, randomly the units of data are being transmitted from each sensor and the data are recovered at the joint decoder. As the measurements are sent directly from the sensor to the sink node unbalanced battery consumption is in large hence multi-hop transmission is used to balance the power consumption.
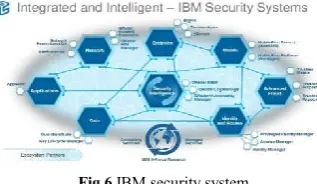
SIEM - it mainly arrives to detect, investigate and to react to security incidents like intrusion detection/prevention systems, firewalls etc. The problem which is said to be arising here is about security in computer networks, hence the dynamically organized network might be subjected to some specific computer attacks, and hence this method is used. Eg : IBM (QRADAR) , it is a security intelligence platform helps organization streamline attack detection respond to incidents faster and make security analysts job easier. McAfee (Nitro Security), it delivers accurate intelligence and integrations to investigate and respond to threats.
Fig 6 IBM security system
Power Consumption/Bandwidth
Threshold based aggregation [1] Threshold based aggregation - this enables efficiency in network congestion and reduces power consumption to large extent. As each device ID is first hash and then used for device tracking and control.
Smart Energy Devices - the data is compared, correlated and merged that conclusion of this which better matches people’s needs and requirements. Hence efficiency of power is less used compared to other techniques.
Multi-hop transmission - the data is transmitted only once to the node which in turn passes the data further to the neighbouring nodes thereby reducing bandwidth. Reducing the bandwidth which automatically reduces large power consumption.
SIEM - as it provides only for security purposes no power consumption is discussed here.
Network Heterogeneity
Cloud Computing - important quality of cloud computing is aggregation data into data centres. The present cloud services (Iaas, Paas, Saas) takes in better execution, as we use ANEKA (platform as a service) the data here is efficiently analysed. Smart Home Automation - the devices in home automation communicate with every other device within the range. The
Create application/upl
oad version
Deploy to environment
International Journal of Recent Scientific Research Vol. 9, Issue, 1(K), pp. 23675-23679, January, 2018
network efficiency is increased as the system finds a path to the destination. Advantage of this is that if a device is turned off in the signal path the network simply finds an alternative route to the destination. Hence it is user friendly and provides fast data processing.
Compressed Sensing - take incoherent measurements at each sensor, reconstruct/process jointly at destination. As large reduction in sampling and computation costs for sensing signals that have a compressible representation. We can reduce the number of measurements that need to be stored. This makes signal processing and reconstruction much simpler..
SIEM - a forensics investigation data represents the digital fingerprints of all activity that occurs IT infrastructure, it can be mined to detect security, operations and regulatory compliances problems.
CONCLUSION
Main goals of data aggregation technology are to avoid redundant transmission of packets to minimize energy consumption and to eliminate more attacks and increase the packet delivery ratio. [1]The main object of it is allowing users to get information, knowledge and reasoning ability from sensor data by using the power of cloud computing and to achieve that in a scalable way. [2] As the proposed data aggregation it is said to be well suited for large -scale IoT- based applications. It efficiently exploits the inter and intra source correlations among multiple correlated sources.[12] while considering our home, our car the city Aggregating devices information into the picture makes it possible for occupants to converse with their home. Hence from the above surveyed parameters the most adaptable technique which overcomes all the issues discussed is compressed sensing and ANEKA data addressing.
References
1. U.S. Thakare, S.M. Borkar,” Implementation of WSN’s Device Addressing , Data aggregation and secure control in IoT Environment”, IEEE Trans, Vol .5, 2017.
2. EvangeelosZimos, Joao F.C. Mota, Miguel R.D. Roadrigues and Nikos Deligiannis,” Internet Of Things Data Aggregation Using Compressed Sensing With Side Information”, IEEE Trans, 2016.
3. D. Baron, M. F. Duarte, S. Sarvotham, M. B. Wakin, and R. G. Baraniuk, “An information-theoretic approach to distributed compressed sensing,” in 45th Annu. Allerton Conf. Commun., Control, and Computing, 2005.
4. J. F. C. Mota, N. Deligiannis, and M. R. D. Rodrigues, “Compressed sensing with prior information: Optimal strategies, geometry, and bounds,” [Online]. Available: http://arxiv.org/abs/1408.5250, 2014.
5. J. F. Mota, N. Deligiannis, and M. R. Rodrigues, “Compressed sensing with side information: Geometrical interpretation and performance bounds,” in IEEE Global Conf. Signal and Inform. Process., 2014, pp. 512-516.
6. J. Haupt, W. U. Bajwa, M. Rabbat, and R. Nowak, “Compressed sensing for networked data,”IEEE Signal Proces. Mag., vol. 25, no. 2, pp. 92-101, 2008.
7. C. Luo, F. Wu, J. Sun, and C. W. Chen, “Efficient measurement generation and pervasive sparsity for compressive data gathering,” IEEE Trans. Wireless Commun., vol. 9, no. 12, pp. 3728-3738, 2010.
8. J. Tropp, A. C. Gilbert et al., “Signal recovery from random measurements via orthogonal matching pursuit,” IEEE Trans. Inf. Theory, vol. 53, no. 12, pp. 4655-4666, 2007.
9. D. Needell and J. A. Tropp, “CoSaMP: Iterative signal recovery from incomplete and inaccurate samples,” Appl. Computational Harmonic Anal., vol. 26, no. 3, pp. 301-321, 2009.
10. [D. L. Donoho, A. Maleki, and A. Montanari, “Message-passing algorithms for compressed sensing,” Proc. Nat. Academy Sci., vol. 106, no. 45, pp. 18914-18919, 2009. 11. D. Baron, S. Sarvotham, and R. G. Baraniuk, “Bayesian
compressive sensing via belief propagation,” IEEE Trans. Signal Process., vol. 58, no. 1, pp. 269-280, 2010.
12. FanoRamparany, Quyet H. Cao, “A Semantic approach to IoT Data Aggregation and Interpretation Applied to Home Automation”, 2016.
13. “Homelive: Confortetdomotique, maison connecte´e,” http://homelive.orange.fr.
14. M. Lenzerini, “Ontology-based data management,” in Proc. of CIKM 2011, 2011, pp. 5-6.
15. O. Hartig, C. Bizer, and J. C. Freytag, “Executing sparql queries over the web of linked data,” in The Semantic Web-ISWC, Springer Berlin Heidelberg. W3C Working Group, 2009, pp. 293-309, http://www.w3.org/2009/sparql/wiki/Main Page. 16. “Z-Wave: Home control,” http://www.z-wave.com. 17. Pete Zegzhda, Dmitry Zegzhad, Maxim Kalinin,
Alexander Pechenkin, Alexander Minin,DaniaLavrova, “ Safe Integration Of SIEM Systems With Internet of Things: Data Integration, Integrity Control and Bio Inspired Safe Routing”, IEEE Trans, 2016.
18. Zhao Anjun, YuJunqi, Li Zhijie, : Data Aggregation In Wireless Sensor Network For Structure Monitoring”, IEEE, 2009.
19. Fu-Zhao Sun, “Research Of Secure Data Aggregation In Internet Of Things”, IEEE, 2013.
20. B. Karp and H. Kung. GPSR: Greedy perimeter stateless routing for wireless networks. In Proc. of the ACM/IEEE International Conference on Mobile Computing and Networking (MobiCom), pages 243-254, 2000.
21. https://arxiv.org/abs/1103.2590
22. https://arxiv.org/ftp/arxiv/papers/0907/0907.4622.pdf.