*Corresponding author: Radha, P ISSN: 0976-3031
Research Article
A FIREFLY OPTIMIZED FEATURE SELECTION IN MULTIPLE TIME SERIES CLINICAL DATA WITH
MERGING STATISTICAL MEASURES AND WAVELET FREQUENCY SPECTRUM FOR HCC
RECURRENCE PREDICTION
Radha, P
1* and Divya, R
21
Department of Information Technology, Government Arts College (Autonomous),
Coimbatore, Tamilnadu, India
2
Department of Computer Science, Government Arts College (Autonomous),
Coimbatore, Tamilnadu, India
DOI: http://dx.doi.org/10.24327/ijrsr.2017.0809.0808
ARTICLE INFO ABSTRACT
Clinical data mining process helps the clinicians to provide diagnosis, therapy and prognosis of different diseases. A description of patient conditions should consists of the changes in and combination of clinical measures. The clinical outcome prediction has been increased by using multiple measurement data instead of using single measurement data. The multiple measurement data are gathered from different time period and dataset and it is very sensitive to analysis and predicts the disease. For prediction of Hepatocellular Carcinoma (HCC) disease, the multiple measurement data were merged by using merging algorithm and the distribution of data is determined by statistical measurement. Then those data are fed into the classifier to classify the data as patients with HCC and patients without HCC. In order to reduce the false prediction rate and to enhance the prediction rate, efficient methods are introduced in this paper. In this paper, frequency based measurement feature is calculated based on wavelet transform and it can be added as additional feature with multiple measurement data. Then, the optimal features are selected based on Firefly optimization algorithm which reduces the classification overhead. The selected optimal features are learned by using the Support Vector Machine (SVM) classifier to predict the patients with HCC and patients without HCC. The experimental results are conducted in terms of accuracy and balanced accuracy to prove the effectiveness of the proposed prediction method.
INTRODUCTION
In the data processing of the data mining technique, the varieties of data characteristics are one of the major issues because of two types of data are cross sectional data and time series data (Tseng et al, 2015). The cross sectional data are gathered by observing many features at the same time and the time series data are sequence of observations of a particular feature. In the clinical data analysis, the data processing techniques like data cleaning, data reduction, data integration and data transformation (Jacob and Ramani, 2015) are the most significant processes for handling both time series data and cross sectional data at the identical time which improve the quality of the data analysis.
The time series data consists of two types of data are single measurement data and multiple measurement data (Raj and Surya, 2016). In the single measurement data, features are
collected only once and the multiple measurement data are collected from different databases and at different time intervals. For clinical data analysis, multiple measurement data plays significant role than the single measurement data. For the prediction of HCC, Radio Frequency Ablation (RFA) was used where the multiple time series data were extracted from different datasets and cleaned. Then the merging algorithm was used to combine the time related from different time period and the statistical measures are measured for classification which is performed by different classifiers such as Multiple Measurements SVM [MMSVM] and Multiple Measurements Random Forests [MMRF]. The performance of the classifiers was optimized by grid search and cross validation process. But, the optimal time period to generate the time series data was needed to be automatically determined according to the characteristics of dataset used.
Recent Scientific
Research
International Journal of Recent Scientific Research
Vol. 8, Issue, 9, pp. 20015-20019, September, 2017
Copyright © Radha, P and Divya, R, 2017, this is an open-access article distributed under the terms of the Creative Commons Attribution License, which permits unrestricted use, distribution and reproduction in any medium, provided the original work is properly cited.
DOI: 10.24327/IJRSR CODEN: IJRSFP (USA)
Article History: Received 20th June, 2017
Received in revised form 29th July, 2017
Accepted 30th August, 2017
Published online 28th September, 2017
Key Words:
Hepatocellular Carcinoma, data mining, wavelet transform, Support
Wavelet Frequency Spectrum For HCC Recurrence Prediction
Hence, in this paper the optimal time period is selected by using the additional frequency based measurement feature which is measured by using wavelet transform function. The complexity is increased when more number of features is given as input to the classifiers. It can be reduced by introducing Firefly algorithm which selects the most optimal features from the dataset and it is given as input to the classifier. The classifier classifies the data as patients with HCC and patients without HCC. Thus this method reduces the false prediction rate and improves the prediction rate.
Khalilia, M., et al. presented a method for prediction of disease risk of individuals based on their medical diagnosis history. The Healthcare Cost and Utilization Project (HCUP) dataset is utilized to train Random Forest classifier for disease prediction. The HCUP is highly imbalanced dataset so an ensemble learning approach was employed based on the repeated random sub-sampling. While dividing the data into multiple sub samples through ensemble learning, it was ensured that the sub-samples are fully balanced. But still the accuracy of this method is poor.
Guftar, M., et al. presented a novel framework for prediction of possible causes of syncope disease. The main intend of this proposed framework was to extract the hidden information from the unstructured patient records in the form of medical reports. k-means clustering algorithm was applied on the pre-processed syncope dataset to extract all useful patterns and features. This method helps in categorizing the new comer patient with a syncope attack in which cluster and doctor can proficiently treat the patients. But this method is tested on small dataset and it is not efficient for large dataset.
Eslami, E., & Eftekhari, M. combined a Particle Swarm Optimization (PSO) and Support Vector Machine (SVM) to improve the classification accuracy and feature selection process. The proposed optimization mechanism, simultaneously select the most relevant features in the dataset and tunes the SVM parameters for better classification. In this methodology, a new local search based on reinforcement algorithm was used to get optimal feature subset. The SVM parameters such as penalty parameter C and gamma in RBF kernel function were tuned by the optimization algorithm. It increased the speed of convergence to the global optimum.
Chen, Z. et al. proposed a new model for multiple time series based on data mining techniques. Initially multiple time series data were transformed to multiple event sequences and then they were synthesized into one event sequence. Then the observation was generated to mining the temporal pattern and the rules based on the interval temporal logic. In addition to that, a algorithm was proposed to mine the online frequent episodes and to mine the change of patterns on mass event sequences.
Liu, X., & Tang, J. proposed a new feature selection method for effective feature selection process. In this method Support Vector Machine based recursive feature elimination (SVM-REF) was integrated with a normalized mutual information feature selection (NMIFS). In addition to that, a fuzzy c means (FCM) with a spatial information constraint was integrated into the proposed level-set based segmentation method. Then the proposed feature selection method balances the relevance and
redundancy in feature selection and it improved the classification accuracy. The dataset used in this method does not contain important information about invasive ductal carcinoma, cysts, ductal carcinoma in situ, fibroadenomas, etc., that may affect the performance of classification.
Kanarachos, S., et al. proposed an algorithm to detect the anomalies in time series data. This algorithm is the combination of wavelet analysis, neural networks and Hilbert transforms. Initially the time series data were decomposed into multiple data which removed the noisy data in the dataset. Then the neural network was applied to classify the data. Hilbert transform was utilized to derive the analytical representation of data. This can detect the defects in those data. Dürichen, R., et al. proposed a new method using multi task Gaussian Process (MTGP) to model multiple correlated multivariate physiological time series simultaneously. It is a flexible framework which learn the correlation within the multiple data even though they might be sampled at different frequencies and having different training sets available for different intervals. In addition to that, prior knowledge of any relationship between the time series such as temporal behavior and delays can be easily integrated. To allow interpretation of the different hyper parameters utilized in MTGP a novel normalization was proposed.
Ghalwash, M. F., & Obradovic, Z. proposed a method called as Multivariate Shapelets Detection (MSD) for early and patient specific classification of multivariate time series data. In this method, time series patterns were extracted named as multivariate shapelets from all dimensions of the time series which distinctly manifest the target class locally. The time series were classified by searching for the earliest closest patterns. This method was proposed for early classification task. But this method doesn’t consider the time stamp of data.
MATERIALS AND METHODS
In this section the proposed HCC recurrence prediction in multiple time series data with merging statistical measures of advanced frequency spectrum of time features is described in detail. Initially the liver patient dataset is collected around the area of Tirupur at the time of 7, 17, 21, 60, 90 and 120 days. This database includes Laboratory Information System (LIS), Hospital Information System (HIS) and Radiology Information System (RIS) databases. The data in the databases are given as input and the multiple features from the datasets at similar time period are combined together using merging algorithm. Then, the statistical measure and frequency measure of each data is measured by using wavelet transform function and the most relevant features in the dataset are selected by using firefly algorithm (Emary et al, 2015). Finally the optimal features are given as input to the MMSVM which classify the data as patients with HCC and patients without HCC disease.
Merging Algorithm for Multiple Time Series Data
Statistical Measurement and Frequency Measurement
The merged data by merging algorithm is considered into statistical measurement and frequency measurement. In statistical measurement the values are computed to find the distribution of data in each time period. The distribution of data is computed by using Pearson’s correlation coefficient. While merging multiple time series data some valuable information may be lost and it may partly retain from statistical measure. In frequency measurement, the time series data are transformed into frequency domain and wavelet functions are utilized to decompose the data into multiple components and it can be reconstructed without losing of original information in the data. From the wavelets, the frequency of the data is computed and it is added as additional feature with the merged database. Each time series data is uniquely represented in a wavelet expansion
= ∑ , , ( ) , (1)
where, , = 2 (2 − ): , ∈ generated by one mother wavelet ∈ ( ) and being an orthogonal basis of ( ),
∈ ( ) and , ( ) = 〈 , , 〉 are the wavelet coefficients. Observe that the Fourier transformed elements of the wavelets basic have the form Fourier transformed elements of the wavelet basis have the following representation
( ) = 2 (2 ) (2)
i.e., dilation by 2 in space domain represents to dilation by
2 in frequency domain and the translation represents to a phase shift. For a better frequency localization of the wavelet basis, the main intend is to build a wavelet basis that provides a partition of the frequency axis into disjoint frequency bands. Thus a partition can be ensured if the Fourier transform of the dyadic wavelet has localized or even compact support and satisfies the following condition is
∑∞ | (2 )|
∞ = 1 (3) The above condition ensures the typical wavelet property (0) = ∫∞∞ ( ) = 0. Thus the wavelet and statistical measurement features are obtained and these features are added as additional feature for prediction of HCC recurrence.
Feature Selection and Classification
By adding additional features with the dataset the complexity of HCC recurrence prediction gets increasing. In order to avoid such complexity, an efficient optimal feature selection is introduced. The firefly algorithm is used to select the most optimal features in the dataset which is the representative of the whole dataset. The population of the fireflies is initialized and then initially each firefly in the population randomly selects the features. Each firefly has two significant characteristics like variation in light intensity and formulation of the attractiveness. Here, the classification accuracy is considered as objective function which is represented as f(x) and the intensity of each firefly is defined as,
( ) = max( ( )) (4)
The attractive function of each firefly is computed as follows:
( ) = . (5)
where, represents the attractiveness at distance r=0. The light absorption coefficient is calculated as = where is termed as the characteristics length scale in an optimization problem. The distance between two fireflies such as i and j at position and is computed based on the Cartesian distance. It can be mathematically represented as,
= − = ∑ , − , (6)
In the above equation 7, , denotes the component of the spatial coordinate of the firefly. The movement of firefly to the firefly which has more attractiveness is described as,
= + − + − ⊕ (7)
In the above equation 8, ~ = , 1 < ≤ 3. where the first term represents the current position of the firefly and the second term denotes the attractiveness of the firefly i and j. The third term denotes the randomization through the Levy flights where is considered as randomization parameter. The − , ∈ [0,1] is utilized for providing the random sign or direction in which the random step length is obtained from the Levy distribution with infinite variance and mean. Each firefly moves towards the firefly which has high classification accuracy. Based on the attractiveness of the fireflies, the optimal features in the dataset are selected.
Then optimized features are given as input to the Support Vector Machine (SVM) classifier to classify the data as patients with HCC and patients without HCC. In the SVM, the training set of instance label pairs are considered as ( , )
whereas ∈ , {1, −1}, = 1,2, … , . The kernel function of SVM is given as
,, = exp ( || ,− ||) (8) SVM classifies the data by finding an optimal hyper plane through solving the optimization problem which is given as follows:
( ) =< . > + (9)
Minimize: <w.w> +c∑ η
Subject to: (< . > + ) +η − 1 ≥ 0 (10)
In the above equation 11, η represents the slack variable and it is greater than 0 and c represents the penalty parameter. Based on this optimization problem, SVM detects the hyperplane that provides the minimum training errors. The detected hyperplane effectively classify the data as patients with HCC and patients without HCC.
Algorithm
Input: Liver cancer dataset, HIS, LIS, RIS dataset
Output:Patients with HCC and Patients without HCC
1. Get the records from the dataset and time for specific event
Wavelet Frequency Spectrum For HCC Recurrence Prediction
3. Initialize the merged records array based on time and features
4. For each record in the dataset
5. =
6. Get the value each feature nearest to the specific event time period i
7. Assign the value for each record as the most recent values
8. End for
9. Determine the frequency measurement for each data in the merged record
10. For each and every data in the record 11. Convert the data into frequency domain
12. Calculate the frequency of data in each feature by using wavelet function
13. Determine the statistical measure for each feature from the merged record
14. For each time period and each time related features 15. Determine the maximum, minimum, average, standard
deviation, Pearson’s correlation coefficient, slope of trend line of each feature in the record before specific event
16. Include all measured features as additional features into the merged record
17. Initialize the number of fireflies , = 1,2, … ,
18. Assign the objective function ( ), = 1,2, … ,
19. For each firefly
20. Compute the light intensity ( ) = ( )
21. Define light absorption coefficient
22. ℎ ( < )
23. = 1:
24. = 1:
25. > ( )
26. Change attractiveness with distance through 27. Move firefly to firefly through Levy flights 28. Compute new solutions and update the light intensity 29. End if
30. End for j 31. End for i
32. Sort the fireflies and find the current best 33. End while
34. Obtain the optimal features and provide tuned features as input to SVM
35. Identify the right hyperplane by using the equation (9) 36. Compute minimum training errors using the equation
(10)
37. Classify the data and predict the HCC recurrence
RESULTS AND DISCUSSION
In this section, the experimental results are conducted in the dataset which is collected around Tirupur location at a time of 120 days which consisting of LIS, RIS and HIS. The LIS dataset consists of 152 records with different attributes such as Alkaline Phosphatase (ALP), Albumin, Bilirubin, Gamma-Glutamyl Transpeptidase (GGT), Alanine Amino Transferase (ALT), Aspartate Transaminase (AST) and Creatinine. The RIS consists of 152 records with attributes such as tumour size and tumour number. The HIS consists of 152 records with attributes such as sex, age, height, weight and status of Cirrhosis. The
performance of the proposed multiple time series classification method is analyzed in terms of accuracy and balanced accuracy.
Accuracy
Accuracy is defined as the fraction of true outcomes such as such as both true positives and true negatives among the total number of cases examined. It is mathematically represented as:
Accuracy = True Positive + True Negative
True Positive + True Negative + False Positive + False Negative
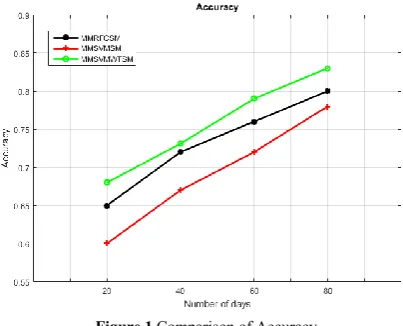
Figure 1, shows the comparison of accuracy between accuracy with different time intervals and different methods such as MMSVM with Statistical Measure (MMSVMSM), MMRF Classifier with Statistical Measure (MMRFCSM) and MMSVM with Wavelet Transform and Statistical Measure (MMSVMWTSM). X axis represents the number of days and Y axis represents the accuracy value. From the figure 1, it is proved that the proposed MMSVMWTSM has better accuracy than the other techniques.
Balanced Accuracy
Balanced Accuracy is referred as the average of specificity and sensitivity values. It can be represented as:
= Speci icity + Sensitivity 2
Figure 2, shows the comparison of balanced accuracy between accuracy with different time intervals and different methods
Figure 1 Comparison of Accuracy
such MMSVMSM, MMRFCSM and MMSVMWTSM. X axis represents the number of days and Y axis represents the balanced accuracy value. From the figure 2, it is proved that the proposed MMSVMWTSM has better accuracy than the other techniques.
CONCLUSION
In this paper, the multiple time series clinical data processing is improved by adding one more feature called as frequency measurement feature and the efficient feature selection process. The frequency measurement feature is calculated by using wavelet transform and the optimal features in the dataset are selected by using firefly algorithm. This proposed method reduces the time consumption during data classification. In addition to that, the additional features improve the classification performance. Then the selected optimal features are given as input to the SVM for classification. Hence, the proposed system predicts the patients with HCC and patients without HCC more accurately. The experimental results show that the proposed MMSVMWTSM approach has better performance in terms of accuracy and balanced accuracy than the other approaches.
References
Tseng, Y. J., Ping, X. O., Liang, J. D., Yang, P. M., Huang, G. T., and Lai, F. (2015). Multiple-time-series clinical data processing for classification with merging algorithm and statistical measures. IEEE journal of biomedical and health informatics, 19(3): 1036-1043.
Jacob, S.G., and Ramani, R. G. (2015). Data Mining in Clinical Data Sets: A Review. International Journal of Applied Information Systems,4(6):15-26.
Raj, P., and Surya, S. R. (2016). Multiple-Time-Series Clinical Data Processing for Classification: A Review. International Journal of Computer Applications, 133(13): 1-3.
Khalilia, M., Chakraborty, S., & Popescu, M. (2011). Predicting disease risks from highly imbalanced data using random forest. BMC medical informatics and decision making, 11(1): 51.
Guftar, M., Ali, S. H., Raja, A. A., & Qamar, U. (2015). A novel framework for classification of syncope disease using K-means clustering algorithm. SAI Intelligent Systems Conference (IntelliSys) IEEE, 127-132.
Eslami, E., & Eftekhari, M. (2014, October). An effective hybrid model based on PSO-SVM algorithm with a new local search for feature selection. In Computer and
Knowledge Engineering (ICCKE) 4th International eConference on IEEE, 404-409.
Chen, Z., Yang, B. R., Zhou, F. G., Li, L. N., and Zhao, Y. F. (2008). A new model for multiple time series based on data mining. Knowledge Acquisition and Modeling, 2008. KAM'08. International Symposium on IEEE, 39-43. Liu, X., and Tang, J. (2014). Mass classification in
mammograms using selected geometry and texture features, and a new SVM-based feature selection method. IEEE Systems Journal, 8(3): 910-920.
Kanarachos, S., Mathew, J., Chroneos, A., and Fitzpatrick, M. (2015). Anomaly detection in time series data using a combination of wavelets, neural networks and Hilbert transform. Information, Intelligence, Systems and Applications (IISA), 2015 6th International Conference on IEEE, 1-6.
Dürichen, R., Pimentel, M. A., Clifton, L., Schweikard, A., and Clifton, D. A. (2015). Multitask gaussian processes for multivariate physiological time-series analysis. IEEE Transactions on Biomedical Engineering, 62(1): 314-322. Ghalwash, M. F., and Obradovic, Z. (2012). Early
classification of multivariate temporal observations by extraction of interpretable shapelets. BMC bioinformatics, 13(1): 195.
Emary, E., Zawbaa, H. M., Ghany, K. K. A., Hassanien, A. E., and Parv, B. (2015). Firefly optimization algorithm for feature selection. Proceedings of the 7th Balkan Conference on Informatics Conference ACM, 26.
*******
How to cite this article: