Please cite this article as: R. Davarnejad, J. Azizi, J. Azizi, Prediction of Gas Hydrate Formation using HYSYS Software, International Journal of Engineering (IJE),TRANSACTIONS C: Aspects Vol. 27, No. 9, (September 2014) 1325-1330
International Journal of Engineering
J o u r n a l H o m e p a g e : w w w . i j e . i r
Prediction of Gas Hydrate Formation using HYSYS Software
R. Davarnejada*, Jam. Azizia, Jab. Azizib
a Department of Chemical Engineering, Faculty of Engineering, Arak University, Arak, Iran bDepartment of Chemical Engineering, Isfahan University of Technology, Isfahan, Iran
P A P E R I N F O
Paper history: Received 16 August 2013
Received inrevised form 28 April 2014 Accepted 22 May 2014
Keywords: Gas Hydrates HYSYS Peng-Robinson Simulation
A B S T R A C T
Gas hydrates attracted worldwide attention due to their potential as huge energy resource in the recent decades. Effective parameters which influence the formation of hydrates are high pressure, low temperature and water presence. HYSYS software is one of the major simulators which is widely used in chemical and thermodynamic processes.This research was conducted to simulategas hydrate formation of Lavan-3 gas well and Salman gas field using the HYSYS software. The steady state simulation of hydrate formationwas performed by the Peng-Robinson equation of state. The predicted data were compared with experimental ones. It was concluded that HYSYS is able to predict hydrate formation with the average absolute error of less than 1%. Two novel correlations were also developed to estimate hydrate formation conditions for natural gas.
doi: 10.5829/idosi.ije.2014.27.09c.01
1. INTRODUCTION1
Clathrate hydrates form when small ‘guest’ molecules (< 0.9 nm) such as methane or carbon dioxide contact water at ambient temperatures (less than 300 K) and moderate pressures (more than 0.6 MPa). The single small guest molecules are encaged by hydrogen-bonded water cavities in the non-stoichiometric hydrates [1].The water molecules in gas hydrates are linked to each other through hydrogen bonds to form a host lattice with polyhedral cavities that are large enough for small gas molecules such as methane, ethane, propane, carbon dioxide, and hydrogen sulphide [2]. There are three forms of hydrate structures: structure I for small molecules (such as methane and ethane), structure II for large molecules (such as propane and isobutene) and structure H. H hydrate requires a small molecule and a former agent such as methylcyclopentane. Most of H formers are not commonly found in the natural gas [3]. The cubic structure I predominates in the Earth’s natural environments, and contains small guests (0.4–0.55 nm).
1*Coresponding Author’s Email:
[email protected] (R. Davarnejad)
The cubic structure II generally occurs with larger guests (0.6–0.7 nm) in mostly man-made environments. The hexagonalstructure H may occur in either environment with mixtures of both small and large molecules (0.8–0.9 nm). The structure II was formed by the smallest hydrated molecules (such as Ar, Kr, O2 and N2) with diameters less than 0.4 nm. There is one guest molecule within each cage in three structures. It is possible to have multiple-cage occupied with small guests such as hydrogen or noble gasesat unusual conditions (very high pressures) [4].
Recently natural gas hydrates are treated as a potential energy resource. Large amount of methane gas is trapped in hydrate reservoirs [5]. Gas production from a hydrate-capped gas reservoir is governed by a
combination of heat transfer, fluid flow,
thermodynamics of hydrate decomposition, and kinetic decomposition of hydrates [6]. Gas from hydrates is produced by the depressurization, thermal stimulation, and inhibitor injection [7]. According to Kvenvolden’s research (1993), 1 m3 of hydrate dissociation at ambient conditions forms 164 m3 of natural gas and 0.8 m3 of water.
TABLE 1. Lavan-3 gas well fluid composition
H2S N2 CO2 C1 C2 C3 iC4 nC4 iC5 nC5 C6 C7 C8 C9
0.03 0.8 4.4 88.4 4.2 1.13 0.28 0.3 0.15 0.1 0.09 0.07 0.04 0.01
TABLE 2. Salman gas field fluid composition
H2S N2 CO2 C1 C2 C3 iC4 nC4 iC5 nC5 C6 C7 C8
2 1.9 3.8 71.2 10.4 6.44 0.9 1.96 0.51 0.56 0.24 0.08 0.01
There are several methods for hydrate formation prediction in natural gas systems [8, 9]. K-value method is a method which utilizes the vapor-solid equilibrium constants for hydrate formation [10]. Another method is obtained from the statistical calculations [11]. Katz (1945) also developed some plots based on the gas gravity [12]. The permissible expansion chart of natural gas can undergo without hydrate formation risk [13].
In this work, Peng-Robinson (PR) equation of state was chosen in the HYSYSsoftware (version 2006) to predict gas hydrate formation conditions. The predicted data were compared with the experimental onesobtained fromthe Salman gas field and Lavan-3 gas well.
2. MATERIALS AND METHOD
2. 1. Reservoirs Description The lavan gas well
was drilled in 1960s. Further drilling proved the existence of a gas field under Lavan Island where is at 18 km south of coastal line of the Persian Gulf (around 75.6 km2) with an estimated reserve of 6 TCF (Trillion Cubic Feet) of natural gas. The Salman field is at144 km south of Lavan Island in the Iranian section of Persian Gulf (located at Iran-Abu Dhabi border).The reservoirs compositions are shown in Tables 1 and 2.The related analyses are based on the UOP-9 and ASTM D-1945 methods.
2. 2. Applied Software HYSYS software (version
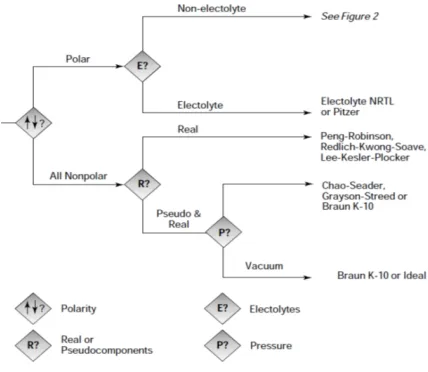
2006) was applied in the static mode. A suitable fluid package was chosen to satisfy all thermodynamic conditions indicated by laboratory results of gas hydrate formation. The schematic of this work is shown in Figure 1 [14].
2. 3. Equation of State (EOS) This essential first
step will affect all subsequent tasks in developing accurate physical properties in the simulation. Indeed, the choice of the physical property models for a simulation can be one of the most important decisions for an engineer. Several factors need to be considered, and no single method can handle all systems. Four factors are consideredduring the property methods selection. They are nature of the properties of interest,
composition of the mixture, pressure and temperature range, and availability of parameters.
Figures 2 and 3 are based on the four factors for property methods selection. They can be used when the chemical components and approximate temperature and pressure ranges are known [15].
Figure 1. The schematic of HYSYS simulation
Figure 3. Proceeding for polar and non-electrolyte components
Figure 4. Gas hydrate formation pressure versus temperature obtained from the experiment and HYSYS for Lavan-3 gas well
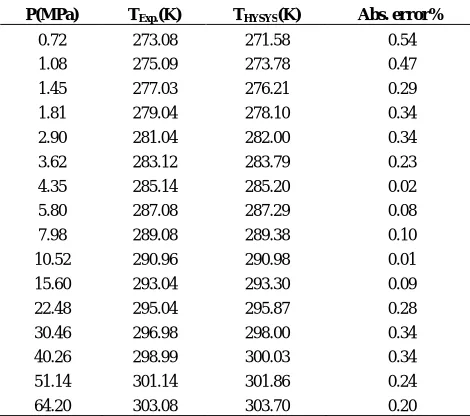
TABLE 3. Gas hydrate formation temperatures obtained from the experiment and HYSYS simulator for Lavan-3 gas well
P(MPa) TExp.(K) THYSYS(K) Abs. error%
0.72 273.08 271.58 0.54
1.08 275.09 273.78 0.47
1.45 277.03 276.21 0.29
1.81 279.04 278.10 0.34
2.90 281.04 282.00 0.34
3.62 283.12 283.79 0.23
4.35 285.14 285.20 0.02
5.80 287.08 287.29 0.08
7.98 289.08 289.38 0.10
10.52 290.96 290.98 0.01
15.60 293.04 293.30 0.09
22.48 295.04 295.87 0.28
30.46 296.98 298.00 0.34
40.26 298.99 300.03 0.34
51.14 301.14 301.86 0.24
64.20 303.08 303.70 0.20
TABLE 4. Gas hydrate formation temperatures obtained from the experiment and HYSYS simulator for Salman gas field
P(MPa) TExp.(K) THYSYS(K) Abs. error%
0.33 273.22 273.91 0.25
0.66 276.88 277.81 0.34
1.00 279.23 281.11 0.67
1.34 281.16 283.46 0.82
1.67 283.17 285.26 0.74
2.34 285.24 287.91 0.94
3.01 287.32 289.78 0.86
4.35 289.18 292.28 1.07
5.69 291.32 293.85 0.86
8.04 293.32 295.44 0.72
12.7 295.24 296.82 0.54
19.76 297.24 298.30 0.359
27.12 299.22 299.70 0.16
37.18 301.28 301.40 0.04
47.56 303.19 303.47 0.09
The Peng-Robinson EOS is the most popular equation of state for natural gas systems in the petroleum industry [17]. For oil, gas and petrochemical applications, the Peng-Robinson EOS is generally recommended as the property package. According to the HYSYS manual, the Peng-Robinson equation of state supports the widest range of operating conditions for various systems. The Peng-Robinson and Soave-Redlich-Kwong equations of state generate some of the required equilibrium and thermodynamic properties [18, 19].
3. RESULTS AND DISCUSSION
HYSYS predicted gas hydrate formation temperature at the same experimental pressure. Tables 3 and 4 compare the experimental data with the predicted ones. Figures 4and 5 show the hydrate formation temperature versus pressure. There is a good agreement between the predicted and experimental data. As shown in these figures, the predicted data were very close to the experimental ones in low temperatures. According to Equation (1), the absolute error for the present data was less than 1%.
Abs.error%=| .
. | × 100 (1)
As shown in Figures 4 and 5, pressure slowly increased with temperature increment along the low temperatures (270-295 K) while it sharply increased with temperature enhancement along the high temperatures (295-305 K) during the hydrate formation. According to this,
0 10 20 30 40 50 60 70
2 7 0 2 8 0 2 9 0 3 0 0
P(
M
PA)
T(K)
temperature enhancement is a more suitable way than pressure reduction for prevention of hydrate formation. Two novel correlations were developed to estimate hydrate formation conditions. The correlations were validated in the range of 0-70 MPa and 270-310 K.
P = 10 T −2 × 10 T + 0.1353T −
51.948T + 11223T −10 T + 6 × 10 (2)
P =−4 × 10 T + 6.1 × 10 T −4.3718t +
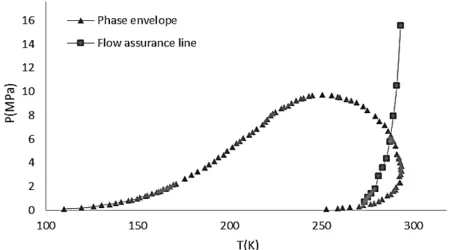
1676t −361327t + 4 × 10 t−2 × 10 (3) Equations (2) and (3) correlate the hydrate formation conditions for Lavan-3 gas well and Salman gas field based on the HYSYS data, respectively. For both correlations, R-square was very close to one (R2=0.990).Figures 6 and 7 show the phase diagram for hydrate formation (pressure versus temperature). As shown in these figures, hydrate can form in the single and two-phase areas. Since hydrate formation needs the lower temperatures and pressures in the two-phase area, hydrate formation is harder in the single-phase area (gaseous phase). Therefore, the easiest way for prevention of hydrate formation is temperature enhancement and single-phase area production.
Figure 5. Gas hydrate formation pressure versus temperature obtained from the experiment and HYSYS for Salman gas field
Figure 6. Depiction of phase envelope and flow assurance line for Lavan-3 gas well
Figure 7. Depiction of phase envelope and flow assurance line for Salman gas field
4. CONCLUSIONS
In this research, HYSYS software was appliedto predict gas hydrate formation. There was a good agreement between the simulated and experimental results.The absolute average errors were less than 1%. Two proper correlations were developed based on the predicted data obtained from the HYSYS. It was concluded that the HYSYS is an accurate and rapid tool to predict hydrate formation. The results showed that hydrate formation was easy at low temperatures because it should be assisted by low pressures while hydrate formation was decreased with temperature enhancement due to the need for high pressures. However, hydrate could form in the single and two-phase areas but, hydrate formation was more probable in the two-phase area because it needed lower temperatures and pressures. Therefore, temperature enhancement can form the single-phase area (gaseous phase) and prevent hydrate formation.
[1-19]
5. REFERENCES
1. Sloan Jr, E.D. and Koh, C., "Clathrate hydrates of natural gases, CRC press, (2007).
2. Zele, S., Lee, S.-Y. and Holder, G., "A theory of lattice distortion in gas hydrates", The Journal of Physical Chemistry B, Vol. 103, No. 46, (1999), 10250-10257.
3. Carroll, J., "Natural gas hydrates: A guide for engineers, Gulf Professional Publishing, (2009).
4. Mao, W.L., Mao, H.-k., Goncharov, A.F., Struzhkin, V.V., Guo, Q., Hu, J., Shu, J., Hemley, R.J., Somayazulu, M. and Zhao, Y., "Hydrogen clusters in clathrate hydrate", Science, Vol. 297, No. 5590, (2002), 2247-2249.
5. Klauda, J.B. and Sandler, S.I., "Global distribution of methane hydrate in ocean sediment", Energy & Fuels, Vol. 19, No. 2, (2005), 459-470.
6. Pooladi-Darvish, M., "Gas production from hydrate reservoirs and its modeling", Journal of Petroleum Technology, Vol. 56, No. 06, (2004), 65-71.
7. Moridis, G.J., "Toward production from gas hydrates: Current status, assessment of resources, and simulation-based evaluation 0
10 20 30 40 50
265 275 285 295 305
P(
M
Pa)
of technology and potential", SPEReservoirEvaluation
&Engineering,Vol. 12, (2009), 745–771..
8. Ghiasi, M.M., "Initial estimation of hydrate formation temperature of sweet natural gases based on new empirical correlation", Journal of Natural Gas Chemistry, Vol. 21, No. 5, (2012), 508-512.
9. Moshfeghian, M., "The pfgc equation of state at the age of fourteen", Pure and Applied Chemistry, Vol. 61, No. 8, (1989), 1405-1411.
10. Carson, D.B. and Katz, D.L., "Natural gas hydrates",
Transactions of the AIME, Vol. 146, No. 01, (1942), 150-158.
11. Van der Waals, J. and Platteeuw, J., "Clathrate solutions",
Advances in Chemical Physics, Vol. 2, (1959), 1-57.
12. Katz, D.L., "Prediction of conditions for hydrate formation in natural gases", Transactions of the AIME, Vol. 160, No. 01, (1945), 140-149.
13. Katz, D., Look ahead in gas storage technology., Univ. of Michigan, Ann Arbor.(1981)
14. Din, M.M. and Sadeg Zadeh Ahari, J., "Determination of suitable concentrations of H2O and CO2 in the feed of syngas
production", International Journal of Engineering, Vol.16 (2003), 21-28.
15. Carlson, E.C., "Don't gamble with physical properties for simulations", Chemical Engineering Progress, Vol. 92, No. 10, (1996), 35-46.
16. Plus, A., "Aspen plus user guide", Aspen Technology Limited,
Cambridge, Massachusetts, United States, (2003).
17. Peng, D.-Y. and Robinson, D.B., "A new two-constant equation of state", Industrial & Engineering Chemistry Fundamentals, Vol. 15, No. 1, (1976), 59-64.
18. Hill, A.E. and Malisoff, W.M., "The mutual solubility of liquids. Iii. The mutual solubility of phenol and water. Iv. The mutual solubility of normal butyl alcohol and water", Journal of the
American Chemical Society, Vol. 48, No. 4, (1926), 918-927.
Prediction of Gas Hydrate Formation using HYSYS Software
TECHNICALNOTE
R. Davarnejada, Jam. Azizia, Jab. Azizib
a Department of Chemical Engineering, Faculty of Engineering, Arak University, Arak, Iran bDepartment of Chemical Engineering, Isfahan University of Technology, Isfahan, Iran
P A P E R I N F O
Paper history: Received 16 August 2013
Received in revised form 28 April 2014 Accepted 22 May 2014
Keywords: Gas Hydrates HYSYS Peng-Robinson Simulation
هﺪﯿﮑﭼ
ﻒﻄﻌﻨﻣدﻮﺧﻪﺑارﯽﻧﺎﻬﺟﻪﺟﻮﺗيژﺮﻧاﻢﯿﻈﻋﻊﺑﺎﻨﻣﻦﯿﻣﺎﺗردﻻﺎﺑﻞﯿﺴﻧﺎﺘﭘﺮﻃﺎﺧﻪﺑيزﺎﮔيﺎﻫتارﺪﯿﻫﻪﺘﺷﺬﮔيﺎﻫﻪﻫدرد ﺪﻧاهدﺮﮐ
.
زاﺪﻧاترﺎﺒﻋيزﺎﮔتارﺪﯿﻫﻞﯿﮑﺸﺗيورﺮﺑراﺬﮔﺮﯿﺛﺎﺗﻞﻣاﻮﻋ
:
بآرﻮﻀﺣوﻦﯿﯾﺎﭘيﺎﻣد،ﻻﺎﺑرﺎﺸﻓ
.
راﺰﻓامﺮﻧ
دﺮﯿﮔﯽﻣراﺮﻗهدﺎﻔﺘﺳادرﻮﻣﯽﮑﯿﻣﺎﻨﯾدﻮﻣﺮﺗوﯽﯾﺎﯿﻤﯿﺷيﺎﻫﺪﻨﯾآﺮﻓردﻪﮐﺖﺳاﯽﯾﺎﻫزﺎﺳﻪﯿﺒﺷﻦﯾﺮﺘﻬﺑزاﯽﮑﯾﺲﯿﺴﯾﺎﻫ
.
رد
ناوﻻيزﺎﮔهﺎﭼرديزﺎﮔتارﺪﯿﻫﻞﯿﮑﺸﺗﻂﯾاﺮﺷﺲﯿﺴﯾﺎﻫراﺰﻓامﺮﻧزاهدﺎﻔﺘﺳاﺎﺑﺖﺳاهﺪﺷﯽﻌﺳﻖﯿﻘﺤﺗﻦﯾا
-3
ﻦﯿﻨﭽﻤﻫو
ﺎﻔﺘﺳاﺎﺑوﺎﯾﺎﭘﻂﯾاﺮﺷردنﺎﻤﻠﺳيزﺎﮔناﺪﯿﻣ ددﺮﮔﯽﺳرﺮﺑنﻮﺴﻨﯿﺑارﮓﻨﭘﺖﻟﺎﺣﻪﻟدﺎﻌﻣزاهد
.
ﻪﯿﺒﺷزاهﺪﻣآﺖﺳﺪﺑيﺎﻫهداد
زاﺮﺘﻤﮐهﺪﻣآﺖﺳﺪﺑيﺎﻄﺧوﺖﻓﺮﮔراﺮﻗﻪﺴﯾﺎﻘﻣدرﻮﻣﯽﻫﺎﮕﺸﯾﺎﻣزآﺞﯾﺎﺘﻧﺎﺑيزﺎﺳ
1
ﺖﻗدزانﺎﺸﻧﻪﮐﺪﺷهﺪﻫﺎﺸﻣﺪﺻرد
ﺖﺷادﻞﯿﮑﺸﺗﻂﯾاﺮﺷﯽﺳرﺮﺑردهرﺎﺷادرﻮﻣراﺰﻓامﺮﻧيﻻﺎﺑ
.
اﺮﺑﺪﯾﺪﺟيﻪﻟدﺎﻌﻣودنﺎﯾﺎﭘرد ﻞﯿﮑﺸﺗﻂﯾاﺮﺷﯽﻨﯿﺑﺶﯿﭘي
ﺪﺷدﺎﻬﻨﺸﯿﭘﯽﻌﯿﺒﻃزﺎﮔرديزﺎﮔتارﺪﯿﻫ