0 INTRODUCTION
The additive manufacturing technologies have become essential tools for modern industry [1] and [2]. Among the different additive manufacturing technologies, electron beam melting (EBM) is able to manufacture a wide range of metallic parts (massive, topologically optimized, lattice structure) [3] and [4]. Compared to selective laser melting (SLM), the EBM technology is still poorly studied [5]. However, there is a strong need to further master this technology. Aeronautic, spatial and also medical fields are particularly interested in mastering the quality provided by this process [6] to
[9].
In order to control the quality, without destruction of manufactured parts, test specimens are manufactured
simultaneously [10]. By testing those specimens,
information about the quality of manufactured parts is obtained. Design for Additive Manufacturing has been studied and provides some information (as swaying, supporting, etc.) for the manufacturing accuracy depending on desired shapes [11] and [12]. Most of the time, specimens are arranged in the edges of the manufacturing space. Previously, several parts showed defects when they were manufactured within certain areas of the manufacturing space. Thus, a question arises about the homogeneity of the manufacturing space. Indeed, heterogeneity could lead to errors in the
manufacturing and control processes. This key point that is not addressed in the literature, is the topic of this paper.
Does the position of a part in the manufacturing space have an impact on the final part quality? This problem is approached by studying the geometrical deformation which is the main defect. As defect already occur, there is a need to characterize this space and its heterogeneity, and the way it impacts on the manufactured parts. These characteristics are related to the machine used (described below), but the experimental method can be applied to other machines.
The scope of this study focuses just on the manufacturing space homogeneity. It won’t look after the effect of different electron beam set of parameters neither after the CAD effect on manufacturing quality. Parameters that guarantee the quality are known
[11] and [12], they are selected for this work and
maintained during the study.
1 METHOD
The method consists in manufacture several iteration of a part at different location and observe the differences between every iteration. The first objective of this study is to evaluate the impact of the position in the manufacturing space on the final workpiece
Manufacturing Space Homogeneity in Additive Manufacturing –
Electron Beam Melting Case
Piaget, A. – Museau, M. – Paris, H.
Alexandre Piaget – Matthieu Museau* – Henri Paris
Univ Grenoble Alpes, CNRS, France
This paper focuses on the manufacturing space homogeneity of the electron beam melting (EBM) technology. An Arcam AB A1 machine is used as tool for experimentations, with titanium (Ti-6Al-4V) as material. The objective of this study is to show the correlation between workpieces geometrical deformations and their position in the manufacturing space. Results show that the position on Z-axis does not affect quality, but there is a strong link in the Z-plane: significant defects appear near the manufacturing space boundaries. First manufactured layers are deformed in the vicinities of the manufacturing space edges. Up to 3 mm of material loss and 8mm of dimensional deformation are measured. Further analyses point that this phenomenon is particularly related to a sintering variation in the powder: there are up to 3 % density difference from the center to borders. To avoid the problem, reduction of the manufacturing space and a supporting strategy are proposed. Defects can also be removed by implementing thermal insulation on the machine or by modifying the beam operation.
Keywords: quality management, additive manufacturing, electron beam melting, manufacturing space homogeneity
Highlights
• The demonstration of the manufacturing space heterogeneity in the EBM case is presented.
• A new method to diagnose the heterogeneity of the manufacturing space and quantify its impacts is experimented. • The homogeneous area in the EBM manufacturing space is identified.
• A solution to manufacture parts out of the homogeneous area properly, using supports, is developed.
geometry. Thus, 25 locations of the manufacturing space will be tested during the experimentation.
For the experimentation, the largest manufacturing space available with the machine is needed. But the manufacturing space is limited by the use of software Magics® (Materialise), Build Assembler® (Arcam AB) that reduce the initial manufacturing space (200 mm × 200 mm × 180 mm) to 195 mm in length, 195 mm in width and 180 mm in height.
Otherwise, workpieces will be built without any supporting strategy. Indeed, EBM technology doesn’t necessarily involve a supporting strategy to build workpieces [13]. Based on Vayre et al. [11], there is no need to add support to the experimental workpieces because of the experimented workpieces thinness.
1.1 Design of Workpieces
Two kinds of workpieces have been selected for the test (Fig. 1). The first one is a massive workpiece. The second one is a lattice structure. Thus, those workpieces represent the two kinds of geometry cases encountered.
a) b)
Fig. 1. Experimentation workpieces; a)massive and b) lattice structure
The height and the diameter of the pipes are 30 mm. The thickness of the wall for the massive pipe and of the beam for the lattice one is 1 mm. Inside each pipe, two other pipes with different diameters (Ø20 mm and Ø10 mm) are integrated to the experimentation in order to have different thermal conditions. Indeed, the Ø10 mm workpiece always has a Ø20 mm and a Ø30 mm pipes for neighbors while the Ø30 mm workpiece has a number of neighbors depending on its position.
Those parts were designed and converted to stl files with SOLIDWORKS® 2015. The stl tolerance is 3 µm for the deviation parameter and 0.5 degree for the angle parameter.
1.2 Manufacturing Process
The Arcam AB A1 machine [14] and [15] uses an
electron beam to melt powder (Fig. 2). The powder from the hoppers is spread over a platform in 50 µm thick layers with a rake. The electron beam sinters the whole of the introduced powder. This increases the thermal and electrical conductivity. Then it locally melts the powder to manufacture the desired geometry. The platform finally goes down of the thickness of a layer and this cycle can be repeated. The accuracy of the electron beam is far lower than the size of the powder (~0.1 mm) [16].
Fig. 2. Arcam EBM systems, schematic architecture [11]
In order to qualify the geometric defect, some parameters have to be chosen. Ti-6Al-4V powder from Arcam AB is used for the study as it’s the most used
material in EBM [16]. Arcam theme melt 50 µm for
Ti-6Al-4V is selected for the whole experimentation. The experimentation consists in testing 25 locations of the manufacturing space. Grouped by three, workpieces will be repeated on each locations of a unique altitude of the manufacturing space in order
to avoid scan length problems [17]. By measuring
each workpieces, defects are characterized and linked to the location.
Our calibration process fits with ARCAM
recommendations [18] and was done before
manufacturing.
1.3 Measurement of Printed Workpieces
the objective is to measure the first layer distortion. Note that, as the lower part of the workpieces is analyzed, the workpieces are represented upside down later in the document.
In order to measure the first layer distortion, a three-dimensional optical control machine (Vertex from Micro-vu) is used. This equipment is able to focus on a specific point and calculate the height of this point from the focal range. The surface is controlled at 24 points (every 15 degrees) distributed all along the surface. The measurement precision is ± 9 µm. From this, we recovered the difference between the nominal height and the measured one (Fig. 3a).
a) b)
Fig. 3. Representation of the measurement processes: a) massive and b) lattice workpieces
Measuring the first layer deformation does not provide information on the deformation of the following layers. With the lattice structure, the target is to measure the defect spread through several layers. Consequently, the measurement protocol has to be adapted. A tool has been created to control the external geometry of the lattice pipe (Fig. 3b). This tool is a checking gauge calibrated to detect a ±10 % change in the shape of every cell of the part. Errors may occur depending on the surface quality and local deformation, in such case, the cell is also declared defective. This way, we may have information about the defect on the workpiece: its angular position and altitude.
2 RESULTS
Measures are presented in a radar chart in order to represent the size and the angular position of the defect. So, in the diagrams, the more a point is far from the middle, the more the defect is important. As shown in Fig. 4, defect occurs on some workpieces (on both pictures, the left workpiece fits the CAD model and the right one includes a deviation from the model). The defect is materialized in two forms: material loss and geometric deformation. Lattice structures show both failure (Fig. 4b): between the well-shaped and
the defective workpiece, deformations are observed in first layers (missing) and in diamond meshes (misshapen).
a)
b)
Fig. 4. a) Massive and b) lattice workpieces placed upside down
Fig. 5 presents the results for the massive workpiece. From these results, occurrences of defects on nearby workpieces of borders are observed. Furthermore, the defect is more critical as the point observed on a workpiece is close to the boarders. The biggest gap measured between the nominal and the manufactured surface is 3 mm high. Whereas, for the inner workpieces, measured defects are smaller than 0.8 mm. This value corresponds with the 50 µm roughness owned by the material resource [17].
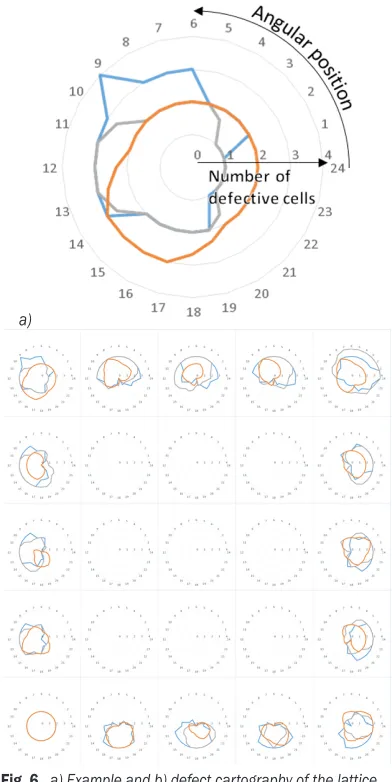
Fig. 6 presents results for the lattice workpieces in numbers of defective cells (±10 % change in the shape) for an angular position and starting from the bottom of a workpiece. The same conclusion can be drawn as there is no defect in the inner workpieces and the external workpieces have an outwardly directed defect. In addition, the highest number of defective cells for one angular position is four, it is equivalent to 8 mm high from the first layer.
Another interesting point is that a group of workpieces has undergone a 2 mm mechanical shifting (Fig. 7). The 3 corresponding curves are overlapping (located at the bottom left in Fig. 6) because workpieces cells are all affected in the same way.
What is interesting in this point is that it brings other elements to explain and understand the sources and consequences of the deformation phenomenon, although this shifting is not repeatable.
a) b)
Fig. 7. Photography of the 2 mm mechanical shifting: a) Ø30 mm, and b) Ø20 mm
Finally, observations and measures show that only the workpieces near the boarders of the manufacturing space are reached by the defects.
In corners, the defect reaches its highest value: the maximal height of the defect is 8mm from the first layer. Those defects are significant enough to justify a
thorough study with the aim to master and avoid this problem.
3 DISCUSSION
3.1 Hypothesis
To explain the phenomenon, several hypotheses have been expressed. First, the electron beam hypothesis has been selected. Indeed, to reach boarders, the electron beam has to undergo an important deflection that leads to change the shape of the beam from a circle to an ellipse. The energy broadcasted to the powder is lower as the surface of transmission gets bigger. It generates a decrease in the temperature that prevents the melting of the powder. This decrease a)
± 9µm
b)
Fig. 5. a) Example and b) defect cartography of the massive workpieces (blue: Ø30 mm, orange: Ø20 mm)
a)
b)
might explain the location of the defect and the defect type also.
The second hypothesis concerns the workspace in the machine. At the borders of the manufacturing space, next to the sintered powder, there are cold powder and the metal enclosure that might absorb the energy of the sintered powder and thereby generate a loss of temperature. As Ti-6Al-4V is a bad thermal conductor [19], this phenomenon might just take place at the border between the sintered powder and the cold powder. Lowering temperature locally leads to the same conclusion as the electron beam hypothesis.
A third hypothesis arises from the mechanical shifting (Fig. 7). As a portion of the workpiece has been moved in the rake direction, this hypothesis involves the rake: when the rake spreads the powder out, it can move the matter underneath by the thrust applied on the powders. That might cause deformation and matter loss in the workpiece.
The first and the second hypothesis might explain the difference between the workpieces but they don’t solve the matter shifting. On its side, the third hypothesis elucidates the shifting but there is no reason for the non-homogeneity of that phenomenon.
The hypothesis we kept is a combination of the previous ones: the contact area shape of the electron beam is circular on the powder bed center, but away from the center, it becomes elliptical and provides less energy to the powder. In addition, the energy leaks with the proximity to cold powders and metal enclosure. This makes the sintering of the powder weaker near the boarders. Then, the rake passage might easily move the poorly sintered powder and the molten material suspended in the powder. This might lead to a loss of material as well as deformation for the manufactured parts. In addition, the sintering weakness modifies the thermal conductivity, the cooling of the manufactured parts is no more homogeneous and it generates additional deformation.
3.2 Analysis
In order to validate the hypothesis, an analysis of the sintered powder is made. This analyze was conducted with an X-ray microtomography machine. The machine is able to reconstruct a 3D model of the studied sample with voxels. This reconstruction aims to display and measure the size of the necks binding in the sintered powder. A difference of necks size between the powders in the center and in the periphery of the manufacturing space would indicate a significant difference of the sintering [20].
The samples of powders are one centimeter side cube. This size allows observation of a large number of powder grain that limits the impact of defects in the powder. Due to the titanium opacity to X-ray, getting a 1µm resolution with titanium parts requires more power than supplied by the machine
[21]. Resolution has been reduced to 5 µm in order to provide a clear tomography of the samples. Despite a clear tomography, it becomes impossible to measure
necks because of the resolution. However, [20] show
there is a link between density and sintering progress with spherical powders. Thereby, measuring density permits comparison of the two samples sintering.
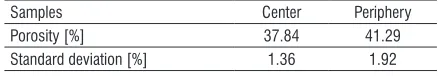
Table 1 presents the results of the analysis. With more than 3 % difference, assumptions about the difference of sintering are justified. Indeed, according
to OLMOS [20], 3 % are significant enough to make
a difference of sintering. This difference impacts the powder stiffness and its heat conductivity. This generates a harmful heterogeneity in the manufacturing space that might have bad effects on manufactured parts [22].
Table 1. Porosity measured from the tomography reconstruction
Samples Center Periphery
Porosity [%] 37.84 41.29
Standard deviation [%] 1.36 1.92
4 CONCLUSION
The observed defect has an impact on geometry of manufactured parts with EBM technology. According to their position, parts may undergo geometric deformation and matter loss. It can be inferred from this study that the manufacturing space is heterogeneous.
In the worst case, the 8 first millimeters are affected by this defect. The closest defect to the center is 86 mm distant from the center. The more the defect is far from the center, the more important it is. With this information, a first strategy can be used to bypass the defect. Indeed, creating supports 8 mm (or more) long all along the first layer permits to transfer the defect from the part to supports. A manufacturing space reduction to an 86 mm radius cylinder can also be a solution to avoid the defect apparition. Those 2 strategies have been validated with the workpieces.
As well, modification could be made to change the machine operation and more precisely the electron beam. By bringing more energy, the powder sintering would be homogenized. Improve the insulation of the powder bath with the machine will also limit the energy loss.
5 REFERENCES
[1] Gibson, I., Rosen, D., Stucker; B. (2015). Development of additive manufacturing technology. Additive Manufacturing Technologies, p. 19-42, DOI:10.1007/978-1-4939-2113-3_2.
[2] Gao, W., Zhang, Y., Ramanujan, D., Ramani, K., Chen, Y., Williams, C.B., Wang, C.C.L., Shin, Y.C., Zhang, S., Zavattieri P.D. (2015) The status, challenges, and future of additive manufacturing in engineering. Computer-Aided Design, vol. 69, p. 65-89, DOI:10.1016/j.cad.2015.04.001.
[3] Hrabe, N., Quinn, T. (2013). Effects of processing on microstructure and mechanical properties of a titanium alloy (Ti-6Al-4V) fabricated using electron beam melting (EBM), part 1: Distance from build plate and part size. Materials Science and Engineering: A, vol. 573, p. 264-270, DOI:10.1016/j. msea.2013.02.064.
[4] Novak, N., Vesenjak, M., Ren Z. (2016) Auxetic Cellular Materials – a Review. Strojniški vestnik - Journal of Mechanical Engineering, vol. 62, no. 9, p. 485-493, DOI:10.5545/sv-jme.2016.3656.
[5] Sing, S.L., An, J., Yeong, W.Y., Wiria, F.E. (2016). Laser and electron-beam powder-bed additive manufacturing of metallic implants: A review on processes, materials and designs. Journal of Orthopaedic Research, vol. 34, no. 3, p. 369-385,
DOI:10.1002/jor.23075.
[6] Daneshmand, S., Aghanajafi, C. (2012). Description and modeling of the additive manufacturing technology for aerodynamic coefficients measurement. Strojniški vestnik - Journal of Mechanical Engineering, vol. 58, no. 2, p. 125-133,
DOI:10.5545/sv-jme.2010.238.
[7] Waller, J.M., Parker, B.H., Hodges, K.L., Burke, E.R., Walker, J.L. (2014). Nondestructive Evaluation of Additive Manufacturing. National Aeronautics and Space Administration, Hampton.
[8] Budzik, G., Burek, J., Bazan, A., Turek, P. (2016). Analysis of the accuracy of reconstructed two teeth models manufactured using the 3DP and FDM technologies. Strojniški vestnik - Journal of Mechanical Engineering, vol. 62, no. 1, p 11-20,
DOI:10.5545/sv-jme.2015.2699.
[9] Petrovic, V., Haro, J.V., Blasco, J.R., Portolés, L. (2012). Additive manufacturing solutions for improved medical implants. Biomedicine, Lin, C. (ed.), InTech, DOI:10.5772/38349.
[10] CCT MAT – STR, CNES: (2016). PRINTtemps de la Fabrication Additive (Spring of Additive Manufacturing). Toulouse.
[11] Vayre, B., Vignat, F., Villeneuve, F. (2013). Identification on some design key parameters for additive manufacturing: application on electron beam melting. Procedia CIRP, vol. 7, p. 264-269, DOI:10.1016/j.procir.2013.05.045.
[12] Vayre, B., Vignat, F., Villeneuve F. (2012). Designing for Additive Manufacturing. Procedia CIRP, vol. 3, p. 632-637,
DOI:10.1016/j.procir.2012.07.108.
[13] Obaton, A.-F., Bernard, A., Taillandier, G., Moschetta J.-M. (2016). Fabrication additive: Etat de l’Art et Besoins Métrologiques Engendrés. (Additive manufacturing: state of the art and generated metrological needs) Revue Francaise de Métrologie, vol. 2016-1, n°41.
[14] Arcam AB (2016). Creating new opportunitites in design and production. From www.arcam.com/wp-content/uploads/ justaddbrochure-web.pdf, accessed on 2016-09-01.
[15] Arcam AB (2010). Arcam A1, the future in implant manufacturing. From http://www.arcam.com/wp-content/ uploads/Arcam-A1.pdf, accessed on 2016-09-01.
[16] Vayre, B. (2014) Conception pour la Fabrication Additive, Application à la Technologie EBM (Design for Additive Manufacturing, Application to the EBM Technology). PhD Thesis, University of Grenoble Alpes, Grenoble.
[17] Safdar, A. (2012). A study on electron beam melted Ti-6Al-4V. From http://lup.lub.lu.se/record/2543181, Lund University, accessed on 2016-08-25.
[18] Arcam AB (2011), Arcam EBM System, User Manual, A1 A2. Mölndal.
[19] Slotwinski, J.A., Garboczi, E.J., Stutzman, P.E., Ferraris, C.F., Watson, S.S., Peltz, M.A. (2014). Characterization of metal powders used for additive manufacturing. Journal of Research of the National Institute of Standards and Technology, vol. 119, DOI:10.6028/jres.119.018.
[20] Olmos, L. (2009). Etude du Frittage de Poudres par Microtomographie in situ et Modélisation Discrète (Study of sintering powders by in situ microtomography and discrete simulations). PhD Thesis. Institut National Polytechnique de Grenoble – INPG, Grenoble.
[21] Thiery, C. (2013). Tomographie à Rayons X (X-Ray Tomography). Techniques de l’Ingénieur, art. p950.
![Fig. 2. Arcam EBM systems, schematic architecture [11]](https://thumb-us.123doks.com/thumbv2/123dok_us/8948806.1858174/2.581.311.493.245.440/fig-arcam-ebm-systems-schematic-architecture.webp)