Rothamsted Experimental
Station Report for 1976, Part
2
Full Table of Content
Yields on the Exhaustion Land and Changes in the NPK
Content of the Soils due to Cropping and Manuring,
1852-1975
A. E. Johnston And P. R. Poulton
Yields on the Exhaustion Land and Changes in the NPK Content of the Soils due to Cropping and Manuring, 1852-1975 , A. E. Johnston And P. R. Poulton (1977) Rothamsted Experimental Station Report For 1976, Part 2, pp 53 - 85 - DOI: https://doi.org/10.23637/ERADOC-1-34447
Yiekls on the Exhaustion
Lanil
and ChaDg€sin
theNPK Coftent
of the Soils dueto
Cropping
ard
Manuing, 1852-1ns
A.
E. JOHNSToN and P.R.
PoULToNIntroduction
The Exhaustion Land experiment now compares yields of barley grown on soil without
P or
K
since 1852 with those on soils containing residues from PK manuring given during 185G1901. Few visitorsto
Rothamsted Farm faitto
appreciate the significanceof
the results which show that these residues, accumulated from dressings of either fertilisersor
farmyard manure
(FYM),
have doubled yields of barley during 1949-74 when adequarcN
was given. Soils enriched with residues gave yields at least equal to the average ofall
barley crops grown
in
Great Britain- The experiment, which occupies 1'01 ha on thenorth side of Hoosf.eld, derived its name in the early part of this c€ntury.
At
tiat
time unmanured cereal cropping, rvhich startedin
1902, measuredthe
residual effectsof
manures applied in previous experiments. Warren and Johnston (1960) gave reasons
for
starting the
ttree
experiments made between 1852 and 1901 and discussed the results. They also gave yields for the period 1902-53. This paper summarises the early experiments and gives some previously unpublished data. Yields andNPK
uptakes during 1949-74 are giyen in detail. we also discuss analyses ofthe soils includingI
N, and relate changesin total, soluble and isotopically exchangeable P and exchangeable
K
to the amountsof
these nutrients removed in the crops.
There are two Classical experiments on Hoosfi.eld and
in
both barley is now grown continuously; the Hoosfield Continuous Barley experiment startedin
1852 and what is now the Exhaustion Land experiment started in 1856. Because we make some comparisons between the two experiments we shall refer, in this paper, to the first experiment as the Continuous Barley experiment and to the second as the Exhaustion Land, even though on occasions we give results from the latter from before 1902.ExperimenB mrile b€tween 1852 antl 1901
1852-55.
The
'Iois
Weedon'plots.
This
experiment tested methodsof
husbandrysuggested by the Rev. Samuel Smith. On the heavy land ofhis small farm at Lois Weedon, near Towcester,
Mr.
Smith grew Iarge crops of winter wheat without using fertiliseror
manure. His f.elds were divided into 3
ft
wide strips which were alternately cropped and fallowed, cropping and fallowing being reversedin
succeeding years. OnIy three rowsof
wheat, at l2
in.
spacing, were drilled on the cropped strips, the fallow strips were inten-sively cultivated, especially the subsoils by double digging. Although Mr. Smith got good yields of wheat for that time, about 34 bushels acre-l (2'29tha'-l),
with this methodof
husbandry, yields
at
Rothamsted were lessthan
thoseon
continuously cropped un-manured soil on Broadbalk. Lawes and Gilbert were convinced that the difference was due to amounts of availableN in
the two soils. There was a difference in total Nin
the soils; that at Lois Weedon contained 0'154% N, that at Rothamsted 0'132% N but they knewthat
availableN
wasnot
necessarily relatedto
total
N.
These results, obtained recently by the Kjeldahl method, do not agre€with
those givenby
Lawes and Gilbert (1850, see p. 67.Recently we have determined total P and P soluble in 0'5u-NaHCOs solution inthe two
soils, samples of which
still
ex.ist. There was much moreof
bothin
the soilfrom
LoisWeedon:
Lois Weedon Rotbamlted
Total P(.) mg
krr
1080
494 NaHCOTP mg kgI
4l
l0(a) Determined by pe.chlo c acid diSestion; results given later in this paper for the Rothamsted soils were obtained by Na2CO3 fusion, which gives slightly larg€r values.
Lawes and
Gilbert
eventually ascertainedthat the Lois
Weedonsoil had only
been cultivated for a few years after a long period in permanent grass. This would explain whyit
contained more N and P. In addition, sufrcient N was probably mineralised each yearfrom soil organic matter to produce good yields
of
wheat when wheat and fallow were alternated.1856-75. The winter wteat exPeriment. Lawes and Gilbert superimposed four plots on the Lois Weedon treatments to test their conclusion that lack of N was responsible for the poor yields of wheat on Hoosfield and included equal areas of cropped and fallowed land
in each plot. They tested four treatments: unmanured, N only, PKNaMg and NPKNaMg,
which were identical with the treatments on plots 3, 10, 5 and 16 respectively on Broad-balk in 1856. N was given as ammonium N. Yields in 1856 on Hoosfield were very similar
to
thoseon
Broadbalk and led Lawes andGilbert
(1856)to
concludethat
adequate availableN
was more important than deep cultivationfor
wheat on Hoosfield. During the nextfour
years yields on Hoosfield and Broadbalk were much the same. Average yields of dressed grain,in
bushels acre-1, during 185G60, were:Unmanuled
N onlyHoosfield 16
29Broadbalk 16
24PKNaMg
NPKNaMSl8
37m35
Subsequently, yields on Hoosfield declined and the response to nitrogen diminished but
Lawes and Gilbert never commented on this difference between the
two
experiments.Field notes made annually show that
in
1870 the Hoosfield plots were veryfoul with
weeds. As competition from weeds increased wheat yields decreased and greater
eforts
to achieve satisfactory weed control \ryere probably made on Broadbalk. The crops sown
on Hoosfield
in
autumn 1870 andl87l
were so poor and weed infested that both were ploughed in in the following spring. Crops were harvested in I 873 and I 874 ; all plots were fallowedin
1875. Yieldsfor
tfuee five-year periods andfor
1873-:74 are summarisedin
Table
l.
TABLE 1
Yields of wheat on Smith's Wheat Plots, Exhaustion
Ia,
1 856-7 5Meatr annual yield of grain and straw, t ha-l, at 85 % dry matter
UnmaDured Amfiodum
sallts(.)
PI(NaMgG)
NPKNaMg{.)(plot
4)
(plot3)
(plotl)
(plot 2)Period
graio
straw
grain
straw
grain
stBw
grain
straw1855,60 t-12 t-16
1.97 3.34 l-23 l-94
2-51
4.62186l-65
0.72 1.09 1.27 2.03 0.95 1.34 2-54
3.961866-70 0'75 1.13 0.92 t.4l
0.93 1.40 t-44
2-311873-75(b)
108 2.O2 1.65 2-89 1.18 2-16 1-12
3.t0Toral in
17y€ats 15'll 23'94
24'lO
39'68
17'91
n'72
25'89
@'65(a) S.e Tablc 4 for fertiliscr dr€ssings
(b) Expcriment falowrd in 1871, 1872 aDd 1875 54
THE
EXHAUSTION
LAND,
1852_1975 187G1901. The potato experiment. On the north side of the wheat experiment a strip of unmanured wheat was grown each year during I 85G74.In
I 876tlis
striP was widened to makeit
almost the same width as the other four strips. The five strips were then halvedto
make ten plots on each of which potatoes were grown every yearfrom
1876to
1901. More fertiliser treatments were tested on the potatoes than on the wheat and a testof
farmyard manure
(FYM)
was introduced. Table2
shows theplot
numbers and treat-ments for the wheat experiment and the corresponding plot numbers and treatments Forthe potato experiment.
TABLE 2
Corresponding plot numbers afid trcatmefislat in the Smith's Wheat
(185G7,
and Potato (l 876- 190l)
experiments, Exhaustion LandPotato experiment
PKNaMg
N*PKNaMg
N*
FYM
UDmatrured
(a) See Table 4 for ful details of FYM and fertilis€r dressings ; N, arnmonium salts ; N*, sodium nitrate (b) Not included in the wheat exp€riment but cropped each yeai with wheat given no maDures
During the potato experiment the land was usually ploughed, probably only to about
12 cm, as soon as possible after the crop was
lifted
and then againin
spring.All
fieldwork
following spring ploughing was done as quickly as possible.First
the fertilisers were applied andin
some years theFYM
was also spread before the land was boutedinto ridges and furrows.
If
theFYM
was not applied before the ridges were madeit
was placedin
the bottomsof
the furrows. The potatoes were then planted by handin
the furrows,in
some years the seed was set directly on theFYM.
The ridges were then split back over the seed. Planting was usually inApril.
During the flrst six years
FYM
only,FYM
plus P andFYM
plus NP were tested on plots 2, 3 and 4 respectively. The same fertilser andFYM
treatments were also testedfor
mangolds, swedes and turnips on Barnf.eld after 1856 andFYM
plus NP was a treatment in the RotationII
experiment at Saxmundham which started in 1899 (Mattingly, Johnston&
Chater, 1970). Yields given byFYM
residues rvere measured on plot 2 which received no fresh dressingsofFYM
after 1881. After 1882FYM
only was applied on plots 3 and 4so the effect
ofFYM
residues, on plot 2, could be compared with thatofa
fresh dressing.Gilbert (1888) discussed the yields
for
the first two six-year periods and Warren and Johr:ston (1960) summarised yieldsfor
the remaining 14 years. Table 3 shows yieldsfor
three periods; treatment effects should be compared only
in
the
same period as the variety of potato grown changed during the experiment.During 1876-81 unmanured soil yielded
5'72tha-t
potatoes and PKNaMg fertilisers almost doubled yield, 10',10t
ha-r.
N
alone (96 kgN
ha-1) as ammonium or nitrateN
gave smaller yields, 6'30 and 8'04 t
ha-r
respectively, than the PKNaMg fertilisers. The effectsofN
and PKNaMg fertilsers on potatoes were quite different from those on winterwheat
on
Broadbalk.During
1872-81 wheat yieldson
unmanured,PKNaMg-
and N-treated soils were 0.72, 0'84 and l'20 t grainha-l
respectively (Garner & Dyke, 1969). Complete NPKNaMg fertilisers to potatoes, supplying 96 kg Nha-r
either asNHr-N
or NOg-N gave, on average, 19'21t
hl-l.
This yield wasnot
only above the national average atthat
time (15.42tha-r,
Gilbert,
1888)but
also 6'08t
ha-1 larger than the yield given byFYM.
Table 3 shows that adding P toFYM
had little efect but that when 96 kg N ha-1, as sodium nitrate, was also given yields were almost equal to those given byPKNaMg
NPKNaMS
N
UDmatrured
Ufinanur€d(n)
Plot
9
PPlot
7
NPKNaMg
PIot
5
NPlot
3
FYMPlot
I
UnmanuredPlot l0
Plot
8Plot 6
Plot 4 Plot 2 Wheat experiment
Plot I
Plot 2 Plot 3
Plot 4
TABI,E 3
Yields of potatoes got+n continuously, the Potato experiment, Exhoustion
Iand,
187G1901Mean ".Dnual yield of total tubels, t ba-r
1876-81 t882-87
1888-1901 5.726.30 8.04
9.9
10.40
18.88 19.54 13.t3 14.01 17.85
4.24 5.20
5.12 8.41
8 .51 14.92
13.86
7 .66 10.67
10.07
2.tt
2.99 4.24 4.80
5.45
l0
,lO1t .00
3.72
ll@
11 .90
(a) See Tables 2 add 4 for full details of FYM aDd fcrtilis€r dressings; N, ammonium salts; N*, sodium oitrate
(b) l87G8l, FYM: I882-1901, uomanured
(c) 1876-82, FYM and superptrosphate; 1881.1901, FYM only
(d) 187G81, FYM, sodium nitate and superphosphate; 1882, FYM and superphosphate; 1883-1901,
FYM only
NPK fertilisers. This suggests that the
FYM
at that period was much more deficient inN
than in P but gives no indication of the
K
status of the manure. The test ofFYM
plusN
ccased after the first six years of the experiment. During the second six-year period yields with all treatments were less than during the fi.rst six years. Yields with
FYM
continuedto
be less thanwith NPK
fertilisers and residuesof FYM
applied during the first six years gave smaller yields than fresh dressings of PKNaMg fertilisers.Yields declined even more during the second half
of
the experiment where fertilisers were given. However between 1888 andl90l
freshtrYM
addedto
FYM-treated soils gave slightly larger yields than fertilisers. Over the whole period oftie
experiment yields declined less on FYM-treated soils than on those treated with fertilisers.We do not know why potato yields decreased so dramatically. We belieye that wheat yields decliaed during the preceding experiment because of competition from weeds, but
there are no records suggesting that the potatoes were also infested.
It
is
possible thatthere may have been a build-up
of
soil-borne pests and diseases because potatoes were grown year after year on the same land for so long. Soil samples takenin
1903-O4 were examinedin
1970 for cyst-forming nematodes which, even in this heavy soil, might havebuilt
upto
damaging populations. Unfortunately not only had ttre soils been storedfor
many years but they had also been very flnely ground and Jones (rersonal communication) found only a few remnants of recognisable cyst cases and no eggs.Hall,
appointed Director after Gilbert diedin
1901, stopped the potato experiment after thel90l
crop was harvested. He considered that the physical condition of soils nottreated with
FYM
was poor and unsuitablefor
potatoes.Experiments made between 1902
a
l
1975In most of their experiments Lawes and Gilbert applied much more N, P and
K
in both fertilisers and manure than was removed intle
harvested crops. They made many single plot tests to measure the effect of the residues on succeeding crops (Johnston, 1970). TheAgricultural
HoldingsAct,
1875 gavean
outgoingfarm
tenanta
statutoryright
to
compensation
for
unexhausted manurial residues and Lawes and Gilbert became prin-cipally concernedwith
estimating the 'manure value',in
cash terms,of
many foods atti.at
time fed
to
stock. Compensationfor
tlle
unexhausted manurial valueof
someartificial manures was allowed under certain circumstances by the
Act
of
1875.How-56
Plot Treatment(")
1
Unmatrured5N
6N.
9P
l0
PKNaMS7
NPKNaMg
8
N*PKNaMs
2
FYM(D)3
IryM P(c)THE
EXHAUSTION
LAND,
1852_1975 everit
was
not until
l9l3
that
Voelckerand
Hall
published suggested scalesof
compensationfor
some fertilisers andlimirg
materials.Having stopped the potato exp€riment
in
1901,Hall
decidedto
measure the residual value of the fertiliser andFYM
dressings applied duringl85Gl90l.
Table 4 shows the amounts of NPKNaMg andFYM
appted in each dressing. Table 5, which corrects someTABLE 4
Amounts of N, P,
K,
Na, Mg andFYM
applied in each dressing, Exhoustion Land, 1856-1901Amount of elemnt, kg ha-r
Nitrog€n
96 kg N as ammonium salts (N) or as sodium nitrate (Nt)Phosphorus
33 5 kg P as superphosphate. From 1856 to 1888 the sup€rphosphate was made on Rothamsted Farm from calcined bone afld sulphuric acid. From l8E9 to t896 ready made superphospbate, bought from a factory, was appli€d aDdfrofi
1897to l90l ,{48 kg basic slag was used
Potassium
135 k8 K as potassium sulphate except from 1859 to 1875 when the K &€ssiog tothe wheat was decreased to m kg, as it was on Broadbalk
Sodium
16 kg Na as sodium sulphate except from 1856 to 1858 wheo the &sssiDg supplied3l kg Na
MaSnesium ll
kg Mg as magnesium sulphateFarmyard manu.e 35 t ha-l rhought to supply 224 kg total N ha-r TABLE 5
Number of annual dressings of fertiliser
od
farmyard manweatd
rhe estimated amounts of P and K applied, Exhaastion Laml, 1856-1901t2345678910
Numbcr of &rssinSs
FYM PK
P only
N
P as supe.phosphate
P in FYM
K as DotassiM sulDhate
K io FYM
26-A)
7-6434343
Nutrients applied, kg ha-r23s 0
0
l4l01025000
0005040
39m000
42 17
4225-
43-l4l0 43-l4l0
l4t0000
5040 1570 5040
000
626
00235
0
235
1025000
0
900
3920previously published values (Warren, 1956; Warren & Johnston, 1960) shows the number
of dressings applied to each plot. The Iargest number, 42, does not agree with the total
length of the two experiments, 46 years, because some dressings were not given between
1870 and 1875 when the wheat crops failed or were not sown. PKNaMg fertilisers applied
for the 1875 wheat crop which was not sown, were not reapplied for the fust potato crop
in
1876 so the flrst crop of potatoes received 90 rather than 135 kgK
ha-t.
Table 5 also shows estimatesof
thetotal
amountsof
P andK
appliedin
both fertilisers andFYM.
We have estimated the amounts of P and
K
removed in tlle wheat and polatoes Cfable 6). For wheat we have used concentrationsofP
andK
foundin
similarly manured crops at Rothamsted. For potatoes we have based our calculations on uptakes given by Gilbert(1888) for the
fust
12 years of the experiment. Results in Table 5 and 6 show that onlyabout 7.5
afi,
14.51of
the P and 25 and321of
theK
addedin
FYM
and fertilisers respectively were removed in the \xheat and potatoes combined.Plants may take up nutrients from soil reserves and residues of previous dresssings as well as from a fresh dressing. The percentage recovery
of
a fresh dressing is often cal-culated as:amount
in
treated crop ,nir%r amounti
rop.,
r nnamount
apptied
)'r(
J57
v
z
9X
;:EEBE
o\x oooFah6\o e
.:
.2
o
z
B
'a
2
"i
qi
.iJ
E-a9
8{F
}
x3r
a-8
0
*E ^E
E.= E
O\3'
h.E B
"r
€E8ei
.a
--
l
i:t
l4t
oTK
€E+!
E€+EcH
B63Pg!=9
l:=EEEt
6i.;7zE;
8,6rE='rP
4rrrrte.cryI
Y o----^
\o\o6a\hF .ro\-6.irz _ _.r r \o\oo\_\o
\az
N-<\o
\6
.rhx
\ie
sg
.3
8.3o
.tc
r*i
Est
6E
.c
l3
E ^E
tr $E
br
e
B
3
Y
s
q
a;
E hl
o\h<.66r.- -hoo6
<
-6hN-hz
I
X
.o.o----!'!- \o \o-oF-o
L
-.r
-
.r
g
-E
)r
BS88GE
-6r-
.r
IIIee €o\D6N6
.r E
\oo\ordiF
z
I
.oo..r\otF+alF
co,a
z
e
'<;
] i
EE E E g
i
-r- Errr
e
egEEE
-s u
iigs
I
-
>o.oaaav
5
lrlrr
==999
ho\ooF:r ti hF o:rh h -o 00@o\o\0\6\
!
,i]
4i
'
!!-- d d d di
-r-8rr--^ < c! c E c c
g
y
EgEEEE
L,
1
g E-..9.99
.r
il ;i -9 -!l 12 12E<TEhEh
J >AleleEle
THE
EXHAUSTION
LAND,
1852.1975lllel
ll lre
lll""
!9T"?
o., ..r 6l a.l ort
'iX;;n l l l;:
NT-I1
9+1 , ,
,""
..:2
DhR
| |
rR=
.^ ooa<. €!t
;zGR;lll*9
{> Pi99Sf:Y
_-> 60Foa \o6sf ' '!L o\ 6 rr 6 6.{.r
-a
z
oz
i
ez
e
t-l! I Rtl
{
:rs
kj tr6s
-!s
g\
!.s
:t
goo
=r
E a'i
E EI Ai Eilll
E
€S
F
F>
Eit
oo
sx
l\t
€s
5H;s
ii.u
=J,vE
ea'E
I
.'
t !.
a999:
Pa
--a-q ' '4.
+.{r-\o..t-ho.
6-q 4rr 6 6FF ar6€ O OOO\.1169x
=
-o; r?Y
g
t9-
5R1
+++
6 66r .ro\N o 6tf- FF€ ^! t ;.a- .loaF h Fqo\t 6tlo\
-'E
-
-++ --
+lt
j-o 6crc .+N6 o o\\oo -66 -v - -6\o r6- + oh6..rFt qE! tr 66- o€h o 66\E| F6F Fj= - Ff _t_ h.li .r:+
'a
+'
++
-=
!
:<g
.r
RR8;fi+
.aoa.ro\on
R o\RSe
\o@\o+Sg
d-F
n_*
-'lr.
++
39
e
sxs
:;sF$
n
sxr
hF=
'.{6 .{ Fh.i r|-n
.rF
'rl
-iE
D'irrrrttll
E E
E8e
8nh
a
883
83h
c\o
65
.n6
ee
.gaA
EaF
O o Y ,o i
4
=
(,
;5
0 * d d Ed eX L - - :gE - -Z'- n .= O\/ E .=
AB!
8 TET
EEE *
E5
*
4d
dt
<d
ae..:
6N
d8
.s*
BE
.E:
r5
s:
{s)
.St
E*51
t*l
Exs
5s=
cr. iE
E'{
TT
E 6 S't-
3R
:\
:E\
!e
.:
q ,av
(3&
.s q; E:
kf=3v
S$S
5
"iq'
:::
J
i-.X
6rz .{r<
EFE
P
vi'" .\::
I.F
see
.5.ic
n::
r^
i
ese
a.:z
):)
o , +\a\o :l€ ;0. -c,:r I
l--:X$S{rrriE
FZ 6-- ',
',--.^ *^^
g-r\6FFlllOO\
6 o:: ,-O -':l 6\66-\06\ \o+ fL {.lN .! -^ I F-.o€o\+o6
':6 9l:9n9!99f
-Z
.{o
-o oooo
=6Xr
: ^-*--JJ.l'
g
EEEEEEEE
e;
a9
9?
90
;
-o.EtrS
"556
E q,o o.
>Yi'i
hdeo.
=
qaq>
E6bab
ezzz>
6EEE
g;999P
E!.r,!:
E E E
E:
*
Eh
bi
'83az"i
and this is often used as a measure of fertiliser effi.ciency. In long-term experiments
it
is often more meaningfulto
calculate the nutrient balance, additions minus removals, on treated and untreated soils. This we have done for P andK
in this experiment (Table 7) using the data in Table 6. The P andK
balance is used later to calculate the percentage recovery of the P andK
residues and to relate to changes in soil analysis. However plants grown on enriched soil may have removed as much P andK
from the soil reserves as did plants on soil given no P orK
in which case the residuesofthe
applied P andK
may be Iarger than those shown in Table 7. The effect of this would be to decrease our estimate of thef
recovery of the residues during 1902-74 butit
would not affect the relationship between changes in soil analysis and PK uptake. We have no way ofapportioning uptake between the two sources, soil reserves and residues of applied dressings, but the enriched soils should still contain P andK
equal to that removed by crops grown on unmanured soil.1902-40.
The
frst
periodof
the
ExhaustionLetrd experiment
No
manures wereapplied
in
this
period and cereals, mainly barley, were grown excepton plots
5-10 rvhich grew clover duringl90Gl
l
Table 8 shows cereal yields in individual years 1902-06 and average yields for three fi.ye-year periods between 1907 and l922.Barley yielded well, 3.84-4.19 tha-l,
in
1902, the first year after manuring ended, on plots previously treated with NPK fertilisers orFYM.
Even where N alone had been applied the yield was 3.64t
ha-l.
However only FYM-treated soils continued to yield well Q.77t
ha-r)
in the nexttwo years although the
NPK
residues still gave small increases.Hall
(1905) commentedon the fact that the
N
andNPK
residues gave yields almost equalto
thatwith
FyM
residues in the fust year but their effect rapidly diminished. He considered the extra yield came from
N
mineralised from increased crop residues remaining in these soils and notfrom
any unchanged NHn-N orNOrN
leftfrom
the 96kg
N ha-l
fertiliser dressing. Table 8 shows thatby
1912-16 yields were small and there waslittle
apparent effectol
fertiliser orFYM
residues.It
is ofinterest that after the 1920 barley crop failed, the land was ploughed, fallowed and dritledto
winter wheatthat
autumn. Nitrogen accumu-lated during the fallow gave almost the same increase in yield,0.63 tha-l,
on plotswith
PK residues from either fertilisers or
FYM.
No yields were recorded between 1923 and 1940.We have recrntly found some unpublished results
for
fN
in
grain and straw of mostof
the cereals grownfrom
1902to
1922. These are summarisedin
Table 8 which also gives uptakes ofN in
the harvested crop.N
residues from either fertilisers orFyM
not only increased yieldbut
also%N
in
grain
in
1902. PercentageN in gain
was onlyslightly increased
by
FYM
residues during the next three years; thereafter previous treatment had little efect.N in the harvested crop varied according to yield; on the unmanured soil the range was from 9 to 17 kg N
ha-t
year-l. Offtakesin
1912-16 show that N residues which accumu-lated in soil where legumes were grown between 1906 andl9l
I
increased the amountofN
available to barley, especially where good crops ofclover were grown on soils containingPK residues.
Clover yields varied considerably
from
yearto
year; the rangeuas
1.41-7.09t
drymatter ha-1 on soils without PK and from 2.04 to 12.10 t
ha-r
on soils withpK
residues. Average dry matter yields during 1906-11 were 3.91 and 5.67 t ha-1 on soils without andwith
PK
residues respectively. Estimatesof
theP
andK
removedby
the clover are included in Table6-1911-75.
The
seconrtperiod
of
ttre
ExhaustionLrnd
experiment,The
methodTHE
EXHAUSTION
LAND,
1852-1975 Lawes andGilberl
Without new additions of any ofthe three nutrients, N, P orK it
was not possible to get any information on the contribution to yield of any one of the nutrients contained in the residues. However, startingin
1941, N has been given to all plots, except when they were fallow, and yields, recorded since 1949, have measured the combined effectsofP
andK
residues. Froml94l
to
1960 ammonium sulphate was used, from 196lto
1975 La ammonium nitrate-calcium carbonate mixture('Nitro-Chalk').
Startingin
1963 the
'Nitro-Chalk'
was combine-drilled with the seed.In
1954 parts ofplots 2, 4, 6, 8 andl0
were found to be acid (see p. 69) and chalk was appliedin
winter 195,1-55. Barley continued to be grown on all plots during 195,t-56.In
1957 the value of the P andK
residues were tested separatelyfor
six crops, spring barley, spring wheat, potatoes, sugar beet, swedes and kale. This was done by dividingplots
l,
3, 5, 7 and 9 into 2,lO microplots, 120 were cropped in 1957, the remainder in 1958.Where P was tested
NK
fertilisers were given, whereK
was tested NP fertilisers were given. The experiment has been described and the results givenin
detail by Johnston, Warren and Penny (1970) andwill
not be discussed further here. Barley was grown onlyon part ofthe even numbered plots during 1957-58.
Since 1959 only barley has been grown; the variety has changed twice and the amount
of
N
has been appropriate to the variety. The seed has been treated with ethirimol seeddressing each year since 1972. Occasionally all, or part of the plots have been fallowed to control rhizomatous grass weeds
not
readily controlled by the herbicides applied each spring. Plots without PK residues are usually most affected by grass weeds becausetle
poor barley crops provide little compe(ition.
Yields have
only
been recorded since 1949, some have been published previously(Warren, 1956; Warren
&
Johnston, 1960). We have givenall
grain and straw yields since 1949in
Appendix TablesI
and 2 respectively. The appendix tables also show the variety, N dressing and years in which the plots were fallowed. This ac.ount ends with the 1975 harvest year butno
crop was grown on the Exhaustion I-andthat
season so allyields and nutrient uptakes end with the 1974 crop; soil samples were also taken from all
plots
in
autumn 1974.TABI,E 9
Yields of barley, Exhaustion Land, 1949-74
Grain aod straw, t ha-r yearr, at 85 % dry matter
Plot numbers and treatment,(3) 1856_1901
1,2"5,6
1,4Untuanur€d
FYMPeriod
8rain
strae
graitr
stmw7,a
9
lc
NPK
P(D)
PKgrah sLaw Srain stlaw gain
straw1949-53 1954_59(c)
t9M2
1961
1964--691d'
1970!75(.)
1.59 1.88 3.03 3.30
2.871.80 1.92 3.32 3.05
3.102.O2
1.31 3.09 2.02
2.62r.9o 1.24 3.n 2.23
2.86r.1t 1.35 4.24 3.06
3-6r1.83 1.38 4-15 3.11
4.n
2.9 2.72
2.832.94 2.81
3.06t.1l 2.59
1.692.U 3-21
2.23).44 1. {O ). <i
2.90 3.76
2.4
3.05
3.t93.08
2.972.73
1.842.99
2.m3.61
2.364.53
3.12(a) See Tables 2 aDd 4 for full details of FYM and fertilis€r dressings
O) K applied 1856-75
(c) 1954-59: mean of four years for the odd numbered plots which *ere us€d for a microplot
experi-ment in 1957 and 1958 (see text); mean of file years for even nurntrered plots which werc split for fallow-ing in 195?-58 (cropped area in 1957 was fallow in I958), the avenge yieid for 1957-58 was us€d to
calcu-latethe four year mean. 1959: plors 5 and 9 were harvested by the microplots us€d in 1957-58; the yield
used is the mean of 1954 1955 and 1956 only. The yield for 1956 was used to derive a mean yield for the period to calculate nutrient uptakes
(d) The whole experiment was fallow€d in 1967 (e) The .rhole expedment was fallowed i{l 1975
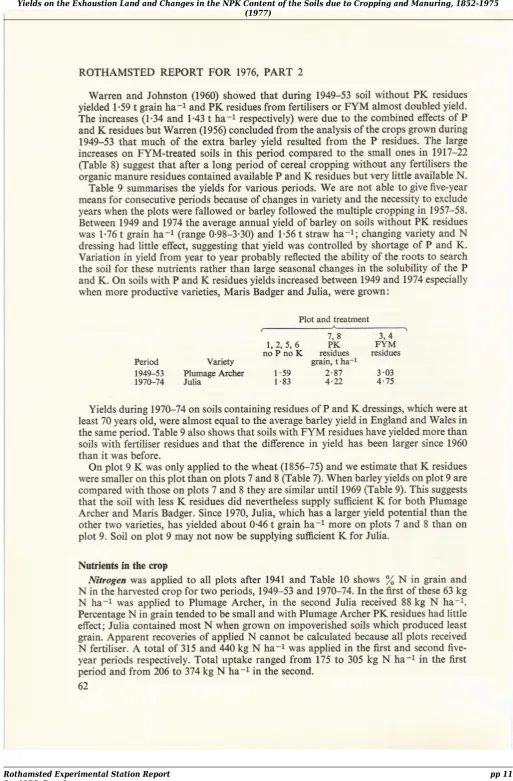
Warren and Johnstoo (196O) showed
that
during 1949-53 soilwithout
PK
residues yielded 1.59 tgain
ha-1 and PK residues from fertilisers orFYM
almost doubled yield. The increases (1'34 and 1'43t
ha-1 respectively) were due to the combined effects of P andK
residues but Warren (1956) concluded from the analysis of the cropsgown
during 1949-53that
muchof
the extra barley yield resultedfrom
theP
residues. The large increases on FYM-treated soilsin
this period comparedto
the small onesin
l9l7-22
@able 8) suggest that after a long period of cereal cropping without any fertilisers the organic manure residues contained available P andK
residues but very little available N.Table 9 summarises the yields
for
various periods. We are not able to give five-year means for consecutive periods because of changes in variety and the necessity to exclude years when the plots were fallowed or barley followed the multiple croppingin
1957-58. Between 1949 and 1974 the average annual yield of barley on soils without PK residues was 1.76t
grain ha-1 (range 0.98-3'30) and 1'56t
strawha-l;
changing variety andN
dressing had
little
effect, suggesting that yield was controlledby
shortageof
P andK.
Variation in yield from year to year probably reflected the ability of the roots
to
search the soilfor
these nutrients rather ttran large seasonal changesin
the solubility of the P andK.
On soils with P andK
residues yields increased betweea 1949 and 1974 especially when more productive variefies, Maris Badger and Julia, were grown:Period
Varietyl 9-53
Plumage Archer1970-74
Julia7,a
3,41,2,5,6
PK
FYMnoP
noK
r€sidues
residu€sgrain, t ha-1
1.59
2.A7
3.031.83
4.22
4.75Yields during 197G-74 on soils containing residues
ofP
andK
dressings, which were at least 70 years old, were almosteqrx
to the average barley yield in England and Walesin
the same period. Table 9 also shows that soils with
FYM
residues have yielded more than soils with fertiliser residues and that the differencein
yield has been larger since 1960 thanit
was before.On plot 9
K
was only applied to the wheat (185G75) and we estimate thatK
residues were smaller on this plot than on plots 7 and 8 (Iable 7). When barley yields on plot 9 are compared with those onplos
7 and 8 they are similaruntil
1969 (Iable 9). This suggests that the soil with lessK
residues did nevertheless supply suffi.cientK
for
both Plumage Archer and Maris Badger. Since 1970, Julia, which has a larger yield potenfial than the other two varieties, haslelded
about 0'46t
Brainha-r
more on plots 7 and 8 than onplot 9. Soil on plot 9 may not now be supplying sufrcient
K
for Julia. NuEients in the cropNitrogen was applied
to
all
plots after 1941 and Table 10 showsf
N
in
grain andN in the harvested crop for two periods, 1949-53 and 1970-74. In the fust of these 63 kg
N ha-l
was appliedto
Plumage Archer,in
the second Julia received 88kg
N
ha-r.
Percentage N in grain tended to be small and with Plumage Archer PK residues hadlittle
effect; Julia contained most
N
when grown on impoverished soils which produced least grain. Apparent recoveries of appliedN
cannot be calculated because all plots receivedN
fertiliser.A
total of 315 and,l40 kgN
ha-l
was appliedin
the fust and second five-year periods respectively. Totat uptake rangedfrom
175to
305 kgN
ha-1in
the firstperiod and from 2A6
6
374k9 Nha-l
in the secoad-62THE
EXHAUSTTONLAND,
1852_1975TIBI,E IO
\N
inba
ey grain dnd total N uprake, kghrl,
1949-53 and 1970-74, Exhaustion LandN dr6sings: Plurlagc Archer, 63 kg N ha-r; Julia, 88 kg N ba-r
M€ao %Nhgraincachyear Total N uptake io fivc years
Treatment(t)
Plot
185G1901l,2.5.6
Unmanu€d3,4
FYM7,8,
l0
PK1970-74
Julia
I .95
1.57
t.g
1%9_53
t964_49(b)18.8
19.74.7
3-523.s
23.244.5 8.5 53.0 39.1 7.4 47.1 1949-53 Plumage Archer t.79 I .E2 1.67 t949-53 Plumage Archer 175 305 277 1910-74 Julia
M
374 351 (a) See Tabl6 2 and 4 for full details of FYM and fertilis€. &€ssiDgsPhosphorw.
In
the barley crops grown botween 1949 and 1974/
Pin
grain and straw was, on average:3,4
7, 81,2,5,6 FYM
PKUnmanu€d
residues
Esiducs%P iD dry matter
0-278 0.356
0-3420.057 0.052
0.0509 P(K)(') &sidues l0 PK(b) a€sidues
0.347
0.3430.057
0.050(.) K was applicd odly between 1856 and lE75 (b) PK applied without N l85cl90t
P residues either from sup€rphosphate or
FYM
increasedlP
in
grain but not in straw. This and the larger yields on soils with residues meant that more P was removed from the enl'ichedrh.n
from the impoverished soils. Tablell
shows the total P removedin
five years in grain plus straw for three periods, 1949-53, 1964-69 (the experiment was fallowedin
1967) and 1970-74 when Plumage Archer, Maris Badger and Julia reqnctively were grown. Much larger amounts of P were removedin
the grain thanin
the straw. BarleyTABLE 1I
P uptake, kg
ho-t,
inba
ey grain and straw, Exhaustionland,
1949-74Tt€atrDcnt(.)
Plot
l85Gl9O11,2,5,6
Uooatrured
grai!stltlP total
3,4
FYM
sraiostraw
total
7,8
NPK
8rai!stra$ total
Grain
Straw
grain
38.1straw
7-Orotal
45.1Srair
43.0stiaw
7.6toral
50.6PK 66.4 6.3 72.7 53.3 5.4 5E.7 55.9 6.3 62.2
52- |
4.4 56.5 222.0 26.r 248.r 211.2 28.1 239.3 2i5-6 21.1 2$.3
Total P uptatc
t970-74 l
9-74t1-6
98.93.2
17.520.8
116.465.3
2t1.76.7
31.212.O
292.953.5 4.9 58.4 49.0 5.4 54-4 59.0 6.0 65.0
Plot and treatment
(a) S€e Tables 2 aod 4 for full details of FYM and fcrtilisqr dEssia8:
grown on soils without P residues removed almost the same amount of P,
23.5 ld
23.2 kg Pha-l,
in the fust two periods and slightly less, 20'8 kg Pha-r
in the third period.It
will
be interesting to seeif
the amount of P removed from this soil decreases further and yields then decline as the experiment continues. The amountof
P removedfrom
soils enriched with residues increasedin
the second andthird
periods comparedto
the first because yields were larger (Iable 9). The crops grown on plot 9 removed almost as much P as those grown on plots 7 aDd 8.The total P removed during 1949-75 from the impoverished soils was I 16.4 kg Pha
-t,
equal to an average annual uptake of 4.66 kg Pha-r.
Barley removed 292.9 kg Pha-r
from soils with
FYM
residues and a little less,248.l kg Pha-l,
from soils enrichedwith
fertiliser P residues
on
plots 7 and 8. Thus barley grown betwe€n 1949-75 recovered 176'5 kg P ha-1 from soils withFYM
residues and 131.7 kg Pha-l
from soils where the residues were derivedfrom
superphosphate. These recoveries represent about 25 andl8l
of the residue of the applied P we estimate remainedin
these soilsin
1949 and attheir present rate ofrecovery they could last for another 70 years or more.
Potassium. Any effect
of
K
residues on the conc€ntrationof
K
in
barley rvould be measuredin
the straw rather than the glain. During 1949-75,fK
in
grain and straw was, on average:3,4
7,81,2,5,6 FYM
PKUomadured
residues
r€siduE %K iL dry'l,s,fi,f 0.49
o57 0.670.50
9
P(K){r)
r€sidues
0.49
0.6
t0
PK(b) residues
0.51
0.83
Grain
0.41Straw
0'60(') K was only applied betweed 1856 and l8?5
{b) PK fertilisers were applied without N and in I9O2 residues werc larger tban on plots 7 and 8 Cfabb 7)
The residues had little eflect on
\K
in
grain. The straw grown on soil with most residues(plot l0) contained most K. There was least
K
in straw grown on plot 9, this is discussed later.There were differences
in
the amountsof
K
removedin
the harvested crops because yields differed. Table 12 shows theK
removed in five years in grain plus straw for tbree periods, 1949-53, 1964-69(he
experiment was fallowedin
1967)and
1970-74 when Plumage Archer, Maris Badger and Julia respectively were grown. Grain grown on soilwithout
K
residues removed much the same amount ofK,
33-37 kgha-t,
in five yearsin
all three periods.
In
the first period, grain removed about twice this amount ofK
fromenriched soils and the amount increased
in
the second andthird
periods because yields were larger. Table 12 shows that there was lessK
in the harvested strawin
196,1{9 and 1970-74 thanin
1949-53 on all soils. Not all oftlis
decrease was because of a declinein
available soilK,
a changein
the methodof
harvesting was partly responsible- During1949-53 experimental cereal crops were cut by binder, stooked and carted to be threshed during the winter. By 1964 the crop was harvested by combine harvester and as the straw remained in the field longer,
K
appears to have been lost by leaching. Johnston (1969a) noted a similar changein
fK
in wheat straw on Broadbalk. Table 12 shows that muchof the variation
in
totalK
uptake from soils with residues was due to differencesin
the amounts ofK
removed in thestraw-About
354kg
K
ha-l
was removed from the impoverished soils during 1949-:15, an averageofonly
14.2 kg K ha-r year-r. This amount may be compared with the K removedeach year by barley in the Continuous Barley experiment, 19.3 kg K ha -1, and by wheat on
a
THE
EXHAUSTION
LAND,
1852_1975TABLE T2
K
uptake, kg ha-L, in barley grain and straw, Exhaustion l-and, 1949-74Treatmeot(r)
Total K uptake185G1901
194t53
r964-69tbt
1970-74
1949_741,2,5,6
Unmanured elaitr strawtotal
3,4
FYM
Bxainstraw
total
7,
8
NPK
grainsraw total
9
p(c)
grainstmw
total
l0
PK
grainsEaw total
32-6
&.7
93.3
6.4
122.4
188.8 63.r l3?.8
m.9
51 .688.8 146.4
61.2 168.6 235.8
31.7
69.0 94.3
59.3
t 53.6
82.8 58.9 14t.7 80.4
39.2
I19.6
82.9
71.8 154.7
98.5 72.s
l7l .0
86.1
77.7 163.8
76.O
43.6
I19.6
94.8
108.8
m3.6
368.0 348.0
7t6.0
330.5 379.4
7@.9 301.t
238.6
519.7
154.7 488.4
843.1
36.8
165.t39.5
t88.976-3
354.0(a) See Tablcs 2 and 4 for full details of FYM aod fertilisq dressings
(b) Fallow 1967 (c) K applied 185G75
Broadbalk, 34.7 kg K ha-1, where these crops are manured with N and P fertilisers but no
K
has been given for more than 100 years. MoreK
was removed from soils enriched withFYM
and fertiliserK
residues, 716 and 710 kgK
ha
1, respectively. Thus, on average, anextra 359 kg
K ha-l
was taken up from residues of appliedK
which we estimate to have been about 1387 kgK ha-r in
l95l
on plots 3, 4, 7 and 8 (Table 7).Abort
26% oftheK
residue was therefore recovered between 1949 and 1975.
Percentage
K
in
straw andtotal
K
uptake by barley onplot
9 during 1949-74 isof
interest. Table
6
showsthat
K
residues accumulated during 185G75 when the wheat received potassium sulphate. The potatoes which followed during I87G1901 were given P and noK
but
nevertheless they removed only101less
K
than those manuredwith
P
andK
(plot
l0).
In
1902K
residues were therefore much smaller on plot 9 than onplot 10. We estimate that by the 1930s the crops grown on plot
t
had removedK
equal tothe amount ofthe residues but by
l95l
this soil had probably lost less'native' soil K thanthat on the unmanured plots
(1,2,5,6).
During 1949-74 barley yielded more(Iable
9) and took up more K Clable 12) on plot 9 than on plots 1,2,5 and 6. Much ofthe increasedyield was due to the P residues and the extra P probably produced plants with a better
root
system capableof
searching the soilfor K.
However the extraK
uptake suggeststhat
theK
manuring during 1856-74 helpedto
conserve 'native' soilK
and this was available to barley grownin
1949-74.Calciam,
nngncsian
otd
sodiun. The
concentrationsof
ttresethree
elements (Table 13) were determinedin
both grain and straw and the results are discussed brieflyfor the same three fi.ve-year periods used previously. Sodium was not determined
in
the 1949-53 samples.Percentage calcium in straw was much larger than that in grain but neither was affected by residues
of
FYM
or PK fertilisers. Julia, grownin
1970-74, contained a largerpro-portion
of
Ca than the other two varieties. The offtakeof
Cain
straw was about five times thatin
gain.
Grain plus straw removed, on average, about 6 kg Caha-r yearr
from soils without PK residues. The larger crops grown on enriched soils removed more, about 9 kg Ca ha-1
l+*
I
lr+
I li,; I I;: I l;;
Il;; I l;; I l-; I l;; I l;;
I14{
r
r8l
r
rii
r
ril
r
r?q rrj:
r
r:3
r
r;:
rrqq
r
r{P
r
rqq r"i!
t9z
t!
r lr"
E1
'la"
.[i
r:;r
r;ir
,ii:
"-.
13
']PI
r
tqq
IL.\ oo
riE
t-?
&3
\i
rt
s
-l<
!q
j
tt\
BE
E!
b.F
aE
lg
rrl i
Fl .s'
3c
tr -t
$
=
(J9
1d
B
.=
B
a
!a
E
[=c!
-.^-l6!-6 noon
n+G'ba;&n oooF :;+F
IFii---.ddNod-d6 I l{ FN?€ I l; 6aaF
I *
l5
lils
-.*-< l- 60oo oo6o ooo6 o066 crc,o6
i [^- oooo oooo oooo oooo ooo;
I
I l!
ooo-l.=13
uo.* igse
=iri !!:s
:i:is
tEj
I"Ii
E6E5
:!EE
EEBg gEEg :EgE
I L:( oooo oooo oooo oooo oooo
[=r!
-'-.
liSa ;G;r +;;,i o:.:; nFa; ;;;;
lF
So
'd-r
|
,i .--.
I l! +n6+ ;++; ;a;;
;;Fi
66-on;;:
hdh6 Ba
lil,
-
i
l#lo
ra""
:sas
FeFs
*Be!
Bssc
€'5 la" fT?: YTf! !T:n fnT! !n91
5IE
tc
I [* q:er
?afir
ia1:.
gnae
="r.!
?I l* ;i';n ,ion,:r 'itiaA F;:F ;.F;: .
l.Els
-r
>16lr -o-- ooo- --o^ E
[ [N o0o6 6o6o oooo oooo oooo :
e
99!--
rEF:
sEF:
BESFsExE
sEs:
if
! *+JJ J+JT
J+Af,
J+JJ JJJJ
C9la
-?
:=c
! EE iiE5
E
IEHE:JE
=
v
-
i+isl
IEs i 2 E x
E:iE
'
"Ei
U,
^^-^
3.i
{
oi..
--
F'
9
THE
EXHAUSTION
LAND,
1852_1975 Barley grain always contained more magnesium than straw. There is some indicationthat
%Mgin
grain grown on each group of soils has declined during the three periods (Tablel3).
We do not know whether this is dueto
changesin
varieiy orto
a dilutioneflect on soils with PK residues where grain yields were increased. Barliy grain grown on soils with PK residues from fertilisers or
FYM
contained aboutl0l
more Mg than graingror
n
on impoverished soils. Ontle
Continuous Barley experiment barley was givenll
kg Mg
ha-l
each year during 197-175in
additionto
NpK
fertilisers but the grainonly contained, on average, 0.114"/. M.g,
Iittle
different to thatin
the Exhaustioniand
barley grain. This suggests that barley
$own
on the Exhaustion Land and yielding about5
t
grainha-r
gets sufrcient Mg. Total offtakeof
Mg from soilswith
andwith;ut
pK
residues was about 4 and 2 kg
Mg [a-1 ygsr-r
respectively. Williams (197e showed that during 1969-73 rainfall at Rothamsted supplied 2.6 kgMg
ha-r
yearr,
almost etroughto supply the requirements of the barley in this experiment.
There was more sodium in barley straw than in grain- Both
gain
and straw grown on soilswith
mostK
residues, eitherfrom
FYM
or fertilisers, contained only half the Nafound in crops grown on unmanured soils (plots
l,
2, 5 and Q or on plot 9 which did notreceive
K
during the
potato experiment, 187G1901.On
averagethe
crop
removed between 3 and 9 kg\4
ha-rysarr;
this is less than the amount, 12 kg Naha-f,
supplied annually in rain (Williams, 1970.Yield and uptake
of
P
andK.
Warren (195Q discussed yield andp
andK
uptake by barley during 1949-53. Fig. la shows his results. For K he said that, .the extra amountsof potassium
in
the crops above 0.25cwt
K/acre (32 kgK ha-)
didhot
increase the yieldsof
dry matter . ..'.
We give similar datafor
1970-75in
Fig.lb,
the relationship between yield and P uptake \vas much the same in the two periods. ForK
the change inthe relationship between yield and
K
uptakein
the second period may be dueto
the smallerK
removals in the straw already mentioned orit
could be because soilK
levels have decreased and there is nowlittle
luxury uptake ofK.
. These good relationships suggest that the soluble P and K were well mixed tbroughout
the
plough layer and were the factorslimiting
yield.If, in
other experiments, such relationships are poorit
would suggesttlat
factors other than amounts of p andK
arelimiting yield.
Soil analysis
Soil
sampling.
Lawes and Gilbert took some soil samplesfrom
Broadbalk as early as1846 and they gradually developed techniques
for
sampling and samplep..pu.aiion
which,
in
theirfinal
form, were describedby
Warington (1892) and Dyer (1902). The fi.rst systematicsoil
sampling was madein
1856; these samples werC takenwith
a9
x
9x
9 ta. (23x
23 x 23 cm) metal box sampler.At
that time the depth ofploughingwas probably not greater than 13 cm so
that
abouthalf
the sample was subsoil. Five plots on Broadbalk and thefour
Smith's Wheat plotson
Hoosfield were sampled andthe
N
contentof
the soils was discussedby
Lawes and Gilbert (185e. We doubt the arcuracy of these values rvhich we think are too large. However, we cannot explain this because two possible sources of error would both have given low results.In
1856it
was not appreciated that moist soil samples should be dried as quickly as possible to minimise the effect ofbiological activity which usually causes a loss ofN
andC
from the soil.In
addition the
N
contentof
the
soil was determinedby
the soda-lime method which usually gives smaller values than the Kjeldahl method.In
1902 Dyer published manyN
d
^-:--^-_../-
AL./'''
A 5-3
;
2
1 0
A
1949-53
P K
uptoke
upto ke A
30
40kg
l'."
20
P ond K . uptoke
Frc.
l.
The relationship between the total amounts of P and K removed each- y-€r qtrd-the yield!f
barley, t ha-1 dry matter;grain plus straw. P uptake, kg ha-r: O, 1949-53;
a,
l97O-74. K uptake, kgha-r: A, 19,19-53; , 1970-74.
the published values were agreed with them before their deaths. This suggests that they had-doubts about the accuracy
of
the procedures used for the analyses madein
1856.We have a bulked sample, comprising eight subsamples, two
from
eachof
the fourSmith's Wheat plots. We have analys€d this sample for nifogen and other plant nutrients
to determine changes due to cropping and manuring since 1856.
The soils, excepithose of
ploti
7 and 8, were next sampled by Hallin
1903-O4.In
1903samples were talien from plots
1,3,5,
6,9
and 10, plots 2 and 4 were sampledin
1904;THE
EXHAUSTION
LAND,
1852_1975 throughout this paper we have referred to all the samples as 1903 for convenience. These samples were takenwith
a
15x
15x
23 cm metal box, there were two subsamplesfrom each main plot.
The soils were
not
sampled againuntil
l95l:
since then, sampling has becn more frequent,in
1954, 1958, 1965, 1968 and 1974.AII
rec€nt samples were takenwith
somi-cylindrical sampling tools, varying
in
diameterfrom
1.2to
2.5 cm: there were usually 20 cores per sample. On each occasion the east and west halves of the plots, andin
1958the north and south sides of each half plot, were sampled separately.
In
1954 individualcores were taken on a gird patrcrn. The pH ofeach sample was determined, a soil reaction map prepared, and recommendations then made to correct acidity by differential chalk dressings. The 0-23 cm depth was sampled
in
1968 and 1974, this was then about the depth of ploughing.In
1958 the soil was sampledto
15 cm, and then by 7.5 cm horizons downto
53 cm. Samples takenin
1951, 1954 and 1965 were from thetop
15 cm, which includes the plough layer, but we have no record of the depth of ploughing. Horses were used for ploughing until the early 1920s andit
is probable that ploughing depth changedIittle until about that time. Sinc€ then ploughing depth has increased gradually as tractor
power has increased. From both the total N and P content
ofthe
G-15, 15-23 and 23-30cm horizons, sampled
in
1958, we have calculatedthat
ploughing was about2l
cmin
1958.
Weight
of
soil perhectere.
Jenkinson and Johnston (1977) gave weights per hectareof
soil from ttre 0-23 cm depth from a number of plotsin
the eastern half of the Con-tinuous Barley exp€riment. They notedthat
the weightof
fine soil $i/as larger onplot
l-0,
at the northern end, than on the remainder, andfor
plot
l-O
they adopted a soil weightof2.9l
Mkgha-r
compared with 2.62Mkg ha-l
for the other plots. These were weights of oven dry soil less than 6.25 mm (6.25 mm was used because Lawes and Gilbertmade all their estimates of soil weights on soil passing a quarter inch sieve; on average
I
kg dry fine soil<
6.25 mm contains 20 g stones>
3 mm and<
6.25 mm).Because
ofthis
variability and because the Exhaustion Land is only 100 m northofthe
Continuous Barley experiment, we decided to check the weight of soil on the Exhaustion
Land.
In
autumn 1976 wetook
one samplefrom
eachplot
which had never received organic manures and two from eachofthe FYM
plots, using a 15x
15x
23 cm metal box. The weights of oven-dry fine soil<
6.25 mm were 2.97 Mkgha-r
(range 2.80-3.14) on soils which receivedFYM
from 1876to
l90l
and none since and 3.01Mkg-t
(range 2.75-3.17) on soils without organic manures. The meanvalte,2,99
Mkg ha-1of
oven-dry fine soil to 23 cm depth, is very similar to that for plot l-O on the Continuous Barley experiment. We have made mostofour
analyses on air-dry soil and have uscd a weightof
3.03Mkg
ha-r
of
soil;
this allows2l
for
the weightof
small stones and3% for
themoisture in air-dry soil.
The
bulk
densityof
the whole soil on the Exhaustion Land experiment was 1450 kgm
3. This is less thanthat
of
the Continuous Barleysoil,
l520kg
m-a, because the Exhaustion Land contains many fewer stones.Cdcim
corbonrte contenta
l
pH
of
lte soils.
CaCOsin
the surfacesoil
of
arable fields at Rothamsted originated from man-made applicationsof
chalk. The practiceof
sinking pits to extract the underlying chalk was well established by the eighteenth century(Young,
l8l3;
Russell, 191Q. Warren and Johnston (1967) showed that there was more CaCOg in surface soils on the east sideofthe
Continuous Barley experiment than in soils on the west side, which suggests that the chalk was dugfrom'bell
pits' to the east of the experiment and that applications were heavier nearer the pit. Table 14 shows the same pattern ofdistribution on the Exhaustion Land, which lies only a little to the northofthe
TAELE 14
%CaCOs and soilt t
pH (in
water), Exhaustionlad
1856 sample: 3'l?% CaCOs; pH 7'8
ir
watcrTreatmentlb)
Plot lSs6-tml
I
Unmanured2
Unmanured3
FYM4
FYM5N
6N*
7
NPK8
N'PK9
P{.}IO
PK'ACaCot
1903
l95l2.14
0.900.86
0.m2.6
0.85o.77
0.ml.19
0.670.88
0.m_(.)
0.70_(d)
0.00l'83
l-461.04
0-121903 1951 1958 1968
19748.0 8.0 -(.) 8.3
8.0?.8 7.1 7.8 7.7
7 47.7 8.0 -(c) 8.3
8.17.8 7.1 7.7 7-6
1.48.0 7.9 _(c) 8.2
7.98.0 6.2 7.8 7.s
6'9-{d)
7.9
-(c)
8.3
8.0-(d)
7.9 8.0 _(c) 8.3
5.8 7.7 7.5
7.18.18.0 7.4 7.5 7.3
1'O (a) All soils 0-2J cm: exceDt l95l when lhe plough layer only was sampledi6ib;i;'66;il
ii;;
fl,lladrib oaFYM andfeniliser drGssings; N;ammonium salts;N''
sodiumDitrate
(c) Not determined (d) Not sampled
(e) K aDDlied l85G?5
Continuous Barley experiment.
In
1903 soilsfrom
the odd-numbered plotsin
the east half of the experiment; contained much more CaCOa than those from the even-numbered plots.All
soils lost CaCOs between 1903 and 1951 and, by 1951, those from plots2,4,6
and8 contained no free CaCOs- For about thrce-quarters
ofthe
period these losses of CaC03 were not dueto
manuring but to 'natural' loss. This would have been enhanced duringl94l-51
by the annual applicationof3l0
kgha-l
of ammonium sulplnte' Unfortunately,we cannoicalculate an
ivirage
annual loss ofCaCOs from these soils. Samplingin
1903was to 23 cm, that
in
1951wis
only to plough depth and we have least information on ploughing depthin
1951.It
is almost certain that the soil below plough depth would haveLoti'io.i
ro
CaCO3 solCaCO3
in
the 0-23 dm depthin
1951 would have been lessthan that given in Table 14. Table 14, however, shows that those soils with most CaCOs
in
1903 @IotsI
and 3) had lost most by 1951. Comparedfith.
these soils, those on plots 5 and 10i which contained only about half as much CaCOsin
1903, lost much less by1951.
All
soit reaction values givcn here have been determined in recent years using soil water suspensions and glass eleclrodes.In
1903 all soils had pHs above 7'5 but byl95l
soil on plois 6 and 8 hadlalues less than 7'0.In
1954 the pH ofindividual soil cores showed how variable soil acidity was on the even-numbered plots; the original chalk spreading must have been uery uneuen the furtherit
was awayfrom
the'bell-pit'.
In
winter 195155 various amounts of chalk, ranging from 5to
l2'5 tha-r'
were applied to correct acidity' Plot 2 received a further dressing of 2'6t
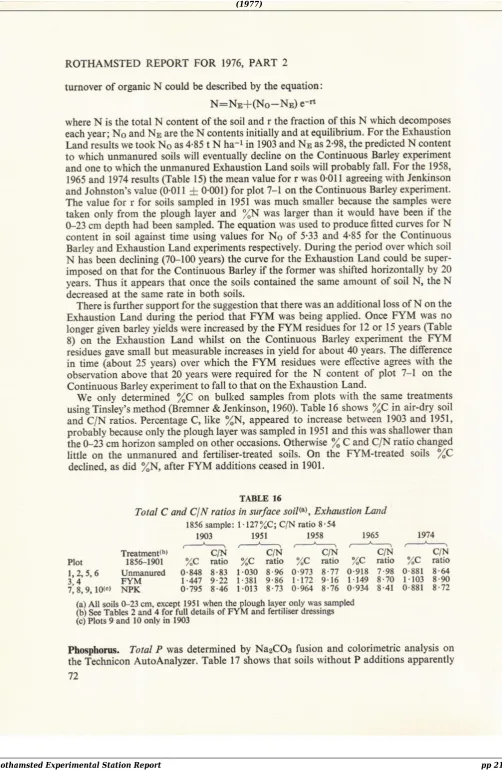
ha-r chalk in September 1959. Table 14 shows that the soils haye remained at a satisfactory pH (i.e. 7'G-8'0) during 1958-74.Nitrogen
aflt
cgrbon.
Table 15 showsfN
in
air-dry soilin
1856, 1903, 1951, 1958'1965
ind
1974.All
soils, other than those giYenFYM,
lost N between 1856 and 1903 and this loss was much larger than thatin
the Continuous Barley experiment (Jenkinson&
Johnston, 1977)or
on
Broadbalk (Johnston, 1969b) during the same period' We can offer no explanation for this greater loss but suggestit
may haYe occurred during1876-1901 when potatoes were grown. As in other experiments at Rothamsted the addition
of
N fertiliseri alone (plots
i
and 6) didnot
increase soilN
by 1903. The effectsof
NPK
fertilisers cannot be measured because plots 7 and 8 were not sampledin
1903'70