DEMOGRAPHIC RESEARCH
VOLUME 32, ARTICLE 49, PAGES 1361
−
1382
PUBLISHED 3 JUNE 2015
http://www.demographic-research.org/Volumes/Vol32/49/ DOI: 10.4054/DemRes.2015.32.49
Research Article
Loneliness and all-cause mortality in
community-dwelling elderly Singaporeans
Angelique Chan
Prassana Raman
Stefan Ma
Rahul Malhotra
This publication is part of the Special Collection on “Living alone: One-person households in Asia,” organized by Guest Editors Wei-Jun Jean Yeung and Adam Ka-Lok Cheung.
©2015 Chan, Raman, Ma & Malhotra.
This open-access work is published under the terms of the Creative Commons Attribution NonCommercial License 2.0 Germany, which permits use, reproduction & distribution in any medium for non-commercial purposes, provided the original author(s) and source are given credit.
1 Introduction 1362
2 Methods 1364
2.1 Dataset 1364
2.2 Variables 1365
2.2.1 Loneliness 1365
2.2.2 Living arrangements 1365
2.2.3 Social networks outside the household 1365
2.2.4 Outcome variable: All-cause mortality 1366
2.2.5 Covariates 1366
2.3 Statistical analysis 1366
3 Results 1368
4 Discussion 1375
5 Acknowledgements 1377
Loneliness and all-cause mortality in
community-dwelling elderly Singaporeans
Angelique Chan1,2
Prassana Raman1
Stefan Ma3
Rahul Malhotra1,4
Abstract
BACKGROUND
Loneliness is a significant risk factor for mortality among older adults. There are several pathways through which loneliness may operate to increase mortality risk, ranging from biological responses and individual perceptions to social interactions and environmental factors. The proportion of single older (65+) person households has doubled in the last ten years in Singapore. Yet little is understood about the relationship between loneliness, social isolation, and mortality risk among older adults, in Singapore and in Asian contexts in general.
OBJECTIVE
To assess the impact of loneliness and social isolation on the risk of all-cause mortality over a four-year period, controlling for demographic characteristics and health status at baseline.
METHODS
We used data from a longitudinal survey of community-dwelling Singaporean elderly (N=4,522). Loneliness was assessed using the UCLA three-item loneliness scale. Unadjusted and adjusted Cox proportional hazards regressions were used to estimate mortality risk.
1 Program in Health Services and Systems Research, Duke-National University of Singapore Graduate
Medical School, Singapore.
2 Department of Sociology, National University of Singapore. E-Mail: [email protected]. 3 Biostatistics and Research Branch, Singapore Ministry of Health.
RESULTS
In the final adjusted model, living arrangements and social networks outside the household were not associated with all-cause mortality. Loneliness increased the risk of all-cause mortality; those sometimes lonely and mostly lonely were 44.0% (p=0.005) and 39.0% (p=0.059) more likely to die compared to those not lonely.
CONCLUSIONS
Loneliness is associated with higher mortality risks among Singaporean elderly. Mental health among the older population is a major public health concern and community interventions are needed to more efficiently identify, raise awareness of, and increase care for the lonely elderly in the community.
1. Introduction
Existing research on loneliness and mortality
Loneliness has consistently been shown to be linked with mortality. Studies from North America, Europe, and Asia have shown that older adults who express feelings of loneliness are more likely to die (Holt-Lunstad, Smith, and Layton 2010; Luo et al. 2012; Luo and Waite 2014; Mazella et al. 2010; Shiovitz-Ezra and Ayalon 2010; Steptoe et al. 2013; Wen, Cagney, and Christakis 2005). Cacioppo et al. summarize succinctly the pathways through which loneliness may impact mortality. The authors conclude that lonelier adults in their study were more likely to report higher levels of perceived stress compared to their non-lonely counterparts, although the psychological stressors were comparable. Lonelier individuals were also less likely to derive pleasure from social interactions and to find social interactions supportive compared to their non-lonely counterparts. Lonely participants had higher blood pressure levels, higher urinary measures of cortisol, and higher morning levels of adrenocorticotropic hormone compared to their non-lonely counterparts (Cacioppo et al. 2003; Cacioppo et al. 2002). While the literature largely supports the link between loneliness and mortality, in some studies the effects of loneliness disappeared once health variables were accounted for (Steptoe et al. 2013).
Existing research on indicators of social isolation and mortality
Social isolation is distinct from loneliness. This is supported by recent work which shows that while loneliness is a relatively independent and significant predictor of mortality, the association of indicators of social isolation such as social networks and living arrangements with mortality is relatively weak or inconsistent (Holt-Lunstad, Smith, and Layton 2010; Luo et al. 2012).
Studies exploring the links between social networks and mortality use various measures and have uncovered inconsistent associations. Generally, there is evidence of a connection between social networks and mortality. (Bowling 1998; Eriksson et al. 1999; Glass et al. 1997; Olsen et al. 1991; Seeman and Berkman 1988; Seeman et al. 1987). Studies have shown that social participation, especially in formalized organizations, decreases mortality risk amongst the elderly (Sugisawa, Liang, and Liu 1994; Tucker et al. 1999). Other studies have explored gender differences in social networks and found that men and women get support and mortality-risk protection from their social networks in different ways that warrant further exploration (Hessler et al. 1995; Iwasaki et al. 2002; Shye et al. 1995).
with others that is protective against mortality risk, but the quality and type of relationships occurring with co-residence that offer protection from or exposure to mortality risk (Davis et al. 1997; Li, Zhang, and Liang 2009; Lund et al. 2002).
In Singapore, despite high co-residence rates, many older people reported feeling lonely, suggesting that living with family members is not enough to ward off feelings of loneliness (Basu 2012; Chan 1997). Using data from a longitudinal survey of community-dwelling elderly in Singapore, we assessed how loneliness and social isolation (measured by living arrangements and social networks outside the household) predict the risk of all-cause mortality.
2. Methods
2.1 Dataset
Data from a longitudinal (two waves: 2009 and 2011−12) survey on the physical, mental, and social health of community-dwelling elderly Singaporeans was utilized, combined with information on the date of death of Wave 1 participants from the Singapore Registry of Births and Deaths. Details of Wave 1 (Social Isolation, Health and Lifestyles Survey, SIHLS), conducted in 2009, including its sampling strategy, are available elsewhere (Malhotra et al. 2011). Briefly, single-stage stratified (by age/sex/ethnicity) random sampling was used to select the survey sample from a national database of dwellings. A total of 4,990 elderly Singaporeans aged 60 years or above or their proxy respondents (for 458 [9.2%] elderly unable to respond due to health reasons) were interviewed face-to-face at their residences after informed consent at Wave 1. Of these 4,990, a total of 3,103 elderly or their proxy respondents were re-interviewed at Wave 2 (Panel on Health and Ageing of Singaporean Elderly, PHASE), conducted in 2011−2012, approximately 2 years after Wave 1. The longitudinal survey and matching with the Singapore Registry of Births and Deaths were approved by the Institutional Review Board of the National University of Singapore.
2.2 Variables
2.2.1 Loneliness
The University of California, Los Angeles’ (UCLA) three-item loneliness scale was used to assess loneliness in the elderly participants (Hughes et al. 2004). Proxy respondents were not administered this scale. The three items were: How often do you feel you lack companionship? How often do you feel left out? How often do you feel isolated from others? Each item had five possible responses (always, fairly often, occasionally, rarely, and never), scored from 0 (for always) to 4 (for never). The score for each item was reverse coded, and the scores from all three items were added up. A higher total score indicated greater extent of loneliness. The Cronbach’s alpha of the scale in our dataset was 0.92. Exploratory factor analysis of the three items in our dataset supported the presence of one factor with high factor loadings (0.90 to 0.94) of the three items.
Nearly half of our analytical sample (49.0%) reported a cumulative score of zero, emphasizing the skewed nature of this variable. We thus divided the score into three categories: never lonely (those who had a cumulative score of zero), sometimes lonely (those who had a score of one to three, three being the median of the rest of the sample which did not have a score of zero), and mostly lonely (those with scores from four to twelve).
2.2.2 Living arrangements
Based on the information from the household roster, participants were categorized into the following five living arrangements: living alone, living with spouse, living with child(ren), living with spouse and child(ren), and living only with others (domestic helpers, siblings, cousins, and grandparents).
2.2.3 Social networks outside the household
items were added up, a higher score indicating stronger social networks. The factor structure of the scale as well as a high Cronbach’s alpha (0.92) has been previously confirmed in our data (Chan et al. 2011). The cumulative score was divided into quartiles for the analysis. Those in the first quartile were considered isolated, those in the second at high risk of isolation, those in the third at moderate risk of isolation, and those in the fourth at low risk of isolation (Lubben 1988)
2.2.4 Outcome variable: All-cause mortality
The outcome of interest was all-cause mortality till end-December 2012 among Wave 1 participants. It was assessed primarily from de-identified matched mortality data from the national Registry of Births and Deaths databases, supplemented by data from Wave 2 of the survey.
2.2.5 Covariates
A number of covariates were adjusted for that have been considered in previous analyses of the association of loneliness and mortality (Holt-Lunstad et al. 2010; Luo et al. 2012; Steptoe et al. 2013). The socio-demographic covariates considered were age, gender, ethnicity, marital status, housing type, and education, the last two being indicators of socioeconomic status. The health status covariates considered were number of self-reported diseases, ADL limitations, instrumental ADL (IADL) limitations, smoking status, depressive symptoms score from the 11-item Center for Epidemiological Studies Depression Scale (Kohout et al. 1993), dichotomized using a cut-off score of 6/7 into clinically significant depressive symptoms (yes/no), and cognitive impairment score from the Short Portable Mental Status Questionnaire (Pfeiffer 1975), categorized into cognitively intact (score: 0–2), mildly (3–4), or moderately (5–7) impaired.
2.3 Statistical analysis
Further, correlation between scores on the scales for loneliness and social networks outside the household was assessed through Pearson’s correlation coefficient.
Given the prospective nature of the study and the fact that the participants contributed variable amounts of follow-up time, survival analysis was used to assess the association of loneliness and social isolation at baseline with subsequent all-cause mortality. The time-to-event variable was time since Wave 1 interview to either date of death (for those dead by 31st December 2012) or 31st December 2012 (for those alive at that date), and ranged from 6 to 1,459 days. Of the 4,522 participants in the analytical sample, 435 (9.6%) had died by 31st December 2012. Date of death for those who died during the follow-up period was obtained through data-linkage with the national Registry of Births and Deaths databases. Self-reported information, including national identification number, name, date of birth, and gender, which were reported by the respondent or their proxy in the Wave 1 interview, were used for the data-linkage with the deaths databases. For the majority (414; 95.2%) of those dead by end-December 2012, the date of death was available in the deaths databases and was used. For those (6,435; 1.4%) who were reported as dead on contact at Wave 2 but could not be located in the deaths databases, the date of death reported by the next-of-kin in a decedent questionnaire at Wave 2 was utilized. For the rest (15,435; 3.4%), who were reported as dead on contact at Wave 2 but could not be located in the deaths databases or whose exact date of death was not available, the death of death was assigned as the mid-point between the date of their Wave 1 interview and date of contact at Wave 2 with the next-of-kin. The inability to locate some of those who had died in the deaths databases is likely the result of missing or incorrect/misspelt values in the variables (national identification number, name, date of birth, and gender) used for the data-linkage, since these variables were self-reported by the respondent or their proxy in Wave 1. Participants who were still alive on 31st December 2012 were censored.
Unadjusted Kaplan-Meier survival curves were determined for loneliness and the two indicators of social isolation. The semi-parametric Cox proportional hazards model was used to assess the unadjusted and adjusted association of loneliness and the two indicators of social isolation with all-cause mortality. In the adjusted analysis, three sequential models were fitted. The first model included loneliness and the two indicators of social isolation; the second model additionally adjusted for socio-demographic covariates, and, finally, the third model included health status covariates. A p value of <0.05 was considered to be statistically significant. Tests and plots based on Schoenfeld residuals were used to test the proportional hazard assumption globally, as well as for loneliness and the two indicators of social isolation (Schoenfeld 1980).
2013). Thus, in sensitivity analysis we ran the unadjusted and adjusted Cox proportional hazards models, as detailed above, using continuous scores for loneliness and social networks outside the household.
3. Results
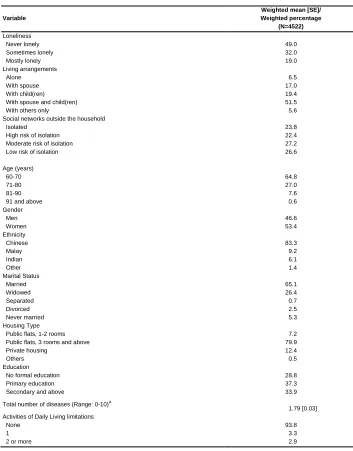
Table 1 summarizes the characteristics of the analytical sample. Nearly half (49%) of the elderly reported no feelings of loneliness, 32% felt lonely some of the time, and 19% were mostly lonely. The majority (52%) of the elderly lived with both their spouse and child(ren) and 7% lived alone. Based on our variable measuring strength of social networks outside the household, we found that 24% of the sample had the lowest level of support from social networks (1st quartile; isolated) and 27% of the sample had high levels of support (4th quartile; low risk for isolation). The majority of the participants were between 60 and 70 years old, Chinese, married, lived in public housing flats with at least three rooms, had no ADL or IADL limitations, and had never smoked. The majority of the sample was female (53%) and 29% had had no formal education. The mean number of self-reported diseases was 1.8.
Table 1: Sample characteristics
Variable
Weighted mean [SE]/ Weighted percentage (N=4522) Loneliness Never lonely Sometimes lonely Mostly lonely 49.0 32.0 19.0 Living arrangements Alone With spouse With child(ren) With spouse and child(ren) With others only
6.5 17.0 19.4 51.5 5.6 Social networks outside the household
Isolated High risk of isolation Moderate risk of isolation Low risk of isolation
23.8 22.4 27.2 26.6 Age (years) 60-70 71-80 81-90 91 and above
64.8 27.0 7.6 0.6 Gender Men Women 46.6 53.4 Ethnicity Chinese Malay Indian Other 83.3 9.2 6.1 1.4 Marital Status Married Widowed Separated Divorced Never married 65.1 26.4 0.7 2.5 5.3 Housing Type
Public flats, 1-2 rooms Public flats, 3 rooms and above Private housing Others 7.2 79.9 12.4 0.5 Education
No formal education Primary education Secondary and above
28.8 37.3 33.9
Total number of diseases (Range: 0-10)A
1.79 [0.03] Activities of Daily Living limitations
None 1 2 or more
Table 1: (Continued)
Variable
Weighted mean [SE]/ Weighted percentage
(N=4522)
Instrumental Activities of Daily Living limitations None
1 2 or more
91.3 3.5 5.1 Smoking status Current smoker Former smoker Never smoked 12.1 14.4 73.5
Clinically Significant Depressive Symptoms Yes
No
15.2 84.8 Cognitive impairment categories
Intact Mildly impaired Moderately impaired 85.6 11.6 2.8 A
Diseases include: Heart problems, cancer, cerebrovascular disease, dementia, high blood pressure, diabetes, respiratory illness, digestive illness, kidney and liver ailments, and osteoporosis and arthritis.
Note: Percentages were weighted to account for oversampling.
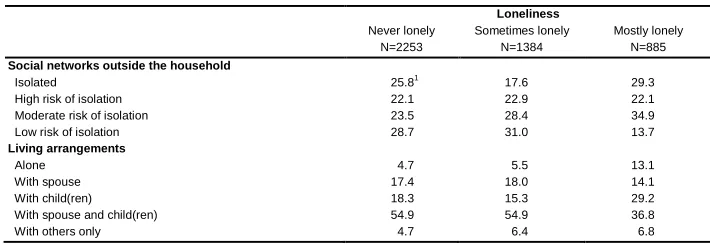
Table 2: Distribution of social networks outside the household and living arrangements by extent of loneliness
Loneliness Never lonely N=2253 Sometimes lonely N=1384 Mostly lonely N=885
Social networks outside the household
Isolated High risk of isolation Moderate risk of isolation Low risk of isolation
25.81 22.1 23.5 28.7 17.6 22.9 28.4 31.0 29.3 22.1 34.9 13.7 Living arrangements Alone With spouse With child(ren) With spouse and child(ren) With others only
4.7 17.4 18.3 54.9 4.7 5.5 18.0 15.3 54.9 6.4 13.1 14.1 29.2 36.8 6.8 1
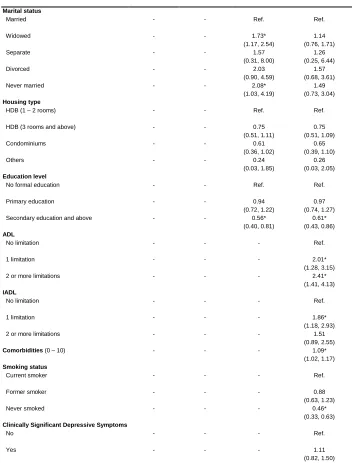
Table 3: Unadjusted and adjusted associations of loneliness, living
arrangements, and social networks outside the household with all-cause mortality (N=4,522)
Variables / Model Unadjusted model HR (95% CI)
Adjusted models Model 1
HR (95% CI)
Model 2 HR (95% CI)
Model 3 HR (95% CI) Loneliness Not lonely Sometimes lonely Mostly lonely Ref. 1.50* (1.18, 1.92) 1.91* (1.46, 2.51) Ref. 1.55* (1.21, 1.99) 1.82* (1.38, 2.40) Ref. 1.41* (1.09, 1.82) 1.62* (1.22, 2.14) Ref. 1.44* (1.12, 1.86) 1.34 (0.99, 1.82) Living arrangements Alone With spouse With child(ren)
With spouse and child(ren)
With others only
0.98 (0.61, 1.57) 0.85 (0.61, 1.17) 1.19 (0.91, 1.54) Ref. 1.73* (1.12, 2.68) 0.79 (0.49, 1.28) 0.85 (0.61, 1.18) 1.07 (0.83, 1.40) Ref. 1.52 (0.98, 2.36) 0.47* (0.25, 0.91) 0.90 (0.64, 1.26) 0.62* (0.43, 0.91) Ref. 0.91 (0.53, 1.56) 0.71 (0.35, 1.41) 0.90 (0.64, 1.26) 0.97 (0.65, 1.44) Ref. 1.31 (0.76, 2.24)
Social network outside the household
Isolated
High risk of isolation
Moderate risk of isolation
Low risk of isolation
2.07* (1.50, 2.85) 1.87* (1.34, 2.60) 1.46* (1.05, 2.04) Ref. 1.97* (1.42, 2.73) 1.77* (1.26, 2.47) 1.35 (0.96, 1.89) Ref. 1.45* (1.03, 2.04) 1.39 (0.99, 1.94) 1.38 (0.98, 1.95) Ref. 1.28 (0.90, 1.82) 1.19 (0.84, 1.67) 1.36 (0.97, 1.91) Ref. Age
60 – 70 years
71 – 80 years
81 – 90 years
91 and above
Table 3: (Continued) Marital status Married Widowed Separate Divorced Never married - - - - - - - - - - Ref. 1.73* (1.17, 2.54) 1.57 (0.31, 8.00) 2.03 (0.90, 4.59) 2.08* (1.03, 4.19) Ref. 1.14 (0.76, 1.71) 1.26 (0.25, 6.44) 1.57 (0.68, 3.61) 1.49 (0.73, 3.04) Housing type
HDB (1 – 2 rooms)
HDB (3 rooms and above) Condominiums Others - - - - - - - - Ref. 0.75 (0.51, 1.11) 0.61 (0.36, 1.02) 0.24 (0.03, 1.85) Ref. 0.75 (0.51, 1.09) 0.65 (0.39, 1.10) 0.26 (0.03, 2.05) Education level
No formal education
Primary education
Secondary education and above
- - - - - - Ref. 0.94 (0.72, 1.22) 0.56* (0.40, 0.81) Ref. 0.97 (0.74, 1.27) 0.61* (0.43, 0.86) ADL No limitation 1 limitation
2 or more limitations
- - - - - - - - - Ref. 2.01* (1.28, 3.15) 2.41* (1.41, 4.13) IADL No limitation 1 limitation
2 or more limitations
- - - - - - - - - Ref. 1.86* (1.18, 2.93) 1.51 (0.89, 2.55)
Comorbidities (0 – 10) - - - 1.09*
(1.02, 1.17) Smoking status Current smoker Former smoker Never smoked - - - - - - - - - Ref. 0.88 (0.63, 1.23) 0.46* (0.33, 0.63)
Clinically Significant Depressive Symptoms
Table 3: (Continued)
Cognitive Impairment categories
Intact
Mildly impaired
Moderately impaired
-
-
-
-
-
-
-
-
-
Ref. 1.02 (0.75, 1.39)
0.96 (0.63, 1.47)
* for p<0.05
Model 1: Individual-level + Household-level + Societal-level loneliness Model 2: Model 1 + socio-demographic variables
Model 3: Model 2 + health status indicators
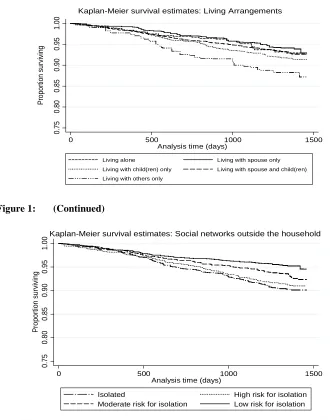
Figure 1 presents the unadjusted Kaplan-Meier survival curves for loneliness, living arrangements, and social networks outside the household. For loneliness, at any time point the probability of dying from any cause was the lowest among those not lonely at baseline and the highest among those most lonely. With regard to living arrangements, this probability was the lowest among those living with spouse only and the highest among those living with others. Finally, in the context of social networks outside the household, the lowest likelihood of all-cause mortality was for those at low risk of isolation at baseline.
Figure 1: Unadjusted Kaplan-Meier survival curves for loneliness, living arrangements, and social networks outside the household
0.
75
0.
80
0.
85
0.
90
0.
95
1.
00
Pro
p
o
rt
io
n
su
rvi
vi
n
g
0 500 1000 1500
Analysis time (days)
Not lonely Sometimes lonely
Mostly lonely
Figure 1: (Continued)
0.
75
0.
80
0.
85
0.
90
0.
95
1.
00
Pro
p
o
rt
io
n
su
rvi
vi
n
g
0 500 1000 1500
Analysis time (days)
Living alone Living with spouse only Living with child(ren) only Living with spouse and child(ren) Living with others only
Kaplan-Meier survival estimates: Living Arrangements
0.
75
0.
80
0.
85
0.
90
0.
95
1.
00
Pro
p
o
rt
io
n
su
rvi
vi
n
g
0 500 1000 1500
Analysis time (days)
Isolated High risk for isolation Moderate risk for isolation Low risk for isolation
In the unadjusted Cox proportional hazard models, loneliness and the two indicators of social isolation had a significant association with all-cause mortality. The significant association of loneliness with all-cause mortality, though attenuated, was maintained through the sequential adjusted models (Table 3). In the final model (Model 3), even after adjusting for the two indicators of social isolation, socio-demographics and health status indicators, the likelihood of dying was significantly higher for those sometimes lonely (1.44 [1.12-1.86]) and marginally significant (p=0.059) for those mostly lonely (1.34 [0.99-1.82]), relative to those not lonely. While living arrangement was not associated with all-cause mortality after adjusting for loneliness and social networks outside the household (Model 1), on further adjustment for socio-demographics (Model 2), those living alone (0.47 [0.25-0.91]) and those living with child(ren) (0.62 [0.43-0.91]) had a significantly lower likelihood of dying relative to those living with spouse and child(ren). However, these significant associations became non-significant on controlling for health status indicators (Model 3). Similarly, the significant association of social networks outside the household with all-cause mortality (Models 1 and 2), with greater risk for those isolated and at high risk of isolation became non-significant once health status of the elderly was accounted for (Model 3). In the final model, the oldest old, females, Malays, individuals with a greater number of ADLs and chronic diseases, and current smokers had the highest mortality risk. Education was protective: older adults with secondary levels of education or higher were half as likely to die compared to older adults with no formal education. The p-values of the tests, globally as well as for each dimension of loneliness, and the plots (not shown) for each dimension based on Schoenfeld residuals indicated no deviations from the proportional hazard assumption.
Results of the sensitivity analysis (not shown), which utilized continuous scale scores for loneliness and social networks outside the household, were comparable to the primary analysis described above. In the model that included loneliness, living arrangements, social networks outside the household, socio-demographics, and health status indicators (corresponding to Model 3 above) of the first three variables, only individual-level loneliness was associated with all-cause mortality, the hazard ratio being 1.07 (1.02-1.12).
4. Discussion
between social relationships and living arrangements and mortality (Holt-Lunstad et al. 2010; Luo et al. 2012).
We acknowledge that the hazard ratio might also be an underestimate of the effect of loneliness on mortality, because while we have information on social networks outside of the household and living arrangements we do not have any information on the quality of these relationships (Holt-Lunstad et al. 2010).
The findings of our study confirmed that while loneliness is related to a greater risk of mortality, social networks and living arrangements are not. Thus loneliness and social isolation are distinct concepts which require targeted programmatic and policy interventions. The Singapore government has consistently supported multi-generational housing through incentive schemes (InfoWEB 2014). Our suggestion is that while this is necessary it may not be sufficient. We found living arrangements were not associated with a greater risk of mortality, suggesting that even if older people live with their families, they may still have feelings of loneliness. Our findings highlight the need for a multidisciplinary approach to policy and programming for older adults who report feelings of loneliness in the community. From a social perspective, programs that encourage intergenerational bonding, particularly programs that are supportive of increased interaction among family members within households (either by facilitating space, time, or support, e.g., work-life balance programs, caregiver support programs) may decrease feelings of loneliness among older family members. From a psychological perspective, innovative programs (e.g., support for second careers, additional education) that target renewing older persons’ sense of purpose may reduce feelings of loneliness (Schindler, Staudinger, and Nesselroade 2006; Staudinger and Kunzmann 2005).
5. Acknowledgements
References
Basu, R. (2012). Old and depressed. The Sunday Times.
Bowling, A.G.E. (1998). The association between social networks and mortality in later life. Reviews in Clinical Gerontology 8(4): 353−361. doi:10.1017/S0959259 89800848X.
Cacioppo, J.T., Hawkley, L.C., and Berntson, G.G. (2003). The anatomy of loneliness.
Current Directions in Psychological Science 12(3): 71−74. doi:10.1111/1467-8721.01232.
Cacioppo, J.T., Hawkley, L.C., Crawford, L.E., Ernst, J.M., Burleson, M.H., Kowalewski, R.B., and Berntson, G.G. (2002). Loneliness and health: potential mechanisms. Psychosom Med 64(3): 407−417. doi:10.1097/00006842-200205000-00005.
Chan, A. (1997). An overview of the living arrangements and social support exchanges of older Singaporeans. Asia Pac Popul J 12(4) 35−50.
Chan, A., Malhotra, C., Malhotra, R., and Ostbye, T. (2011). Living arrangements, social networks, and depressive symptoms among older men and women in Singapore. International Journal of Geriatric Psychiatry 26: 630−639.
doi:10.1002/gps.2574.
Davis, M.A., Moritz, D.J., Neuhaus, J.M., Barclay, J.D., and Gee, L. (1997). Living arrangements, changes in living arrangements, and survival among community dwelling older adults. Am J Public Health 87(3): 371−377.
doi:10.2105/AJPH.87.3.371.
Eriksson, B.G., Hessler, R.M., Sundh, V., and Steen, B. (1999). Cross-cultural analysis of longevity among Swedish and American elders: the role of social networks in the Gothenburg and Missouri longitudinal studies compared. Arch Gerontol Geriatr 28(2): 131−148. doi:10.1016/S0167-4943(98)00135-6.
Glass, T.A., Mendes de Leon, C.F., Seeman, T.E., and Berkman, L.F. (1997). Beyond single indicators of social networks: a LISREL analysis of social ties among the elderly. Soc Sci Med 44(10): 1503−1517. doi:10.1016/S0277-9536(96)00270-5. Hessler, R.M., Jia, S., Madsen, R., and Pazaki, H. (1995). Gender, social networks and
Holt-Lunstad, J., Smith, T.B., and Layton, J.B. (2010). Social relationships and mortality risk: A meta-analytic review. PLoS Med 7(7).
doi:10.1371/journal.pmed.1000316.
Hughes, M.E., Waite, L.J., Hawkley, L.C., and Cacioppo, J.T. (2004). A Short Scale for Measuring Loneliness in Large Surveys: Results From Two Population-Based Studies. Res Aging 26(6): 655−672. doi:10.1177/0164027504268574.
InfoWEB, H. (2014). New flats from HDB: Multi-generation Priority Scheme. http://www.hdb.gov.sg/fi10/fi10321p.nsf/w/BuyingNewFlatPriority?OpenDocu ment#MGPS.
Iwasaki, M., Otani, T., Sunaga, R., Miyazaki, H., Xiao, L., Wang, N., and Suzuki, S. (2002). Social networks and mortality based on the Komo-Ise cohort study in Japan. Int J Epidemiol 31(6): 1208−1218. doi:10.1093/ije/31.6.1208.
Kohout, F.J., Berkman, L.F., Evans, D.A., and Cornoni-Huntley, J. (1993). Two shorter forms of the CES-D (Center for Epidemiological Studies Depression) depression symptoms index. Journal of Aging and Health 5(2): 179−193.
doi:10.1177/089826439300500202.
Li, L.W., Zhang, J., and Liang, J. (2009). Health among the oldest-old in China: which living arrangements make a difference? Soc Sci Med 68(2): 220−227.
doi:10.1016/j.socscimed.2008.10.013.
Lubben, J.E. (1988). Assessing networks among the elderly population. Family and community health 11(3): 42−52. doi:10.1097/00003727-198811000-00008. Lubben, J.E. and Gironda, M. (2003). Centrality of social ties to the health and
well-being of older adults. In: Berkman, B. (ed.). Social work and health care in an aging society: Education, policy, practice, and research. Heidelberg: Springer. Lund, R., Due, P., Modvig, J., Holstein, B.E., Damsgaard, M.T., and Andersen, P.K.
(2002). Cohabitation and marital status as predictors of mortality−an eight year follow-up study. Soc Sci Med 55(4): 673−679. doi:10.1016/S0277-9536(01)00219-2.
Luo, Y., Hawkley, L.C., Waite, L.J., and Cacioppo, J.T. (2012). Loneliness, health, and mortality in old age: A national longitudinal study. Social Science and Medicine
74(6): 907−914. doi:10.1016/j.socscimed.2011.11.028.
Malhotra, C., Chan, A., Malhotra, R., and Østbye, T. (2011). Fifteen dimensions of health among older Singaporeans. Current Gerontology and Geriatrics.
doi:10.1155/2011/128581.
Mazella, F., Cacciatore, F., Galizia, G., Della-Morte, D., Rossetti, M., Abbruzzese, R., and Abete, P. (2010). Social support and long-term mortality in the elderly: Role of comorbidity. Archives of Gerontology and Geriatrics 51(3): 323−328.
doi:10.1016/j.archger.2010.01.011.
Olsen, R.B., Olsen, J., Gunner-Svensson, F., and Waldstrom, B. (1991). Social networks and longevity. A 14 year follow-up study among elderly in Denmark.
Soc Sci Med 33(10): 1189−1195. doi:10.1016/0277-9536(91)90235-5.
Pfeiffer, E. (1975). A short portable mental status questionnaire for the assessment of organic brain deficit in elderly patients. J Am Geriatr Soc 23(10): 433−441. Schindler, I., Staudinger, U.M., and Nesselroade, J.R. (2006). Development and
structural dynamics of personal life investment in old age. Psychol Aging 21(4): 737−753. doi:10.1037/0882-7974.21.4.737.
Schoenfeld, D. (1980). Chi-squared goodness-of-fit tests for the proportional hazards regression model. Biometrika 67(1): 145−153. doi:10.1093/biomet/67.1.145. Seeman, T.E. (2000). Health promoting effects of friends and family on health
outcomes in older adults. Am J Health Promot 14(6): 362−370.
doi:10.4278/0890-1171-14.6.362.
Seeman, T.E. and Berkman, L.F. (1988). Structural characteristics of social networks and their relationship with social support in the elderly: who provides support.
Soc Sci Med 26(7): 737−749. doi:10.1016/0277-9536(88)90065-2.
Seeman, T.E., Kaplan, G.A., Knudsen, L., Cohen, R., and Guralnik, J. (1987). Social network ties and mortality among the elderly in the Alameda County Study. Am J Epidemiol 126(4): 714−723.
Shiovitz-Ezra, S. and Ayalon, L. (2010). Situational versus chronic loneliness as risk factors for all-cause mortality. International Psychogeriatrics 22(3).
doi:10.1017/S1041610209991426.
Simon, M.A., Chang, E.-S., Zhang, M., Ruan, J., and Dong, X. (2014). The Prevalence of Loneliness Among U.S. Chinese Older Adults. Journal of Aging and Health
26(7): 1172−1188. doi:10.1177/0898264314533722.
Staudinger, U.M. and Kunzmann, U. (2005). Positive adult personality development adjustment and/or growth? European Psychologist 10(4): 320−329.
doi:10.1027/1016-9040.10.4.320.
Steptoe, A., Shankar, A., Demakakos, P., and Wardle, J. (2013). Social isolation, loneliness, and all-cause mortality in older men and women. Proc Natl Acad Sci U S A 110(15): 5797−5801. doi:10.1073/pnas.1219686110.
Sugisawa, H., Liang, J., and Liu, X. (1994). Social networks, social support, and mortality among older people in Japan. J Gerontol 49(1): S3−S13.
doi:10.1093/geronj/49.1.S3.
Tucker, J.S., Schwartz, J.E., Clark, K.M., and Friedman, H.S. (1999). Age-related changes in the associations of social network ties with mortality risk. Psychol Aging 14(4): 564−571. doi:10.1037/0882-7974.14.4.564.
Wen, M., Cagney, K.A., and Christakis, N.A. (2005). Effect of specific aspects of community social environment on the mortality of individuals diagnosed with serious illness. Social Science and Medicine 61: 1119−1134.