Paper received: 19.02.2008 Paper accepted: 07.07.2008
Relative Decrease of Tracer Gas Concentration as a Measure
of the Ventilation Effectiveness
Simon M uhič1 - M itja M azej2 - Vincenc Butala2’* 1 Sineco d.o.o., Ljubljana, Slovenia
2 U niversity o f Ljubljana, Faculty o f M echanical Engineering, Slovenia
A n analysis o f the ventilation effectiveness m ea su red on a prototype system f o r local air-con d itio n in g na m ed P E R M C S (P ersonal M icroclim ate System ) was m ade based on sim ultaneous m easurem ents o f velocity f i e l d a n d o f tracer g as concentration using the decay method. A new param eter b a sed on a relative decrease o f tracer g a s concentration in the fir s t minute o f system operation d C (l) was introduced. The new ly defined p a ra m e te r has been verified by sim ulation results fr o m com m ercial com p u ta tio n a l f l u i d dynam ics ( CFD) software. The usefulness o f the param eter is the possibility to make qu ick m easurem ents o f the local efficiency o fp e rso n a lize d ventilation systems.
© 2008 Journal o f M echanical Engineering. All rights reserved.
Keywords: air distribution, air conditioning, ventilation, efficiency
0 IN TRO D U CTIO N
H eating, ventilation and air-conditioning (H V A C) system s are m ainly designed to provide
a healthy and com fortable indoor environm ent for
the occupants o f closed spaces. In recent time indoor air quality and therm al com fort o f the occupants have been drawing m ore and more attention [1], People have also becom e more aware o f their satisfaction w ith the therm al environm ent and perception o f the air-quality as w ell as o f the sick building syndrom e (SBS) [2] and different building related health com plaints, such as allergies, headaches and fatigue. Poorly ventilated spaces are the m ain cause o f SBS [3],
w hich depends on different influencing
param eters, such as the type o f ventilation and H V A C system , the hygienic quality o f the inlet air and classical physical factors in environm ent. These param eters interact to influence people’s health conditions and feeling.
D ecreased volum e flow rates o f fresh air into the building consequents m uch worse indoor air quality. This w as coinciding w ith the appearance o f m ore and m ore interior pollutants from num erous sources that represent potential health risk, such as new building materials, furniture, laser printers, photocopiers, detergents, as w ell as people them selves and their activities. A fter the last energy crisis it w as found that indoor air quality also has an econom ic impact. There w ere savings in spite o f increased
ventilation rates which entailed the increased energy use. Namely, buildings with SBS are more expensive because o f decreased productivity, absence o f work and consequently higher health care costs o f employees, as there is a strong
connection betw een these and indoor
environm ent [4] to [6].
Different studies carried out in Slovenia show dissatisfaction o f people w ith the indoor environm ent m ainly in m echanically ventilated buildings [7] to [10] and also the significance o f psychological factors in the evaluation o f indoor environm ent param eters [7], [10] to [12]. Further studies show that displacem ent ventilation is very useful in achieving good air quality, especially when heated sources o f contam inants are present [13]. However, this type o f ventilation could be at the same time problem atic due to the draught and a large vertical tem perature gradient [14] and [15]. Furthermore it has also been shown with analysis that up to 50% o f occupants m ay still be dissatisfied with the therm al environm ent from displacem ent ventilation [16]. The gained conclusions from these studies indicate the need for new, more qualitative ventilation and air- conditioning systems for indoor environments. Considering the influencing param eters, a new approach, based on the philosophy o f excellence for future air-conditioned environm ents was proposed by Fänger [17]. The main idea o f this approach is based on narrow ing the air- conditioned space from the whole room space to
the local space w ithin the occupants’ breathing zone using novel personalized ventilation (PV) system . This system has a local inlet o f fresh air positioned near the occupants’ breathing zone and serves gently a sm all am ount o f cool and clean air close or directly into the breathing zone o f each individual w here it is needed and w ithout causing a draught. A ppropriately designed PV system m akes possible to achieve high local ventilation efficiency and high rates o f personal air in inhaled air w ith a sm all am ount o f fresh personal air. At the same tim e very satisfactory therm al com fort for each occupant is achieved. This concept also enables a sm all degree o f m ixing o f polluted and fresh air, w hich is the m ain problem in classical ventilation system s.
R esearch on different personalized
ventilation applications evaluated num erous advantages o f the system and confirm ed high rates o f personal air in inhaled air, good air quality and therm al com fort in the m ajority o f cases [18] to [23].
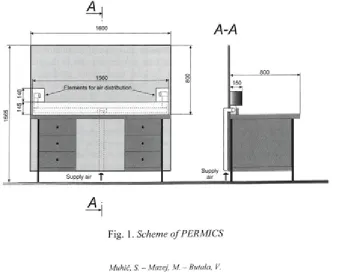
1 PE R S O N A L IZ E D V E N T IL A T IO N SY STEM - PER M IC S
The concept o f PE R M IC S for w orkplaces is m ainly based on an analysis o f other PV and local air-conditioning system s as w ell as on m easurem ents from local air cleaning devices [24] and [25], PERM ICS is designed as an
individual unit for use in offices w ith several em ployees, w ho are sitting in the sam e place for longer periods o f tim e, w hich serves fresh air directly at the w ork area w ith individually regulated m icroclim ate conditions. T he system is designed to be applied in conjunction w ith total-
volum e ventilation and air-conditioning,
especially in spaces w ith high heat and/or pollutant sources, due to the draught risk from larger am ounts o f air or low er air tem peratures. The total-volum e ventilation and air-conditioning system in this w ay assures approxim ately hom ogenous param eters for indoor air overall, w hile the local personalized ventilation assures the fresh air distribution w ithin the breathing zone o f the sitting occupant at the w ork area to fulfil
individual preferences. PE R M IC S can be
connected to the central air-conditioning system in different w ays for exam ple using a flexible duct from the w all or floor at the back side o f an office desk. The system consists o f two air distribution elem ents w ith air ducts, m ounted on an office desk w ith dim ensions 800 x 1600 m m and a height o f 765 m m , supplem ented w ith a partition w all at the back o f the desk w ith a height o f 800 m m above desk level (Fig. 1). A ir distribution elem ents are located w ithin the m icroclim ate zone o f the w ork area and connected w ith the air duct, w hich is separated into tw o parts leading to the elem ents, at the back side o f the partition w all.
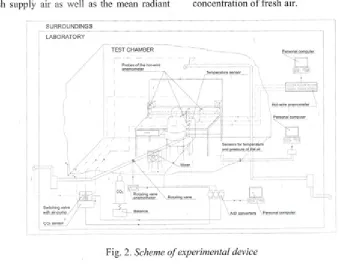
2 E X PER IM EN TA L M ETH O D - M EA SU R EM EN TS A N D SIM U LA TIO N S
The m easurem ents o f ventilation
efficiency o f PER M IC S w ith seated m anikin in the test cham ber w ith dim ensions 4.36 x 4.11 x 2.97 m were m ade using the decay, or tracer step- dow n m ethod [28] and [29]. The schem e o f the experim ental device is show n in Figure 2. Seated m anikin was fixed in an upright position w ith a nose height o f 1.10 m during the entire m easuring
procedure. The air supply rate for the
personalized ventilation system was regulated using a frequency controlled supply fan, w hile the exhaust fan for extracting air w orked under constant operating conditions for the entire experim ent. The personalized ventilation w as the only clean air supply in the test cham ber. The outlet for extracting air was placed under the ceiling o f the test cham ber at coordinates (2.2; 2.8; 2.93) m.
In the experim ent several different operating regim es o f the PER M IC S in term s o f the am ount o f supply air and settings o f inlets
w ere tested. A ltogether eighteen different
m easurem ents w ith variations in air flow rates, angles o f inlet and m eshed m aterial covering inlet w ere made. In all cases isothennal conditions w ere sim ulated in the test cham ber. The tem peratures o f the air in the test cham ber and o f the fresh supply air as w ell as the m ean radiant
tem perature w ere equal. The seated m anikin was therm ally inactive (not heated) so there was no influence o f a therm al plum e on the air distribution in the breathing zone.
O n-line m easurem ents o f volum e flow rate and tem perature o f supply air w ere perform ed using into the supply duct built rotating vane anem om eter and therm ocouples. Carbon dioxide (CO2) concentration was m easured using a system w ith infrared absorption sensor at four locations, nam ely in fresh supply air, at the inlets o f PERM ICS, at the m anikin head and at the outlet from the test cham ber. The C 0 2 concentration was m easured successively at four locations at tim e intervals o f 1 m in using a sw itching valve. In order to decrease m easurem ent errors, every fifth m inute the m easuring system w as “w ashed up” w ith fresh air, since every m easurem ent cycle then starts from the sam e concentration level o f
CO2. In this w ay it is possible to obtain a
concentration reading at a single location every 5 m in, w hich is in order for m easuring ventilation efficiency. For every m easurem ent
C O2 w as injected into the cham ber w ith the
m ixer turned on for 20 m in to achieve a uniform initial tracer gas concentration o f about 3000
ppm in the w hole cham ber. The first
concentration reading w as obtained exactly 60 secs after turning the fans on. A ll results w ere calculated as concentration o f C 0 2 over concentration o f fresh air.
SURROUNDINGS
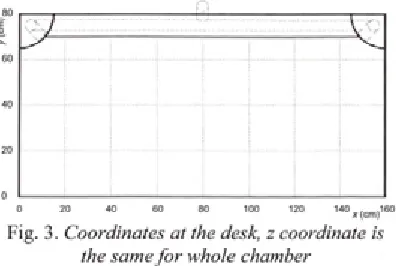
T em perature and relative hum idity o f the air at different locations as w ell as the barom etric pressure in the cham ber w ere m easured using an integrated cham ber m easuring system to verify isotherm al conditions. A ir velocity and turbulence intensity m easurem ents w ere perform ed using a hot-w ire anem om eter H W 3D -E D during the experim ent at three locations, nam ely at the m anikin head, at desk coordinates (80; 0; 110) cm (Fig. 3), and in the m iddle o f the inlet surface o f the left distributional elem ent.
Fig. 3. C o o rd in a tes a t the desk, z coordinate is the sa m e f o r w hole cham ber
3 R E SU L T S A N D D ISC U SSIO N
The obtained m easurem ent results were analysed in accordance w ith the literature [26] to [29], using different indexes for assessing ventilation efficiency. The nom inal tim e constant o f the ventilation system r„ (Eq. 1) is defined as
the ratio o f the room volum e (V ) to the volum e
flow rate (Q ) and represents the shortest possible
air-change tim e that takes to replace the air in the room :
fi, =
-Q ( i )
A verage m ean age o f air in the room rm is defined as the ratio o f the second and the first statistical m om ent o f the frequency distribution:
j't-C c{t)d t
_0_______
CO
\ C f t ) d t
(2)
L ocal m ean age o f air zL at the seated
m anikin head is calculated as a ratio o f the first statistical m om ent o f the frequency distribution and the initial concentration in the room:
l C ( 0 )
(3)
The air-change efficiency ea is calculated
as the ratio betw een the shortest possible tim e that it takes to replace the air r„ and the average tim e that it takes to replace the air in the room , w hich is equal to tw ice the average air age:
* . = ^ 1 0 0 (4)
2 f i n
The local air-change index sL is calculated
as the ratio betw een the shortest possible air-
change tim e r„ and the local m ean age o f air rL:
£l = — 100 (5)
fi.
The results o f defined ventilation
efficiency param eters during m easurem ents w ith variable air supply flow rate are presented in Table 1. The low est average m ean age o f air in the test cham ber w as 72.0 m in at the first m easurem ent M 01.
Table 1. P aram eters a t va ria b le a ir su p p ly flo w
M_01 M_03 M_06 M_08 M_09
Q 1/s 9.5 7.25 7.58 8.49 6.22
^head m/s 0.56 0.24 0.5 0.52 0.24
Tuhead % 15.0 43.2 28.1 21.8 30.3
f i 20,40 m/s 1.37 0.26 0.29 0.45 0.18
2^120,40 % 10.8 36.86 36.55 28.97 44.64
T,n °C 24.2 22.1 19.2 22.4 21.1
C (0) ppm 2766 3150 2946 3110 2641
f i min 54.5 75.8 74.5 62.7 84.3
Tm min 72.0 101.1 96.7 84.0 110.3
fi, min 92.1 120.8 115.5 103.1 140.6
£l % 168.94 159.36 155.1 164.53 166.8
£a % 64.03 59.74 59.73 61.38 63.75
H ypothesis about connection betw een
analysed variables w as tested com puting
inflow rate o f fresh air and the m ean age o f air, as w ell as betw een turbulence intensity at the desk coordinate (120; 40; 100) cm r « i 2o,4o and local air age at the head o f seated m anikin. A significant connection w as found out betw een the local air- change index and air velocity and turbulence intensity at the m anikin’s head.
A new index based on the relative decrease in tracer gas concentration in the first m inute o f system operation d C (l) is defined as:
C (0 )-C (1 ) AC(1)
d C ( 1) :
C (0) C (0) (6)
P earson’s correlation coefficients betw een the ventilation effectiveness variables and the index d C (l) w ere calculated (Table 3). Strong correlation exists betw een d C (l) and m easured air velocity and turbulence intensity as w ell as betw een d C (l) and the calculated local air-change index and local air quality. A new index d C (l) thus com bines both velocity field and air quality param eters.
The dependence betw een the local air-
change index sL and d C (l) for all m easurem ents
is show n in Fig. 4. Superior to other regression
m odels is cubic regression model with the determ ination coefficient (Eq. 7).
£l ( d C (1 )) = 2 4 3 1,3 d C (l) - l 2 2 9 6 d C ( l ) 2 +
+ 2 0 0 9 0 .8<7C(1)3
Results o f the m easurem ents show that air distribution has a m ajor influence on air quality in the breathing zone o f the seated person, which is determ ined by the local air-change index and by
the local age-of-air. Com parison betw een
different operating regim es shows that with a sm all am ount o f lam inar air flow equal air quality param eters as w ith a larger am ount w ith higher values o f turbulence intensity m ay be achieved, because there is no actual m ixing o f air in the lam inar flow case as fresh air is able to push old air out o f the breathing zone.
In the next step the operating conditions from the experim ental analysis o f the PERM ICS w ere sim ulated using com m ercial CFD package CH A M PH O EN ICS. N um erical sim ulation was carried out in two stages because o f the nature o f the problem .
T able 1. Table o f correlation co efficients (* correlation is sig n ifica n t a t 0.05; ** correlation is sig n ifica n t a t 0.01). P C orr is the P earson correlation coefficient, Sig. is significance, a n d N is the n u m b er o f m easurem ents)
Q ^ h e a d ^ Whead V 1 2 0 ,4 0 T U \ 20,40 r L T n
Q P Corr i 1 .357 -,522(*) ,533(‘) -.6 5 2 (0 - .5 1 5 0 -.9 3 8 0 ) -.258 .213
Sig. .073 .013 .011 .002 .014 .000 .151 .198
N 18 18 18 18 17 18 18 18 18
P Corr .357 1 - .8 9 1 0 ) .6 6 7 (0 .080 .368 -,407(*) -.7 4 1 0 ) .098
o i e a d
Sig. .073 .000 .001 .380 .066 .047 .000 .349
N 18 18 18 18 17 18 18 18 18
P Corr -,522(‘) -,891(**) 1 - .6 6 0 ( 0 .024 -.227 .6 2 0 (0 .6 7 7 (0 -.280
± M h e a d
Sig. .013 .000 .001 .464 .182 .003 .001 .130
N 18 18 18 18 17 18 18 18 18
P Corr .533(*) -667(**) -,660(**) 1 - .5 8 2 0 ) -.195 -,499(*) -.251 .094
v \ 2 0 ,4 0
Sig. .011 .001 .001 .007 .219 .018 .157 .356
N 18 18 18 18 17 18 18 18 18
Tu P Corr -.6 5 2 ( 0 .080 .024 -.5 8 2 0 ) 1 .8 2 3 (0 .4 7 4 0 -.401 .185
1m1 2 0 ,4 0
Sig. .002 .380 .464 .007 .000 .027 .055 .239
N 17 17 17 17 17 17 17 17 17
P Corr - .5 1 5 0 .368 -.227 -.195 .8 2 3 0 ) 1 •4 2 7 0 -.6 8 6 (0 -.051
Tt
L/ Sig. .014 .066 .182 .219 .000 .038 .001 .420
N 18 18 18 18 17 18 18 18 18
P Corr -,938(**) -.4 0 7 0 .6 2 0 (0 -,499(*) .474(*) ,427(*) 1 .301 -,507(*)
L m
Sig. .000 .047 .003 .018 .027 .038 .112 .016
N 18 18 18 18 17 18 18 18 18
P Corr -.258 -.741(**) ■677(0 -.251 -.401 -.6 8 6 0 ) .301 1 -.131
Ö L
Sig. .151 .000 .001 .157 .055 .001 .112 .303
N 18 18 18 18 17 18 18 18 18
P Corr .213 .098 -.280 .094 .185 -.051 -.507(*) -.131 1
^ a
Sig. .198 .349 .130 .356 .239 .420 .016 .303
d C (l)
Fig. 4. S c a t t e r g r a p h f o r l o c a l a i r - c h a n g e i n d e x e L ( E P S _ L ) a n d d C ( \ ) d e p e n d e n c e a t t h e h e a d o f
s e a t e d p e r s o n
In the first part o f the sim ulation a steady-state solution o f the velocity and pressure field was calculated and then used in the second part o f sim ulation. The second part w as a transient sim ulation perform ed using a steady-state solution form the first part to determ ine the residence tim e and consequently the field o f contam inant concentration. T herefore a new variable nam ed C l w as defined, w hich represents contam inant concentration in the cham ber. In both stages o f num erical sim ulation the Chen- K im turbulence m odel w as used, w hich has been found the m ost suitable in this case [32], D ifferent supply flow rates w ere sim ulated using
boundary conditions from the various
m easurem ents. T he results o f both m easurem ents and sim ulations for d C (l) in the breathing zone, the decrease o f concentration in the first m inute o f system operation, AC(1), and the relative
difference betw een m easurem ents and
sim ulations relative to m easurem ents are
presented in T able 4. T he differences betw een m easurem ents and sim ulations exist and are up to 26% , m ainly due to the inaccurate determ ination o f the velocity and pressure field in the cham ber. The m ain reasons for these deviations in the determ ination o f the velocity and pressure field are inaccurate boundary conditions as a result o f a very com plex inlet profile at the air inlets o f PE R M IC S and turbulence m odelling. C om plexity o f inlet profile at the air inlets disables accurate description o f boundary conditions used in the CFD m odel.
Table 3. T a b l e o f c o r r e l a t i o n c o e f f i c i e n t s ( * c o r r e l a t i o n i s s i g n i f i c a n t a t 0 . 0 5 ;
* * c o r r e l a t i o n i s s i g n i f i c a n t a t 0 . 0 1 ) .
P C o r r i s t h e P e a r s o n c o r r e l a t i o n c o e f f i c i e n t ,
S i g . i s s i g n i f i c a n c e , a n d N i s t h e n u m b e r o f
m e a s u r e m e n t s .
d C ( \ )
Q P C orr -.273
Sig. .137
N 18
^head P C orr -.635(**)
Sig. .002
N 18
^ Mhead P C orr .529(*)
Sig. .012
N 18
V120,40 P C orr -.329
Sig. .091
N 18
^120,40 P C orr -.318
Sig. .107
N 17
P C orr -.448(*)
Sig. .031
N 18
fin P C orr .380
Sig. .060
N 18
£l P C orr ,762(**)
Sig. .000
N 18
fi, P C orr -,405(*)
Sig. .048
N 18
T he results o f the unsteady sim ulations for tw o cases are show n in Fig. 5. These sim ulated predictions m ay be accurate only if the velocity and pressure field are accurately determ ined. The
difference betw een the m easurem ent and
sim ulation results o f local air-change index was estim ated by com paring sim ulations relative to m easurem ents, using
AgL = gL’sim ~ gumeas 100 (8)
T able 4. R esults o f unsteady sim ulations a n d m easurem ents o f tracer gas concentration decrease in the brea th in g zo n e o f a se a te d p e rso n 1.1 m above the flo o r a n d the relative difference betw een m easurem ents a n d sim ulations
d C ( 1) AC(1) (ppm )
Relative difference regarding m easurem ents
Sim ulation M easurem ent Sim ulation M easurem ent (%)
M_01 0.173 0.137 478 379 -26.0
M _03 0.176 0.240 553 620 10.9
M _06 0.222 0.218 655 652 -0.4
M _08 0.186 0.220 579 685 15.5
M 09 0.211 0.235 557 689 19.2
Fig. 5. Trend o f tracer g a s concentration decrease f o r m easurem ents a n d sim ulation f o r two cases M _06
a n d M J ) 9 (Table 1)
The m axim um difference betw een
m easured and sim ulated local air-change index w as 7.49% (Table 5). H ow ever, the relative decrease o f tracer gas concentration, described w ith index d C (l), w as confirm ed by sim ulation results. Thus, d C (l) m ay be used for estim ation o f ventilation efficiency.
T able 5. L o c a l effectiveness o f ventilation a n d the rela tive difference betw een the results p re d ic te d fr o m the sim ulation a n d the m easurem ents; local a ir a g e a n d the relative difference betw een the results p re d ic te d fr o m the sim ulation a n d the m easurem ents
^L,sim
(%)
^L,meas
(%)
A &
(% )
M 01 156.6 169.0 7.32
M 03 156.6 159.4 1.78
M 06 153.6 155.0 0.92
M 08 156.1 164.6 5.16
M 09 154.3 166.8 7.49
Com parison o f the local air-change index w ith the typical values o f different ventilation types (Table 6) show s that a local ventilation system is advantageous over a conventional
I ventilation system . It has a potential to im prove
the level o f air quality in the breathing zone and to low er energy consum ption for ventilation at the same time.
Table 6. Ventilation effectiveness f o r different
types o f ventilation [32]
V entilation type A ir change efficiency
(% )
Ideal com plete m ixing 50
Piston flow 100
D isplacem ent flow 50-100
4 C O N C L U SIO N S
The perform ed m easurem ents and
sim ulations o f different operational regim es o f PE R M IC S system show that a concept o f personalized ventilation system is very effective. It w as found from m easurem ents that the new ly defined index o f relative decrease o f tracer gas concentration in the first m inute o f system operation d C (l) is connected w ith velocity field as w ell w ith the ventilation effectiveness param eters. T he m ain benefit o f this param eter, verified by sim ulations o f analysed operating conditions, is that it allow s relatively accurate m easurem ents o f local air-change efficiency and m akes them quick and easy in com parison with ordinary ventilation efficiency m easurem ent procedures. The existing m easurem ent procedure can lead to a large degree o f uncertainty in m easurem ents due to each successive reading bringing its ow n uncertainty. The new ly defined param eter d C (l) has the advantage o f direct m easurem ent o f ventilation efficiency in a m uch shorter time.
5 R E FE R EN C ES
[1] B utala V., M uhič S., Turk J., M olan M .,
M andelc-G rom M . and A m erič N. (2001) Indoor air quality and air distribution in occupied spaces-Final report. R esearch project N o. L2-0528-0782-01, U niversity o f L jubljana, Faculty o f M echanical E ngineering.
[2] Indoor A ir Facts N o. 4 (revised, 1991).
Sick B uilding Syndrom e (SBS). U.S. E nvironm ental Protection A gency / O ffice o f A ir and Radiation.
[3] W orld H ealth organization (1984) Indoor
air quality research: E U R O -reports and studies 103. W H O -R egional O ffice for E urope, C openhagen.
[4] U S E P A (1989) E conom ic im pacts o f
indoor air pollution. R eport to congress on Indoor A ir Q uality. Vol. II: A ssessm ent and C ontrol o f Indoor A ir Pollution, O ffice o f air and radiation/U nited States
E nvironm ental Protection A gency
(C hapter 5, E PA Publication No.
E P A /4 0 0 /1 -89/001C ).
[5] W argocki P., W yon D .P., B aik Y.K .,
C lausen G ., Fänger P.O . (1999) Perceived
air quality, sick building syndrom e (SBS) sym ptom s and productivity in an office w ith tw o different pollution loads, Indoor A ir 9, pp. 165-179.
[6] W argocki P., W yon D., Sundell J., C lausen
G., Fänger P. (2000). T he effects o f outdoor air supply rate in an office on perceived air quality, sick building
syndrom e (SB S) sym ptom s and
productivity, Indoor A ir 10, pp. 222-236.
[7] B utala V., M uhič S., M olan M. (2002)
D iagnostic o f IA Q problem s in the central office o f Slovenia Telecom , in: O.
Seppänen, J. Säteri (Eds.), H ealthy
B uildings 2000, E spoo, Finland, pp. 181— 186.
[8] B utala V., N ovak P. (1997) Indoor air
quality and energy use in Slovenia. Indoor+ B uilt Environm ent, pp. 241-249.
[9] B utala V., M uhič S., M olan M ., M andelc-
G rom M ., A m erič N. (2001) Indoor air quality and air distribution in occupied spaces. Final R eport o f the Research Project (in Slovenian). U niversity o f
L jubljana, Faculty o f M echanical
Engineering.
[10] M uhič S., B utala V. (2004) The influence o f indoor environm ent in office buildings on their occupants: expected-unexpected. B uilding and E nvironm ent 39(3). pp. 289- 296.
[11] M uhič S., B utala V. (2002) Im pact o f C 0 2 concentration, tem perature and relative hum idity o f air to the current feeling and health o f w ell-being em ployees in air- conditioned and natural ventilated offices. In: L evin H, editor. 9th International C onference on Indoor A ir Q uality and Clim ate: Indoor A ir 2002. M onterey, CA, U SA . pp. 848-853.
[12] B utala V., M uhič S., M olan M . (2001) The
correlation w ith indoor environm ent
param eters and current feeling o f
em ployees in air-conditioned offices, in: Indoor C lim ate o f B uildings’01, H igh T atra, Slovakia, pp. 261-270.
[13] Brohus H., N ielsen P.V. (1996) Personal
Exposure in displacem ent ventilated
room s. Indoor A ir, 6, pp. 157-167.
w ith displacem ent ventilation. A SH RA E Transactions 96, pp. 1050-1057.
[15] Pitchurov G., N aidenov K ., M elikov A .K ., L angkilde G. (2002) Field Survey o f O ccupants Therm al C om fort in Room s w ith D isplacem ent V entilation. Room vent, C openhagen, pp. 479-482.
[16] N aydenov K., Pitchurov G., N aidenov G., M elikov A.K , (2002) Perform ance o f D isplacem ent V entilation in Practice. R oom vent 2002. Copenhagen, pp. 483- 486.
[17] F änger O le P. (2001) H um an requirem ents in future air-conditioned environm ents. International Journal o f R efrigeration 24, pp. 148-153.
[18] Čerm ak R., M ajer M , M elikov A.K. (2002) M easurem ents and prediction o f inhaled air quality w ith personalized ventilation, Indoor A ir 2002, M onterey, pp. 1054-
1059.
[19] M elikov A.K ., C erm ak R., M ajer M. (2002) Personalized ventilation: evaluation o f different air term inal devices. Energy and B uildings 34(8), pp. 837-844.
[20] Č erm ak R., M elikov A.K. (2003)
Perform ance o f personalized ventilation in a room w ith an under floor air distribution system : transport o f contam inants betw een occupants. In: TK W ai, C Sekhar, D C heong, èditors. H ealthy B uildings 2003,
Singapore: D epartm ent o f Building,
N ational U niversity o f Singapore, pp. 486- 491.
[21] Gori P., G rossi L., V allati A. (2003)
Personalized ventilation: experim ental
apparatus to evaluate high induction air term inal devices. In: T K W ai, C Sekhar, D C heong, editors. H ealthy B uildings 2003.
Singapore: D epartm ent o f Building,
N ational U niversity o f Singapore, pp. 452- 457.
[22] K aczm arczyk J., Z eng Q., M elikov A., Fänger P.O. (2002) The effect o f a
personalized ventilation system on
perceived air quality and SBS sym ptom s, Indoor A ir 2002. M onterey, pp. 1042-
1047.
[23] Y ang J., K aczm artczyk J., M elikov A., Fänger P.O. (2003) The im pact o f a personalized ventilation system on indoor
air quality at different levels o f room air tem perature, H ealthy Buildings 2003. Singapore, pp. 345-350.
[24] G ričar P. (1998) Local air-conditioning o f
w orking places. M.Sc. thesis (in
Slovenian), U niversity o f Ljubljana,
Faculty o f M echanical Engineering. [25] M uhič S. (2001) Quality and distribution
o f air on the w orking places in closed spaces. M .Sc. thesis (in Slovenian), U niversity o f Ljubljana, Faculty o f M echanical Engineering.
[26] Etheridge D., Sandberg M . (1996)
Building V entilation: Theory and
M easurem ent. B ritish Gas, John W iley & Sons.
[27] M undt E., M athisen H.M ., N ielsen P.V.,
M oser A. (2004) V entilation
Effectiveness. REH V A G uidebook No. 2, Forssan, Finland.
[28] Sandberg M., Sjoberg M. (1982) The use o f m om ents for assessing air quality in
ventilated room s. Building and
Environm ent 19, p p .181-197.
[29] Sutcliffe H. (1990) A guide to air change efficiency. Technical note AIV C 28, W arw ick, A ir Infiltration and V entilation Centre, U nited Kingdom .
[30] G rabec I. (1988) Probability and statistics (in Slovenian). Ljubljana, U niversity o f
Ljubljana, Faculty o f M echanical
Engineering.
[31] Rovan J., T urk T. (2001) Analysis o f data w ith SPSS (in Slovenian). Ljubljana, U niversity o f Ljubljana, Faculty o f Econom ics.
[32] M uhič S. (2004) D istribution and Q uality o f A ir at the Local Air Condition. Ph.D. thesis (in Slovenian), U niversity o f
Ljubljana, Faculty o f M echanical
Engineering.