Online at http://desert.ut.ac.ir Desert 20-2 (2015) 231-239
Measure and comparison of economic, social and ecological
sustainability of farming systems in the Marvdasht plain
H. Hasanshahi, H. Iravani
*, Zh. Daneshvar Ameri, Kh. Kalantari
Faculty of Agricultural Economics and Development, University of Tehran, Karaj, Iran
Received: 31 May 2015; Received in revised form: 23 June 2015; Accepted: 29 August 2015
Abstract
Agricultural sustainability refers to the ability of a cropping system to produce, without causing irreversible damage to the ecosystem. There is an increasing need to view cropping systems and identify management practices in a holistic indicator-based impact assessment. The main objective of this study was to compare and rank the cropping systems of the Marvdasht plain in Fars Province; in order to show the gap between them. To achieve this aim, sustainability were divided into four levels based on Composite Index(CI),which is useful for the identification of sustainability and includes three dimension: (1) economical, (2) social, and (3) environmental and consist of 11 indicators. Required data were collected by questionnaire from 200 cropping farmers who were selected through a stratified sampling design from six regions located in Marvdasht plain. The computer software of SPSS was used to analyse the data. Indicators were normalized using the division by means technique and were weighted. The weightings were derived from Principal Component Analysis (PCA). CI was used to map the sustainability levels at the plain. According to classifying CI, four categories were identified, which zone 6 identified as being unsustainable, while two zones 2 and 3 were considered as belonging to the relatively unsustainable and the zone 5 was identified as relatively sustainable and the remaining zones (1,4) were classified as sustainable. We conclude that the usage of multidimensional and holistic CI for analysing sustainability of complex cropping systems is extremely important.
Keywords: Composite index; Cropping system; Ecological sustainability; Economic sustainability; Social sustainability
1. Introduction
Agriculture contributes 24% of global GDP and provides employment to 1.3 billion people or 22%
of the world’s population(Smith et al., 2007). It is a critical sector of the world economy. Agriculture is one of the most important economic sectors in Iran, and comprises a considerably high percentage of production and employment.
About 25% of Iran Gross National Product (GNP), 33% of employment, 25% of non-oil exports, and 80% of food requirements have been provided by the agricultural sector (Karbasioun
Corresponding author. Tel.: +98 26 32206825, Fax: +98 26 32206825.
E-mail address:iravani@ut.ac.ir
As the ways in which cropping systems are managed and evaluated are heavily dependent on human values, economic and social components of cropping systems have been overemphasized in the past. There is an increasing need to view cropping systems and holistically identify remedial management practices (Pacini et al., 2004). Since the publication of the Brundtland report, the concept of sustainability has received increasing attention in agricultural research. There would appear to be some consensus that sustainability has three basic features: environmental soundness, economic viability and social acceptability (Dumanski and Pieri, 2000; Ogaji, 2005). Pannell and Schilizzi (1999) argue that sustainability indicators are practical and reasonable vehicle for attempting to deal with the multifaceted nature of the ambiguous term
‘sustainability’. As understanding of the complex
relationship between agriculture and environment increases, many indicators of agricultural sustainability, environmental sustainability and the effect of agriculture on natural resources and the environment have been developed (Wei et al., 2007). However, links between sustainability indicators and agricultural management practices on one hand, and economic policies on another hand, are not well defined. As a consequence, farmers, policy makers and administrators do not have enough information to alter management systems according to environmental needs (Ahuja, 2003).
Most of the survey on agriculture has been done by economists and is based on farm-level data. Economic studies have focused on the
efficiency of resource allocation and development pattern differences between small and large farms while ignoring the sustainability. According to the sustainability paradigm, no single dimension should be allowed to dominate development decision. In fact, each of the spheres should be taken into equal consideration prior to any economic decision.
There are few studies on sustainability based on an indicators framework. One good example of the application of indicators in sustainability is an index system of sustainable development constructed by Xu (2004), which included five supporting systems consisting of 95 factors that are selected as basic indices at the provincial level. The few studies restricted to some parts of Iran, are marred by limitations of the methods, variables and indicators used, and are limited mainly to the identification of sustainability. There are new systems of agricultural sustainability indicators that stretch beyond the discrete measurement of environmental and economic conditions. Emphasis on social sustainability is influencing the makeup of current sustainability indicators (Meadows, 1994). Thus, good measurements of ecological and economic conditions remain very important to gauging progress toward sustainability. However, other indicators, especially social indicators, are playing a role in determining sustainability in general and agricultural sustainability in particular (Roseland, 1998). Thus, sustainable agricultural development includes three inter connected, mutually inclusive themes, or spheres: the ecology, society and economics (Fig. 1).
Fig. 1. The three dimension of sustainable agriculture
The parameters of sustainable agriculture have grown from an original focus on ecological aspects to include: first economic and then broader social dimension. The core concerns of sustainable agriculture are to reduce negative environmental and health externalities, to enhance and utilize local ecosystem resources, and
preserve biodiversity. More recent concerns include topography, slope, and soil quality; in broader recognition for ecological sustainability in agricultural activities (Saltier et al.,1994;Hayati,
1995; Rezaie-Moghadam, 1997; Ingels et al.,
1997; Comer et al., 1999; Boshard, 2000;
Anderson, 2005). According to sustainable Sustainable
agriculture
Social sustainabilty Economic sustainability
paradigm, mechanization, fertilizer consumption, alternation cultivation, pesticides consumption, and irrigation cycle are the main indications of sustainable agriculture (Gahinl, 1998).
Economic perspectives on sustainable agriculture attempt to assign value to ecological parameters and include area under cultivation, agricultural productivity, and income earned from agriculture (Karami, 1995; Herzog and Gotsch, 1998; Pannell et al., 2000; Comer et al., 1999; Lyson,1998;Glenn,2000;Andreoli and Tellarini, 2000; Koeijer et al., 2002; Rasul and Thapa,
2003;Gafsi et al.,2006;Passel et al., 2006). In social aspect, sustainable agriculture is often associated with farmers’ participation, their satisfaction, technical knowledge, ability of farmers and their social capital. (Guy and Rogers, 1999)
This paper is concerned with the identification and interpretation of sustainability dimensions. The purpose of this paper is to provide an analysis tool for improving the sustainability of cropping systems, in which a holistic impact assessment system is adopted. The intensively cropped systems of the Marvdasht plain is taken as the case study area. As a main agricultural production centre in Iran, the Marvdasht plain has different agricultural1attributes/characteristic in various proportions. Agricultural production in this plain includes a variety of activities and the obtained diverse results make it much more difficult to evaluate their sustainability.
In this research, an approach to construct composite index (CI) was first developed. Then the main results of sustainability disparities based on the collected data were analyzed. This allows a clearer comparison of sustainability levels. High or low levels of each characteristic (sub-indicator) were identified, sustainability levels c mapped, and possible strategies, which can be used to reduce the imbalances proposed. This new information can contribute to development planning, policy making and implementation.
2. Materials and Methods
2.1. The study area
Marvdasht plain is in the centre of Fars Province, with an area of 3687 km2. It is the largest
agricultural zone (containing 14% of the cultivated land) in the Fars Province. Irrigation is applied intensively and extensively, and agricultural water use accounts for approximately
94% of total water consumption in this region. In addition to water, farmers in the region use fertilizers intensively in order to maximize crop yields. However, there is evidence that farmers in this area over-fertilize and over-irrigate their crops (Shahvali, 2008; Mohammadi, 2009).
2.2. Methodology
The statistical population of this study consisted of wheat cropping farmers. Sample size included 200 persons selected through stratified random sampling. A questionnaire, including closed questions, was prepared and used for data collection. To pilot test the survey questionnaire, 30 interviews were carried out with selected farmers and some questions were changed, added, or deleted where necessary. A total of 200 questionnaires were completed and various quantitative methods of data analysis were applied. Descriptive statistical analyses, such as frequency tables, percentage, and mean were used to determine the general status of the studied society. Furthermore, composite index (CI) was used to evaluate of agricultural sustainability. The computer software of SPSS was used for data analysis.
(1)
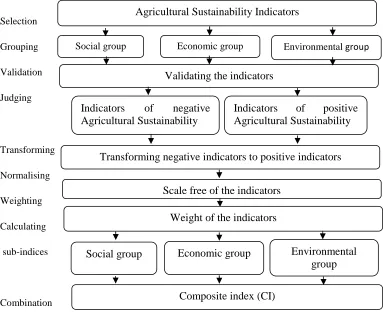
2.2.1. Selection of Indicators
Good indicators provide key information on environmental, social or economic system and they allow analysis of trends and cause and effect of relationships (Veleva and Ellenbecker, 2000).
Indicators should be separated from disparity-oriented indicators. Because of the limitations to related data, 11 indicators in three dimensions based on the conceptual framework were selected for the study.
Selection
Grouping
Validation
Judging
Transforming
Normalising
Weighting
Calculating
sub-indices
Combination
Fig. 2. Methodology of evaluation of Agricultural Sustainability (Source: Adopted from Krajnc and Glavic, 2005)
2.2.2. Grouping of Selected Indicators
Selection of indicators are fulfilled in grouping framework. The main dimensions of sustainabilty includes: Social, d=1, Economical, d=2 and Environmental, d=3 groups of indicators (Fig. 2).
2.2.3. Validation of the Indicators
According to Girardin et al. (1999) the methodology underlying the elaboration and development of indicators should fit scientific standards, which implies a procedure of validation. At this stage, the relevance and applicability of the indicators to the main research
goal, have been investigated by agricultural science experts and informants selected from academic members of Iranian faculties of agriculture who judged the validity of indicators based on mentioned objectives.
2.2.4. Judging the Indicators
Indicators have positive and negative impact on sustainability; so for aviodance of bias in the final result, positive and negative indicators should be discriminated. These two types of indicators are also denoted at this stage.
Agricultural Sustainability Indicators
Environmentalgroup
Social group Economic group
Validating the indicators
Indicators
of
positive
Agricultural Sustainability
Indicators
of
negative
Agricultural Sustainability
Transforming negative indicators to positive indicators
Scale free of the indicators
Weight of the indicators
Composite index (CI)
I
2.2.5. Transforming the Indicators
In this section, indicators that have negative impact on sustainability were converted to positive indicators. There are two methods for changing negative indicators to positive ones; converting the value of the indicators and subtracting from the absolute value (Kalantari, 2001). We employed the first method by using the following formula:
(2)
Xij is the indicators with positive value, Yij is value of the negative indicator j for county i.
2.2.6. Normalizing the Indicators
As each index uses different measurement scales, an elimination of scale bias was made. There are many methods for making the indicators scale-free. These include: ranking, standardized score, re-scaling, distance to a reference, categorical scales, indicators above or below the mean and division by mean (Nardo et al., 2005). The method of dividing by mean was used to remove the scale biases. As Kalantari (2001) pertinently remarks, "If the observation for each indicator is
divided by the mean, one can get rid of the bias of scale without affecting the relative position of the region in the series. The transformation does not disturb the "dispersion" of the variables, since the coefficient of variation of the original series is retained as the standard deviation or the coefficient of variation of the transformedseries.”
We adopted the division by mean as follows:
(3)
Zij is the normalized indicator matrix with scale free value, Xij is the value of indicator j for county i and j X is the mean value of indicator j.
2.2.7. Weighting the Indicators
After the elimination of scale bias, a common practice in constructing CI is to assign a weight to each sub-indicator, and then use certain aggregation functions to calculate CI for a set of individual indicators. The multivariate method of
‘PrincipalComponentsAnalysis’ is suggested for computing CI. In the present study, principal componentsanalysis method was used to derive weighs for each of the indicators. The weights for sustainability dimensions were calculated.
Table 1. Total variance explained
Component Eigenvalues % of Variance % Cumulative
1 8.576 37.28 37.28
2 7.413 32.22 69.51
3 4.26 18.55 88.06
Table 2. Indicators used in this research and their weight extracted with Principle Component Analysis(PCA)
Indicators weightes
Soil fertility 0.95
Fertilizer application 0.65
Pesticide application 0.84
Water application 0.93
Area cultivated 0.82
Crop yeild 0.80
Income 0.92
Profit 0.78
Employment 0.85
Educated programs 0.74
Farmers’ socia situation 0.91
(4)
CI: Composite index I: Normalised indicators W: weighte
In this research, sustainability situation is divided into quadruple group which includes
ISDM (Interval Of Standard Deviation from the Mean). In this method, data were divided into four levels. A= Unsustainable, B= Relatively unsustainable, C= Relatively sustainable, D= Sustainable.
A: Min≤A < Mean-St.d (5)
C: Mean≤ C < Mean+St.d (7)
D: Mean+St.d≤ D < Max (8)
3. Results and Discussion
The results of descriptive analysis of the data showed that, in terms of age structure, about 14.5% of the farmers were 20-40 years, 25.5% were in 40-60 years and 60% in their 60s. In respect to literacy, about 75% of farmers were illiterate, 17% attended primary school, 6% of them had received secondary and high school education and 2% of them had high school graduation certificate. Income of farmers is also a crucial factor in achieving sustainable agriculture. And about 68.3% of the respondents have less than or equal to 1000000, 14.8% of them have 1000000-2000000, 6.3% of them have 2000000-3000000, 10.6% of them have 3000000 and more. The average farming land size and cultivated lands in the studied area were 10 and 4.5 ha, respectively. The average wheat production per hectare was 4.5 tons.
To assess sustainability of agricultural sector, indicators studied were: soil fertility, fertilizer application, pesticide application, water application, area cultivated, crop yeild, income, profit, employment, education programs, and
farmers’social situation.
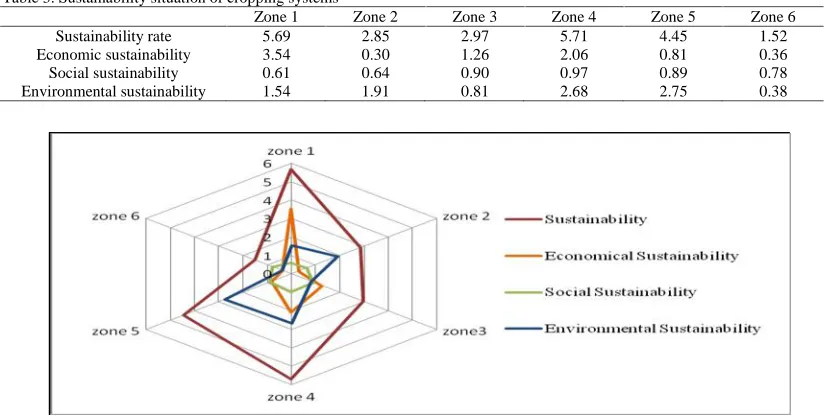
Agricultural sustainability is the aggregate of these indices, which are presented in Figure 4. The proposed methodology to compare and rank all 6 zones, with reference for each dimension in the first part and then to combine sub-indices to construct the final CI in the second part, were applied. The results are presented in Table 3. From the point of view of social sustainability, it is found that zone 4 is at the top and zone 1 is at the bottom of the ranking scale, while this zone is at the top in terms of economic dimension. Besides, zone 5 has the highest rank in terms of environmental, and zone 4 is placed in the second position. Social sustainability in zone 4 (0.97) is at the top of the ranking and zone 3(0.90), 5(0.89), 6(0.78), 2 (0.64) and 1 (0.61), respectively, are placed in the next positions. So, zone 4 and 3 are relatively sustainable but zone 2 is not from the point of view of social dimension. Zone 1(3.54) emerges as the most sustainable regarding economic dimension and zone 4(2.06) takes the second position and zone3 (1.26), 5(0.81), 6(0.36) and 2(0.30), respectively, are placed in the next positions. Besides, zone 4(2.68) has the highest rank in terms of environmental sustainability and zone 5(2.75), 2(1.91), 1(1.54), 3(0.81) and 6(0.38) are placed in the next positions.
Table 3. Sustainability situation of cropping systems
Zone 1 Zone 2 Zone 3 Zone 4 Zone 5 Zone 6
Sustainability rate 5.69 2.85 2.97 5.71 4.45 1.52
Economic sustainability 3.54 0.30 1.26 2.06 0.81 0.36
Social sustainability 0.61 0.64 0.90 0.97 0.89 0.78
Environmental sustainability 1.54 1.91 0.81 2.68 2.75 0.38
It is sufficient here to note that zone 1 and 4 have the highest level of sustainability for CI, on the other extreme, zone 6 is the least sustainable (Table 3). Also, four classifications were chosen. A classificatory scheme is adopted which divides zones into four development categories: unsustainable, relatively unsustainable, relatively sustainable and sustainable. Category 1
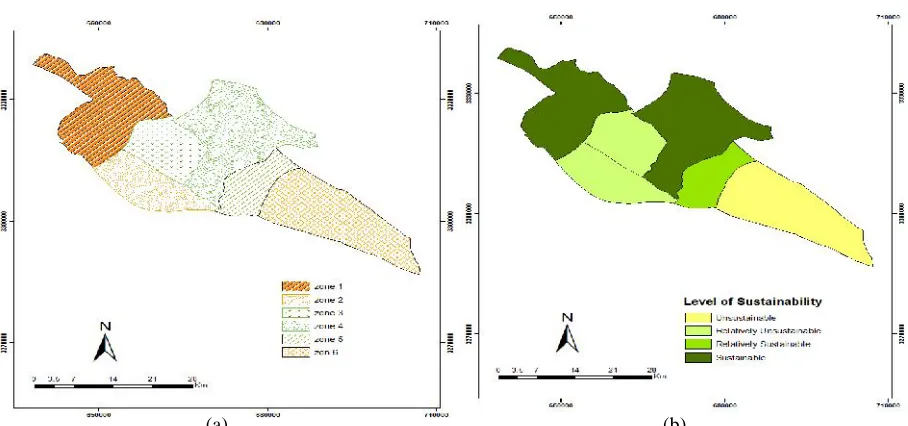
(unsustainable) covers zone 6, category 2 (relatively unsustainable) has two zones 2 and 3 and category 3 (relatively sustainable) includes zone 5 and category 4 (sustainable) has two zones 1 and 4. The spatial pattern of agricultural sustainability based on the CI is presented in Figure 4b.
(a) (b)
Fig. 4. Six zones in the study area (a), classifying levels of sustainability in Marvdasht Plain (b) (source: paper findings)
4. Discussion and Conclusion
The key contributions of this research are characterizing sustainability along three domains instead of just the single environmental domain common to current sustainability discussion. Attempts have been made to compile information on how the indices were formulated using nine steps, namely: selection, grouping, validation, judging, transforming normalizing, weighting, calculating and combining sub-indices.
This paper has examined the spatial pattern variations in the sustainability of Marvdasht plain with the application of a tool suggested for the assessment of the sustainability from a general and quantitative perspective. It purpose of CI is to display performance of agricultural regions along all the three dimensions of sustainability: social, economic and environmental, in order to provide a good guidance for decision-making. This gives users the ability to make the linkages between the different elements of sustainability. The indices developed for this research move a step closer to
both understanding sustainability more holistically and developing a method for policy makers.
According to the classifying CI, four categories were identified with zone 6 known as being unsustainable (Category 1), while two zones 2 and 3 were considered as belonging to the relatively unsustainable (category 2) and the zone 5 was identified as relatively sustainable (Category3) and the remaining zones (1,4) were classified as sustainable (Category 4). The results show that CI will be based on natural resources, human resources and on the relation between agriculture and the general economic development.
because of over-fertilize and over-irrigate their crops, are in the worst position. Thus, it is recommended that farmers are educated about best agricultural activities.
One final note, the study recommend that the usage of multidimensional and holistic CI for analyzing sustainability is extremely important. More specifically, it is a prerequisite for every judgment about sustainability condition, resource allocation, planning appropriate sustainability policies and executing those approaches, to reach sustainability.
Acknomledgements
The research reported here was financially supported by the College of Agricultural and Natural Resources, University of Tehran, Iran. The authors want to express their gratitude for this support.
References
Abdollahzadeh, G., Kh. Kalantari, A. Asadi, R. Fisher, Zh. Daneshvar Ameri, 2012. Spatial Patterns of Agricultural Development: Application of the Composite Index Approach. Journal of Agricultural Science and Technology, 14; 51-64.
Ahuja, L.R., 2003. Quantifying agricultural management effects on soil properties and processes. Journal of Geoderma, 116; 1–2.
Anderson, R.L., 2005. Improving sustainability of cropping systems in the central Great Plains. Journal of sustainable Agriculture, 26; 97-114.
Andreoli, M., V. Tellarini, 2000. Farm sustainability evaluation: Methodology and practice. Journal of Agriculture, Ecosystems and Environment, 77; 43-52. Bosshard, A., 2000. A methodology and terminology of
sustainability assessment and its perspectives for rural planning . Journal of Agriculture, Ecosystems and Environment, 77; 29-41.
Comer, S., E. Ekanem, S. Muhammad, S. Singh, F. Tegegne, 1999. Sustainable and conventional farmers: A comparison of socioeconomic characteristics, attitude, and beliefs. Journal of Sustainable Agriculture, 15; 1.
Darvishi, A.K., 2003. Capacity and Ability of Sustainable Development in Iran. Iranian Journal of Agricultural and Ecologic Development, 5; 30-53.
Dumanski, J., C. Pieri, 2000. Land quality indicators: research plan. Agriculture, Journal of Ecosystems and Environment, 81; 93–102.
Gafsi, M., B. Legagneux, G. Nguyen, P. Robin, 2006. Towards sustainable farming systems: Effectiveness and deficiency of the French procedure of sustainable agriculture. Journal of Agricultural Systems, 90; 226–
242.
Gahinl, A., 1998. The Search for Useful Indicators: Attempts to Measure Agricultural Sustainability. Journal of Environment, 38; 15–31.
Girardin, P., C. Bockstaller., H. Van der Werf, 1999. Indicators: Tools to Evaluate the Environmental Impacts of Farming Systems. Journal of Sustainabale and Agriculture, 13; 5–21.
Guy, S.M., D.L, Rogers, 1999. Community surveys: Measuring citizens’ attitudes toward sustainability.
Journal of Extension, 37; 3.
Hayati, D., 1995. Factors influencing technical knowledge, Sustainable agriculture knowledge and sustainability of farming system among wheat producers in Fars province. M.Sc. thesis, agricultural extension and education, University of Shiraz, Iran.
Herzog, F., N. Gotsch, 1998. Assessing the sustainability of smallholder tree crop production in the tropics: A methodological outline. Journal of Sustainable Agriculture, 11; 4.
Ingels, C., D. Campbell, M.R. George, E. Bradford, 1997. What is sustainable agriculture? Available from http://www.sarep.ucdavis.edu/concept.htm.
Karami, E., K. Rezaei Moghaddam, 1998. Poverty and Sustainable Agriculture: A Qualitative Analysis. Iranian Quarterly Journal of Rural Development Studies, 2; 1-29.
Karami, E., 1995. Agricultural Extension: Question of sustainable development in Iran. Journal of Sustainable Agriculture, 5; 1-2.
Karbasioun, M., M. Mulder., H. Biemans, 2008. Changes and Problems of Agricultural Development in Iran.
World Journal of Agricultural Science, 4; 759-769. Kalantari, Kh., 2001. Regional Development Planning;
Theories And Techniques, Khoshbin Publications, Tehran, Iran, P; 290.
Koeijer, D., A. Wossink, C. Struik, A. Renkema, 2002. Measuring agricultural sustainability in terms of efficiency: the case of Dutch sugar beet growers. Journal of Environmental Management, 66; 9-17. Krajnc, D., P. Glavic, 2005. How to Compare Companies
on Relevant Dimensions of Sustainability. Journal of Ecological and Economic, 55; 551–563.
Lyson, T.A., 1998. Environmental, economic and social aspects of sustainable agriculture in American Land Grant Universities. Journal of Sustainable Agriculture, 12; 2-3.
Meadows, D.H., 1994. The Limits to Growth: A Report for
the Club of Rome’s Project on the Predicament of Mankind. New York, Report number: 1, PP; 33-42. Mohammadi, H., 2009. Investigation of water productivity
in Marvdasht. Journal of Agricultural Economics, PP; 25-37.
Ogaji, J., 2005. Sustainable agriculture in the UK. Environment, Journal of Development and Sustainability, 7; 253–270.
Pacini, C., A. Wossink, G. Giesen, C. Vazzana, R. Huirne, 2004. Evaluation of sustainability of organic, integrated and conventional farming systems: a farm and field-scale analysis. Journal of Agriculture, Ecosystems and Environment, 92; 273–288.
expedience? Journal of Sustainable Agriculture, 13; 57–
66.
Pannell, D.J., N.A. Glenn, 2000. Frame work for the economic evaluation and selection of sustainability indicators in agriculture. Journal of Ecological Economics, 33; 135–149.
Passel, S.V., F. Nevens, E. Mathijs, G.V. Huylenbroeck, 2006. Measuring farm sustainability and explaining differences in sustainable efficiency. Journal of EcologicalEconomics, 3; 135-138.
Rasul, G., G.B. Thapa, 2003. Sustainability Analysis of Ecological and Conventional Agricultural Systems in Bangladesh. Journal of World Development, 31; 1721–
1741.
Rezaei Moghaddam, K., E. Karami, J. Gibson, 2005. Conceptualizing Sustainable Agriculture: Iran as an illustrative Case. Journal of Sustainable Agriculture,
27; 25-56.
Rezaie Moghaddam, K., 1997. Poverty and sustainable agriculture in Behbahan County. M.Sc. thesis, Agricultural extension and education, University of
Shiraz, Iran.
Roseland, M., 1998. Toward Sustainable Communities: Resources for Citizens and Their Governments. New Society Publishers, Gabriola Island, PP; 256.
Saltiel, J., J.W. Baunder, S. Palakovich, 1994. Adoption of sustainable agricultural practices: diffusion farm structure and profitability. Journal of Rural Sociology, 59; 333-347.
Shahvali, M., 2008. Investigation of sustainable patterns in Marvdasht. Iran Journal of Agricultural, 1; 39.
Veleva. V., M. Ellenbecker, 2000. A Proposal for Measuring Business Sustainability: Addressing Shortcomings in Existing Frameworks. Journal of Greener Management, 31; 101–120.
Wei, Y.P., R.E. White, D. Chen, B. Davidson, J.B. Zhang, 2007. Farmers’ perception of sustainability indicators
for crop production on the North China Plain. Journal of Sustainable Agriculture, 30; 129–147.