in the population sciences published by the Max Planck Institute for Demographic Research Konrad-Zuse Str. 1, D-18057 Rostock · GERMANY www.demographic-research.org
DEMOGRAPHIC RESEARCH
VOLUME 21, ARTICLE 30 PAGES 885-914
PUBLISHED 15 DECEMBER 2009
http://www.demographic-research.org/Volumes/Vol21/30/ DOI: 10.4054/DemRes.2009.21.30
Research Article
Diverging trends in female old-age mortality:
A reappraisal
L. Daniel Staetsky
© 2009 L. Daniel Staetsky.
This open-access work is published under the terms of the Creative Commons Attribution NonCommercial License 2.0 Germany, which permits use, reproduction & distribution in any medium for non-commercial purposes, provided the original author(s) and source are given credit.
1 Introduction 886
2 Data and method 889
3 Diverging trends in female life expectancy at age 65 891 4 The link between smoking and diverging trends in old-age
mortality among females: evidence examined
892 4.1 Survey based estimates of smoking prevalence 892
4.2 Mortality from lung cancer 895
4.3 Estimates of ‘smoking-free’ mortality 900
5 Re-thinking the stages of the health transition 905
References 909
Diverging trends in female old-age mortality:
A reappraisal
L. Daniel Staetsky1
Abstract
Over the second half of the 20th century, a number of divergences and convergences of mortality schedules were observed across the world. Some of these developments remain incompletely understood. In recent overviews of old-age mortality, Meslé and Vallin (2006) and Rau et al. (2008) describe two contrasting patterns of change in mortality of females between the mid-1980s and the end of the 20th century: a pattern of a large decrease in mortality exhibited by France and Japan and a pattern of a smaller decrease, stability or a certain increase in mortality shown by Denmark, the United States, and the Netherlands. No satisfactory explanation of this phenomenon has been proposed so far. This paper shows that the divergence is, to a very significant extent, due to the differential impact of smoking related mortality on female populations of France and Japan versus Denmark, the United States, and the Netherlands. The end to the diverging trends is demonstrated in this paper. Other lifestyle factors potentially implicated in the divergence are also briefly discussed.
1 RAND Europe, Cambridge, UK. E-mail: [email protected]. This paper was drafted while the author was
1. Introduction
This paper focuses on the determinants of divergence in trajectories of female mortality at ages 65 years and over between different Western countries.2 This is an attempt to bridge the gap between the literature on divergences and convergences in mortality across what is conventionally defined as a ‘developed world’, and the literature on the impact of smoking on population health. The core argument of this paper is that a significant part of the observed divergence could be attributed to differences in severity and timing of a smoking epidemic among females in different countries.
A number of studies of divergences and convergences in mortality across the world have been published over the past decade or so (Meslé, Vallin, and Andreev 2002, Meslé 2004, McMichael et al. 2004, Vallin and Meslé 2004, Moser, Shkolnikov, and Leon 2005, Meslé and Vallin 2006, Rau et al. 2008). Divergence of sub-Saharan Africa from the rest of the world during the 1990s and divergence of Eastern and Central Europe from Western countries approximately since the mid-1960s are examples of better understood types of divergence. In the first case, the epidemic of HIV/AIDS caused a drop in life expectancy (McMichael et al. 2004, Vallin and Meslé 2004, Moser, Shkolnikov, and Leon 2005). In the second case, a lack of ability to embrace innovation in medical science in relation to treatment and prevention of cardiovascular diseases resulted in stagnation or an increase in adult mortality (Meslé, Vallin, and Andreev 2002, Meslé 2004, Vallin and Meslé 2004). Over the 1990s following the opening of their political and economic systems to Western influences, certain Central European countries (e.g. Poland, Czech Republic) started convergence in mortality towards Western Europe while in others (Russian Federation, Ukraine) the divergence continued being also exacerbated by economic and social crisis (Meslé 2004, Vallin and Meslé 2004, Stuckler, King, and McKee 2009).
The divergences within the Western world are less well understood. In overviews of old-age mortality, Meslé and Vallin (2006) and Rau et al. (2008) demonstrated two contrasting patterns of mortality change among females between the 1980s and the end of the 20th century: a pattern of a large decrease in mortality exhibited by France and Japan and a pattern of a smaller decrease, stability or a certain increase in mortality shown by Denmark, the United States, and the Netherlands. Meslé and Vallin (2006) relate to ages 65 years and over while Rau et al. (2008) focus on ages 80 years and over. Although the main purpose of both studies was descriptive, some attempts were made
2 Throughout this paper the terms 'Western countries' or 'Western world' are used to denote countries of
to identify potential explanatory factors. Two explanatory hypotheses suggested by Meslé and Vallin (2006) are: (1) an improvement in the quality of mortality data and (2) differences in the functioning of health systems and perceptions of death. Neither hypothesis is satisfactory for the explanation of the observed phenomenon of divergence in routes of old-age mortality change in females, by the authors’ own admission. The authors identify the phenomenon of diverging trends in old-age female mortality as ‘a possible third stage in a historical series of divergence-convergence stages’ (Meslé and Vallin 2006: 125). Rau et al. (2008), relying on earlier research, mentioned the possible influence of early life factors as well as changes in medical services to elderly population within the context of the Netherlands and spread of smoking among females within the context of Denmark as potentially important for an explanation of increase or stagnation of old-age female mortality in these countries. Clearly, further work is needed to understand the reasons behind the divergence between mortality schedules of Western countries.
I propose that the divergence in female old-age mortality is, to a very significant extent, due to the differential impact of smoking related mortality on female populations of France and Japan versus Denmark, the United States and the Netherlands. I expand the comparisons to include other Western countries and demonstrate a broader picture of divergences in old-age female mortality. In all cases a very large part of divergence can be accounted for by diverging trends in smoking related mortality. I also demonstrate that the end to the diverging trends is on the horizon.
Three types of evidence can be brought in support of this case.
1) Survey based estimates of smoking prevalence. 2) Levels and trends of mortality from lung cancer.
3) Indirect estimates of ‘smoking free’ and smoking related mortality based on an approach developed by Peto et al. (1992, 1994).
the most direct accumulated expression of the habit, but they say nothing about the impact of smoking on other types of mortality. Indirect estimates of smoking related mortality across the entire mortality schedule have been developed by Peto et al. (1992, 1994) but they are based on an assumption of the universality of relative risks of smokers’ mortality-which introduces a degree of uncertainty into the results of estimation. Using more than one indicator is therefore essential for obtaining sound conclusions in relation to the phenomenon of smoking related mortality.
The argument linking diverging trends in old-age female mortality to smoking relies on an extensive body of work that has been generated in demographic science over approximately the last 30 years. Smoking was causally linked to lung cancer in the first half of the 20th century, with about 90% of deaths from this disease being attributed to smoking (Ravenholt 1990, National Cancer Institute 1997). However, the impact of smoking on individual and population health spreads beyond lung cancer. Smoking adversely affects health from a wide variety of conditions: cardiovascular diseases, respiratory diseases, and different types of cancer other than lung cancer (Peto et al. 1992, 1994, Thun et al.1995, Wen et al. 2004, Doll et al. 2004).
past trends of decline in mortality and the likely scenarios of future progress in extending longevity. Preston and Wang (2006) arrived at similar conclusions on the basis of the analysis of cohort patterns of smoking using a different method of quantification of smoking related mortality.
2. Data and method
I employ data on life expectancy, deaths and population counts from the Human Mortality database (2008) and the World Health Organization (2006) database. I employ smoking prevalence data from Forey et al. (2002). I do not make use of any unpublished material. I use ratios of death rates as a principal technique to illustrate differences in mortality between countries and points in time.
This paper compares trends and levels of smoking and old-age female mortality in France, Italy, Spain, Japan, the Netherlands, the United States of America, Denmark, and England and Wales. For each country, I present (1) survey based statistics on smoking prevalence (i.e. percent of persons defining themselves as smokers) and (2) trajectories of total, lung cancer and ‘smoking free’ mortality in 1951-1953, 1962-1964, 1973-1975, 1984-1986, and 1995-19973. Although the main focus of this paper is on the developments in old-age female mortality between the 1970s and the 1990s, presentation of a longer time span (1950s-1990s) allows proper examination of the course of the smoking epidemic.
Indirect estimation of smoking related mortality has been developed by Peto et al. (1992, 1994) and has been implemented a number of times in the literature. The core features of the procedure are (1) estimation of smoking prevalence on the basis of lung cancer rates4 and (2) computation of the number of excess (smoking related) deaths using the estimated smoking prevalence and relative risks of smoking derived from the second wave of the American Cancer Society Cancer Prevention Studies. Smoking related deaths can be subsequently removed from mortality schedules to render ‘smoking free’ mortality (Peto et al. 1992, 1994). Further details of the method can be
3 The exceptions are France where data for years 1952-1953 were used instead of 1951-1953, and Denmark,
the Netherlands and Japan where data for years 1992-1993, 1993-1995 and 1992-1994, respectively, were used instead of 1995-1997. For brevity I will refer to years 1951-1953 as ‘the 1950s’, years 1962-1964 as ‘the 1960s’ and so forth.
4 The estimated ‘smoking prevalence’ figures are, in fact, estimates of smoking prevalence and intensity
found in Appendix as well as in Peto et al. (1992, 1994), Valkonen and Van Poppel (1997), Brønnum-Hansen and Juel (2000), and Pampel (2005).
All countries participating in comparisons possess well developed systems of vital registration and population accounts. The use of mortality records of these countries is widely accepted, and in most cases there are no concerns about the quality of mortality data. One issue, however, stands out as somewhat problematic. Certain countries possess significant proportion of deaths attributed to ill-defined causes. This problem is especially severe at earlier points in time. During the 1950s the proportion of all deaths at ages 65 years and over attributed to ill-defined causes (codes A136 and A137 of the International Classification of Diseases 7, List A, condensed) is 22% in France and Japan, 14%-18% in Italy and Spain, 6% in the Netherlands and only 1.0%-2.5% in the United States, Denmark, England and Wales. During the 1990s, the proportion of deaths coded as ill-defined (code B46 of the International Classification of Diseases 9, Basic Tabulation List) is relatively low in all countries: in the 1990s it is 4.5%-6.0% in France and Japan and it is below 4% in nearly all other countries examined in this paper. Since the estimation of smoking related mortality relies on cause-specific information on deaths, differential scope of ill-defined mortality across countries may adversely affect comparability of estimates.
High proportion of ill-defined causes both in historical and contemporary mortality data has been noted in previous research (Preston 1976, United Nations 1988, Gage 1993, 1994, Meslé and Vallin 1996, Meslé 1999) and it has been maintained that ill-defined deaths are mainly deaths from the endogenous causes, mostly cardiovascular diseases and cancer (Preston 1976, United Nations 1988, Gage 1993, 1994). As a way to control for the differential scope of ill-defined deaths in different countries Meslé (1999) proposed to re-distribute ill-defined deaths proportionally between specific categories for the purpose of analysis of mortality trends. In this paper, I follow the method proposed by Meslé (1999)5. Specifically, first I calculate proportions of various causes of death participating in estimation of smoking related mortality of the total number of deaths with known causes. I then apply these proportions to ill-defined deaths to obtain the ‘extra’ deaths for each cause of death taking part in estimation. Finally, I add the ‘extra’ deaths to the ‘original’ deaths with known causes. I perform the estimation of smoking related mortality on the basis of the corrected counts of deaths by cause.
5 I relate to deaths under the codes A136, A137 (International Classification of Diseases 7 and 8, List A,
3. Diverging trends in female life expectancy at age 65
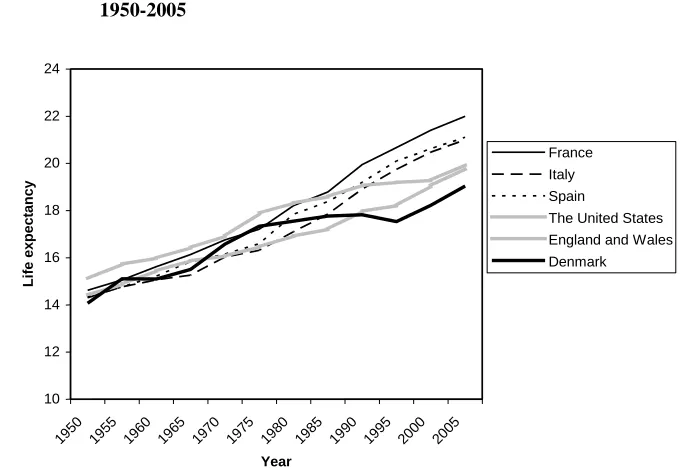
The developed world has experienced a divergence of mortality schedules of females aged 65 years and over. Figure 1 shows trends in female life expectancy at age 65 in France and the United States, which were earlier presented by Meslé and Vallin (2006) and Rau et al. (2008), but also in other countries: Denmark, England and Wales, Italy, and Spain. As trends in Japan and the Netherlands are rather similar to those in France and the United States, respectively, I do not present these trends to avoid ‘cluttering’ the diagram.
Figure 1: Female life expectancy at age 65 years in selected countries, 1950-2005
10 12 14 16 18 20 22 24
1950 1955 1960 1965 1970 1975 1980 1985 1990 1995 2000 2005
Year
Li
fe
e
x
pec
ta
ncy
France Italy Spain
The United States England and Wales Denmark
Note: For Italy an average of 2003-2004 is presented instead of the figure for 2005. Source: Human Mortality Database (2008)
England and Wales, and the United States show a remarkable divergence from France, Italy, and Spain. Denmark and the United States diverge from this group starting somewhere in the 1980s. In the case of England and Wales the divergence is observed from the early 1970s. Interestingly, in Denmark, England and Wales, and in the United States more recently (1995-2005) the slope of change in life expectancy became similar to France, Spain, and Italy. Uniquely within this comparison, Denmark displays a prolonged stagnation in female life expectancy until the mid-1990s.
The outcome of the diverging trends is a much greater variation in female life expectancy at age 65 in 2005 than in 1950. The ‘French’ pattern of a more or less continuous rise in life expectancy has been also seen, apart from Japan and other Mediterranean countries of Europe, in Austria, Australia, Belgium, Finland, and Switzerland. On the other hand, the ‘American’ pattern of a slower rise or certain stagnation has been followed, apart from Denmark, the Netherlands, England and Wales, also by Canada, New Zealand, Norway, and Sweden. The exact timing and the nature of divergence from the ‘French’ pattern varied significantly within this second group.
4. The link between smoking and diverging trends in old-age
mortality among females: evidence examined
4.1 Survey based estimates of smoking prevalence
The effects of smoking in teenage years and young adulthood are felt chiefly after the age of 45 years. It is known that the effects of smoking on health and mortality are lagged by about 20-30 years, both on an individual and population level (Lopez, Collishaw, and Piha 1994). Therefore, the impact of smoking related mortality on old-age mortality in the end the 20th century is a function of the exposure of middle-aged adults to smoking approximately during the 1970s. Figure 2 sets out the comparisons of trends in prevalence of smoking among middle-aged females in a few countries where data on smoking prevalence could be obtained for three points in time in a comparable format.
United States. The gap between France and Italy on one hand and the United States on the other hand narrows during the 1990s. However, it is important to remember that the figures that are relevant for understanding mortality at ages 65 years and over during the last quarter of the 20th century are those relating to prevalence of smoking among females aged 45-64 years specifically in the mid-1970s. The results of the narrowing observed in the 1990s will not have a perceptible impact on trends in old-age mortality until 20-30 years later.
Figure 2: Trends in smoking prevalence among middle-aged females in selected countries, 1950s-1990s
0 10 20 30 40 50 60
France Italy The United States
England and Wales
Denmark
Country
P
e
rc
e
nt
of
s
m
oke
rs
1950s 1970s 1990s
Note: (1) The data relate to ages 45-64 years except the following cases: the United States and England and Wales in the 1950s- ages 59 years; France in the 1950s and 1970s-ages 64 years; France in the 1990s-ages 45-59 years; Denmark-ages 50-64 years; Italy in the 1970s -ages 50-59 years.
(2) A certain degree of cross national variation in definition of a smoker exists. Forey et al. (2002) should be consulted for greater details.
More detailed comparisons of smoking prevalence figures for the mid-1970s are set out in Table 1. Age groups to which particular attention should be paid are shaded.
Table 1: Smoking prevalence (%) among females of selected countries in the mid-1970s, by age: survey based estimates
The Netherlands 1975 The United States 1974 England and Wales 1974
20-34 58 25-44 39 25-34 46
35-49 47 45-64 34 35-49 49
50-64 29 65+ 12 50-59 48
65+ 12 60+ 26
Denmark 1975 France 1976 Italy 1976
20-24 56 25-34 39 20-29 42
25-29 49 35-49 26 30-39 29
30-39 46 50-64 17 40-49 16
40-49 49 65+ 7 50-59 14
50-64 33
65+ 12
Spain 1978 Japan 1975
25-49 16 20-29 13
50-64 5 30-39 14
65+ 3 40-49 16
50-59 18
60+ 17
Note: Age groups are presented as they appear in the source publication. Source: Forey et al. (2002)
Examination of the data presented in Table 1 provides the following insights. First, during the 1970s the prevalence of smoking among middle-aged females in Japan is approximately at the same level as in France and Italy (about 17%) while in Spain it is at a lower level (5%). In the Netherlands the prevalence of smoking among the middle-aged females is roughly at a level observed in the United States, England and Wales, and Denmark. Second, in younger age groups (ages 25-40 years) the prevalence of smoking among females in France and Italy is more similar to the United States, England and Wales, Denmark, and the Netherlands (being in the range of range of 30%-50%) while in Japan and Spain it is still considerably lower (around 15%).
hand and France, Italy, Spain, and Japan on the other hand. In the first ‘cluster’ the scope of smoking among females is more significant; specifically, already during the 1970s around one third of middle-aged females in these countries smoked. In the second ‘cluster’ the scope of smoking among middle-aged females remained much lower (in the range of 5%-17% in the 1970s). We can therefore anticipate that the subsequent impact of smoking related mortality would be higher in Northern Europe and the United States than in Southern Europe and Japan6. Importantly, two ‘clusters’ correspond well to the ‘American’ and ‘French’ patterns of trends in female life expectancy at age 65, identified in Figure 1.
4.2 Mortality from lung cancer
Death rates from lung cancer rates at a given point in time reflect the smoking history of 20-30 years before. About 90% of deaths from lung cancer are related to smoking. Trends in mortality from lung cancer were used in the past as a proxy for description of all-cause smoking related mortality by Lopez, Collishaw, and Piha (1994). There are indications that trends in lung cancer are a more appropriate measure for the assessment of the impact of smoking than the survey based smoking prevalence figures.
In Figure 3, I show the trends and levels of old-age female mortality from lung cancer in different countries between the 1950s and the 1990s7.
As Figure 3 demonstrates, the differences between countries in levels of mortality from lung cancer are noticeable already in the 1950s with England and Wales, the United States, and Denmark presenting higher levels than Southern Europe, Japan, and the Netherlands. However, the general level of lung cancer mortality is still quite low during the 1950s. The rise in old-age female mortality from lung cancer starts in the 1950s and occurs in all countries under examination. The divergence in routes of mortality from lung cancer is especially pronounced since the 1970s: the rise is much steeper in the United States, England and Wales, and Denmark (countries that by the 1980s form a clear visual ‘cluster’ of high mortality from lung cancer) than in Southern Europe and Japan (countries forming a ‘cluster’ of low mortality from lung cancer). The Netherlands appears to occupy an intermediate position between the two ‘clusters’.
6For brevity I will use a term ‘Northern Europe’ while referring to Denmark, England and Wales, and the
Netherlands and a term ‘Southern Europe’ in relation to France, Italy and Spain.
7 Standardization of the death rates throughout this paper is performed using the weights obtained from the
Figure 3: Age-standardized female death rates from lung cancer in selected countries, ages 65 years and over, 1950s-1990s
0 50 100 150 200 250
1950s 1960s 1970s 1980s 1990s
Period
D
e
a
th
ra
te
per
1
0
0
,0
0
0
France Italy Spain Japan The Netherlands The United States England and Wales Denmark
Source: World Health Organization (2006)
Remarkably, approximately since the 1970s the behaviour of old-age female lung cancer mortality shown in Figure 3, and in particular the appearance of the clearly differential trends resulting in ‘clusters’, resembles the behaviour of female life expectancy at age 65 shown in Figure 1, where similar differentiation in trends and clustering (i.e. ‘French’ and ‘American’ patterns) were identified. The Netherlands constitutes a single exception: this country is identified as a part of the ‘American’ pattern in relation to the route of female life expectancy at age 65 but it is clearly not part of a ‘cluster’ containing the United States, England and Wales, and Denmark in relation to the trend in female old-age mortality from lung cancer.
Figure 4: Ratios of female death rates from lung cancer in selected countries to those observed in France, ages 65-84, 1995-1997
0 1 2 3 4 5 6
65-69 70-74 75-79 80-84
Age group
R
a
ti
o
France Italy Spain Japan The Netherlands The United States England and Wales Denmark
Source: World Health Organization (2006)
ages 64-74 years in the Netherlands have higher mortality from lung cancer than Southern Europe (but not as high as in the United States, England and Wales, and Denmark) while at ages 75-84 years mortality from lung cancer is approximately at the same level as in Southern Europe. This is an illustration of a relatively late timing of smoking epidemic in the Netherlands in comparison to the rest of Northern Europe and the United States. As a result, only the younger ages in the age span of 65-84 years in the Netherlands exhibit elevated lung cancer mortality while there are no signs of the epidemic at the older ages. This interpretation is compatible with the conclusions regarding national differences in the timing of smoking epidemic presented by Pampel (2003: 57-58).
Figure 5 presents the ratios of female lung cancer death rates in the same set of countries to French female lung cancer death rates in the mid-1970s. At this point in time, variation in lung cancer mortality is much smaller than in the 1990s: nearly all ratios are below 3. Still, countries of Southern Europe and Japan form a group of low mortality from lung cancer among females (Spain is almost indistinguishable from France) while England and Wales, Denmark, and the United States constitute a group of high mortality from lung cancer. Curiously, Dutch mortality from lung cancer is very similar to French in the 1970s and it is quite different in the 1990s, i.e. the Netherlands moves from the ‘pole’ of low lung cancer mortality towards the ‘pole’ of high lung cancer mortality among females aged 65 years and over.
Figure 5: Ratios of female death rates from lung cancer in selected countries to those observed in France, ages 65-84, 1973-1975
0 1 2 3 4 5 6
65-69 70-74 75-79 80-84
Age group
R
at
io
Source: World Health Organization (2006)
The increase in ratios of death rates from lung cancer between the 1970s and the 1990s in different countries relative to French mortality provides an illustration of diverging schedules of the type of mortality with the strongest link to smoking.
To be sure, no country remained static in relation to mortality from lung cancer. To further highlight this point Figure 6 presents ratios of female death rates from lung cancer in the 1990s to those observed in the 1970s for each country.
In Southern Europe and Japan, countries with initially low smoking related mortality, the increase in most age groups was 2 fold or below this figure. It still remained less significant than in Northern Europe, and, especially, in the United States where a 2-4 fold increase was observed.
Figure 6: Ratios of female death rates from lung cancer in the 1990s to those observed in the 1970s, ages 65-84
0 1 2 3 4 5 6
65-69 70-74 75-79 80-84
Age group
R
a
ti
o
France Italy Spain Japan The Netherlands The United States England and Wales Denmark
4.3 Estimates of ‘smoking-free’ mortality
This section presents the final and most convincing type of evidence linking the observed divergence in female old-age mortality to the impact of smoking related mortality.
An indirect estimation of smoking related mortality using a method developed by Peto et al. (1992, 1994) showed that in the 1990s the volume of smoking related mortality among females aged 65 years and over in France, Italy, Spain and Japan was modest relative to Denmark, the Netherlands and the United States. Only 2% of female deaths at ages 65 years and over in France, 5% in Italy and 6% in Japan were related to smoking. In Spain almost no deaths among females in these age groups were smoking related. In Denmark, England and Wales, the Netherlands, and the United States the proportions of smoking related deaths were 15%, 16%, 8% and 20%, respectively.
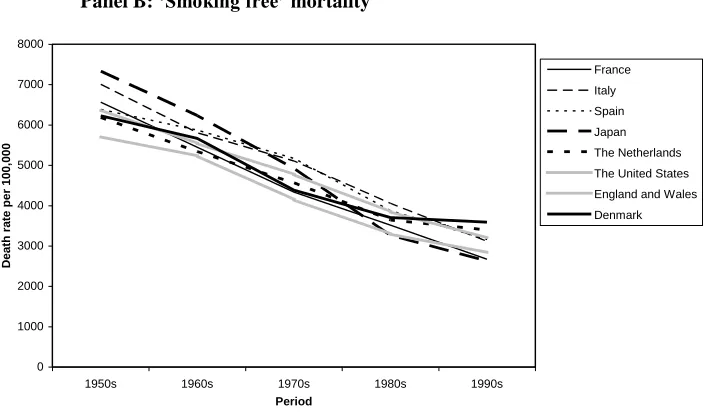
Figure 7 shows trends in old-age mortality for females in different countries (Panel A) and also trends in old-age female mortality after reduction of smoking related deaths (Panel B) using a method developed by Peto et al. (1992,1994).
Figure 7: Age-standardized female death rates in selected countries, ages 65 years and over, 1950s-1990s
Panel A: Total mortality
0 1000 2000 3000 4000 5000 6000 7000 8000
1950s 1960s 1970s 1980s 1990s
Period
D
e
a
th
ra
te
per
1
0
0
,0
0
0
Figure 7: (Continued)
Panel B: ‘Smoking free’ mortality
0 1000 2000 3000 4000 5000 6000 7000 8000
1950s 1960s 1970s 1980s 1990s
Period
D
e
a
th
ra
te
per
1
0
0
,0
0
0
France Italy Spain Japan The Netherlands The United States England and Wales Denmark
Source: World Health Organization (2006)
Reduction of smoking related deaths makes little impact on old-age female mortality before the 1980s. Since the 1980s, however, and especially during the 1990s, divergence in female old-age mortality seen in Panel A is significantly reduced as a result of reduction of smoking related deaths (Panel B). In fact, variation in ‘smoking free’ mortality is smaller in the 1990s than it is in the 1950s (Panel B).
second estimate does not implement halving of the excess risks. These estimates represent the minimal and the maximal estimates of smoking related mortality, respectively. Consequently, I obtain two estimates of ‘smoking free’ mortality: the first is almost certainly an overestimate and the second is an underestimate. The ‘true’ figure is most likely to be found somewhere in between these two estimates.
Figure 8 shows ratios of death rates among females at ages 65 years and over in selected countries to those observed among French females during the 1990s, before and after smoking related mortality is removed.
Figure 8: Ratios of standardized female death rates at ages 65 years and over in selected countries to those observed among females in France, total and 'smoking free' mortality, 1995-1997
0 0.2 0.4 0.6 0.8 1 1.2 1.4 1.6 1.8 2 France
Italy Spain Japan The Netherlands The United States England and Wales Denmark
C
ountry
Ratio
Smoking free mortality-Original method
Smoking free mortality-Modified method Total mortality
Source: World Health Organization (2006)
figures for England and Wales are 1.42 and 1.10-1.20 and for Denmark they are 1.73 and 1.25-1.34. In the Netherlands a reduction in ratios is also observed following the removal of smoking related mortality; however, it is less significant than in other countries. The ratios of Dutch to French death rate are 1.33 and 1.24-1.27 before and after the removal of smoking related mortality, respectively.
Figure 9 (Panels A, B and C) presents ratios of death rates observed in the 1990s to those in the 1970s, for total and ‘smoking free’ mortality. When the change in total mortality is considered (Panel A), Southern European countries and Japan again form a ‘cluster’ of countries exhibiting a large change: ratios of death rates in the 1990s to those observed in the 1970s in these countries are around or below 0.6 (age groups 65-84 years). Northern European countries and the United States stand out as a ‘cluster’ with relatively small improvement: as a rule their ratios are above 0.7 and in many age groups they are in a range of 0.8-0.9. In Denmark, an increase in mortality in age group 65-69 years is observed between the two periods.
Figure 9: Ratios of death rates in 1995-1997 to death rates in 1973-1975 among females in selected countries
Panel A: Total mortality
0 0.2 0.4 0.6 0.8 1 1.2
65-69 70-74 75-79 80-84 85+
Age
R
a
ti
o
Figure 9: (Continued)
Panel B: ‘Smoking free’ mortality – Original method
0 0.2 0.4 0.6 0.8 1 1.2
65-69 70-74 75-79 80-84 85+
Age
R
a
ti
o
France Italy Spain Japan The Netherlands The United States England and Wales Denmark
Panel C: ‘Smoking free’ mortality – Modified method
0 0.2 0.4 0.6 0.8 1 1.2
65-69 70-74 75-79 80-84 85+
Age
R
a
ti
o
France Italy Spain Japan The Netherlands The United States England and Wales Denmark
The removal of smoking related mortality makes the pace of improvement in old-age female mortality considerably more similar across countries participating in a comparison (Panels B and C). The change in mutual positioning of different countries is noticeable when the original method developed by Peto et al. (1992, 1994) is implemented and it is especially significant when the modified version of it is applied. After smoking related mortality is removed the ratios of death rates in the 1990s to those observed in the 1970s are all in a range of 0.6-0.7 in England and Wales and the United States (Panels B and C). In Southern European countries and Japan the ratios remain within the range of 0.5-0.6. The picture of ‘clustering’ clearly visible in Panel A disappears in Panels B and C. A large gap in the pace of improvement still remains between Denmark and the Netherlands, on one hand, and all other countries (but especially Southern European countries and Japan), on the other hand.
5. Re-thinking the stages of the health transition
This paper has shown that old-age female life expectancy continued to rise in a more or less undisturbed manner through the second half of the 20th century in countries mildly affected by smoking epidemic among females (France, Italy, Spain, and Japan). Old-age female mortality stagnated (Denmark) or a slowdown in pace of improvement has been observed (the United States, the Netherlands, England and Wales) in countries significantly affected by smoking epidemic. This resulted in divergence of their mortality schedules from those of France, Italy, Spain, and Japan.
Waldron (1985) identified smoking as the most important single factor behind sex differentials in mortality. This analysis suggests that smoking might also qualify for the most important single factor in the diverging trends in (and growing variation of) female old-age mortality during the last quarter of the 20th century. This argument rests on a simple inspection of appropriately lagged smoking prevalence figures, comparisons of trends and levels of mortality from lung cancer and results of quantification of smoking related and ‘smoking-free’ mortality using the method developed by Peto et al. (1992, 1994).
less than in Northern Europe countries and the United States. Finally, the removal of smoking using the method developed by Peto et al. (1992, 1994) revealed that ‘smoking free’ death rates in Southern Europe and Japan, on one hand, and Northern Europe and the United States, on the other hand, were much more similar than those observed before smoking related mortality was removed. The Netherlands constitutes an exception: the phenomenon of relatively high and stagnating old-age female mortality in the Netherlands in the 1980s and 1990s deserves special attention: in contrast to the United States, England and Wales, and Denmark it does not appear to be largely due to smoking related mortality.
Since the 1960s, mortality schedules of Western countries reflected what Vallin and Meslé (2004) labelled as ‘cardiovascular revolution’: a dramatic reduction in cardiovascular and total mortality following the introduction of innovative medical technologies and advances in preventive medicine in relation to cardiovascular diseases. Does the divergence in old-age female mortality since the 1980s mark the beginning of a new stage of health transition, as suggested by Meslé and Vallin (2006)? There is no straightforward answer to this question. The stage of cardiovascular revolution is not over: technologies of the treatment of cardiovascular diseases are constantly developing in Western countries and they are being disseminated in Eastern European countries. Mass adoption of smoking by females in countries such as England and Wales and the United States occurred before the beginning of the cardiovascular revolution but its effects on health and survival remained hidden until the 1980s, when the first female cohorts significantly affected by smoking entered old age. Therefore, smoking can be seen as a force operating in parallel to the cardiovascular revolution and offsetting its gains. Future work should further address the issue of interplay of smoking and the cardiovascular revolution in determining the survival outcomes across countries.
There is one more point of significance in relation to the impact of smoking on female old-age mortality. Although with delay, smoking became widespread among young French and Italian females during the 1970s, as Table 1 testifies: in age group 25-35 years, prevalence of smoking among French females was no different from American females. Smoking also affected young females in Spain and Japan but to a lesser extent. These cohorts have been reaching old age during the first decade of the 21st century and will dominate the second and the third decades. One can reasonably expect a slowdown in survival gains of females aged 65 years and over in these countries in the first quarter of the 21st century. This, in turn, should cause a slowdown or a complete stop in the process of divergence in old-age female mortality seen up until 2000.
time, in the United States, Denmark, and England and Wales improvement in life expectancy at old ages has been accelerating. Table 2 gives a better view of these processes presenting ratios of life expectancy at age 65 in 1995 to those observed in 1985 and in 2005 to those in 1995.
Table 2: Ratios of life expectancy at age 65 years among females in selected countries
Ratios of life expectancy at age 65 years
Country 1995/1985 2005/1995
France 1.10 1.06
Italy 1.11 1.06
Spain 1.09 1.05
Japan 1.10 1.11
The Netherlands 1.02 1.05
The United States 1.03 1.04
England and Wales 1.06 1.09
Denmark 0.99 1.09
Source: Human Mortality Database (2008)
As is shown in Table 2, the greatest improvement between the 1980s and mid-1990s occurred in France, Italy, Spain, and Japan while between the mid-mid-1990s and 2005 the greatest improvement was registered in Denmark, England, Wales, and Japan. Also, the pace of improvement slowed down for France, Italy, and Spain while it increased in Denmark, England and Wales, and the United States. The acceleration in improvement in female life expectancy at age 65 in selected countries of Northern Europe and the United States could have something to do with reductions in prevalence and intensity of smoking in the later cohorts. Both types of reductions are possibly related to anti-smoking public health campaigns that took place since the 1970s in countries that were forerunners of smoking epidemic (Doll et al. 2004, Preston and Wang 2006). In the United Kingdom and the United States, the decline in the proportion of smokers and in number of cigarettes smoked per person per day for females aged 65 years and over was registered in the first decade of the 21st century (PN Lee Statistics & Computing Ltd 2007, Preston and Wang 2006).
hand, and France and Japan, where ‘smoking free’ mortality was low and the pace of reduction was faster (Figures 8 and 9). Meslé and Vallin (2006) suggested that attitudes to death and health at old-age and the functioning of health care systems might explain those differences. However, there are other factors, similar to smoking in magnitude of their impact on population health, that might be relevant for explanation. McGinnis and Foege (1993) and Mokdad et al. (2004) quantified mortality related to poor diet and physical inactivity in the United States to show that these represented the second largest health hazard in the last decade of the 20th century (after smoking), causing 14%-17% of all avoidable deaths. Nutritional habits and exercise is therefore another important factor that interferes with and slows down the progress made as a result of innovation in medical sphere. Simple inspection of health indicators relating to diet and body mass reveals significant differences between the countries in this comparison. The proportion of females overweight and obese (i.e. those with body mass index above 25kg/m2) in 2000 is in the range of 21%-33% in France, Italy, and Japan, and 34%-62% in Denmark, the Netherlands, the United Kingdom, and the United States (Organization for Economic Co-operation and Development 2008). Diet in Italy and Spain is richer in fruit, vegetables, and vegetable oil and lower in animal fat than it is in Northern Europe and Anglophone countries. The Japanese diet is especially low in animal fat and also in meat products in general (Food and Agriculture Organization of the United Nations 2006). France is more similar to Northern Europe and Anglophone countries in relation to dietetic components-the phenomenon has been commented on previously within the context of the so-called ‘French mortality paradox’. Low mortality in France is not well understood and relatively high consumption of red wine as well as a time lag explanation (i.e. lower consumption of animal fat in France in comparison to Northern European countries in the past rather than at present) have been advanced to explain it (Law and Wald 1999).
It is beyond the scope of this paper to quantify the impact of all lifestyle related factors, apart from smoking, on mortality schedules of females in countries under examination. However, it is important to point out their existence and the need to consider these factors in their interaction with smoking and the advancement in medical science in influencing old-age female mortality across the developed world.
Corrections:
References
Bongaarts, J. (2006). How long will we live? Population and Development Review 32(4): 605-628. doi:10.1111/j.1728-4457.2006.00144.x.
Brønnum-Hansen, H., and Juel, K. (2000). Estimating mortality due to cigarette smoking: Two methods, same result. Epidemiology 11(4): 422-426. doi:10.1097/00001648-200007000-00010.
Doll, R., Peto, R., Boreham, J., and Sutherland, I. (2004). Mortality in relation to smoking: 50 years’ observation on male British doctors. British Medical Journal 328(7455): 1519-1528. doi:10.1136/bmj.38142.554479.AE.
Food and Agriculture Organization of the United Nations (2006). FAO Statistical yearbook 2005-2006, Vol. 2-1. Rome: FAO. http://www.fao.org/ docrep/009/a0490m/a0490m00.htm.
Forey, B., Hamling, J., Lee, P., and Wald, N. (2002). International smoking statistics: A collection of historical data from 30 economically developed countries (2nd edition). Oxford: Oxford University Press.
Gage, T.B. (1993). The decline of mortality in England and Wales 1861 to 1964: Decomposition by cause of death and component of mortality. Population Studies 47(1): 47-66. doi:10.1080/0032472031000146726.
Gage, T.B. (1994). Population variation in causes of death: Level, gender, and period effects. Demography 31(2): 271-296. doi:10.2307/2061886.
Human Mortality Database (2008). The Human Mortality Database [electronic resource]. Berkley: University of California and Rostock: Max Planck Institute for Demographic Research. http://www.mortality.org/.
Janssen, F. and Kunst, A.E. (2004). ICD coding changes and discontinuities in trends in cause-specific mortality in six European countries, 1950–99. Bulletin of the World Health Organization 82(12): 904-913. http://www.scielosp.org/ scielo.php?script=sci_arttext&pid=S0042-96862004001200006&nrm=iso. Janssen, F., Kunst, A.E., and Mackenbach, J. (2007). Variations in the pace of old-age
Law, M. and Wald, N. (1999). Why heart disease mortality is low in France: The time lag explanation. British Medical Journal 318(7196): 1471-1480. http://www.ncbi.nlm.nih.gov/pmc/articles/PMC1115846/.
Lopez, A.D., Collishaw, N.E., and Piha, T. (1994). A descriptive model of the cigarette epidemic in developed countries. Tobacco Control 3(3): 242-247. doi:10.1136/tc.3.3.242.
McGinnis, J.M. and Foege, W.H. (1993). Actual causes of death in the United States. Journal of the American Medical Association 270(18): 2207-2212. http://jama.ama-assn.org/cgi/reprint/270/18/2207.
McMichael, A.J., McKee, M., Shkolnikov, V., and Valkonen, T. (2004). Mortality trends and setbacks: Global convergence of divergence? The Lancet 363(9415): 1155-1159. doi:10.1016/S0140-6736(04)15902-3.
Meslé, F. (1999)
.
Classifying causes of death according to an aetiological axis.
Population Studies 53(1): 97-105. doi:10.1080/00324720308071.Meslé, F. (2004). Mortality in Central and Eastern Europe: Long-term trends and recent upturns. Demographic Research SC2(3): 45-70. doi:10.4054/DemRes.2004. S2.3.
Meslé, F. and Vallin, J. (1996). Reconstructing long-term series of causes of death: The case of France. Historical Methods 29(2): 72-87.
Meslé, F. and Vallin, J. (2006). Diverging trends in female old-age mortality: The United States and the Netherlands versus France and Japan. Population and Development Review 32(1): 123-145. doi:10.1111/j.1728-4457.2006.00108.x. Meslé, F., Vallin, J., and Andreyev, Z. (2002). Mortality in Europe: The divergence
between East and West. Population-E 57(1): 157-197. doi:10.2307/3246630. Mokdad, A.H., Marks, J.S., Stroup, D.F., and Gerberding, J.L. (2004). Actual causes of
death in the United States, 2000. Journal of the American Medical Association 291(10): 1238-1245. doi:10.1001/jama.291.10.1238.
Moser, K., Shkolnikov, V., and Leon, D.A. (2005). World mortality 1950-2000: Divergence replaces convergence from the late 1980s. Bulletin of the World Health Organization 83(3): 202-209. http://www.scielosp.org/scielo.php?script= sci_arttext&pid=S0042-96862005000300013&nrm=iso.
Bethesda, MD: U.S. Department of Health and Human Services, National Institutes of Health, National Cancer Institute.
Organization for Economic Co-operation and Development (2008). OECD health data 2008: Statistics and indicators for 30 countries [electronic resource]. Paris: OECD Publishing. http://www.oecd.org/document/30/0,3343,en_2649_34631_ 12968734_1_1_1_37407,00.html.
Pampel, F.C. (2002). Cigarette use and the narrowing sex differentials in mortality. Population and Development Review 28(1): 77-104. doi:10.1111/j.1728-4457.2002.00077.x.
Pampel, F.C. (2003). Declining sex differences in mortality from lung cancer in high-income nations. Demography 40(1): 45-65. doi:10.1353/dem.2003.0007.
Pampel, F.C. (2005). Forecasting sex difference in mortality in high income nations: The contribution of smoking. Demographic Research 13(18): 455-484. doi:10.4054/DemRes.2005.13.18.
Peto, R., Lopez, A.D., Boreham, J., and Thun, M.J. (2006). Mortality from smoking in developed countries 1950-2000 (2nd edition) [electronic resource]. http://www.ctsu.ox.ac.uk/~tobacco/.
Peto, R., Boreham, J., Lopez, A.D., Thun, M.J., and Heath, C.W. (1992). Mortality from tobacco in developed countries: Indirect estimation from national statistics. The Lancet 339(8804): 1268-1278. doi:10.1016/0140-6736(92)91600-D.
Peto, R., Lopez, A.D., Boreham, J., Thun, M.J., and Heath, C.W. (1994). Mortality from smoking in developed countries 1950-2000: Indirect estimates from national vital statistics. Oxford: Oxford University Press.
PN Lee Statistics & Computing Ltd (2007). International Mortality and Smoking Statistics Database [electronic resource]. http://www.pnlee.co.uk/IMASS.htm. Preston, S.H. (1976). Mortality patterns in national populations: With special reference
to recorded causes of death. New York: Academic Press.
Preston, S.H. and Wang, H. (2006). Sex mortality differences in the United States: The role of cohort smoking patterns. Demography 43(4): 631-646. doi:10.1353/dem.2006.0037.
Ravenholt, R.T. (1990). Tobacco’s global death march. Population and Development Review 16(2): 213-240. doi:10.2307/1971589.
Retherford, R.D. (1975). The changing sex differential in mortality. Studies in population and urban demography, no. 1. Westport, CT and London, England: Greenwood Press.
Stuckler, D., King, L., and McKee, M. (2009). Mass privatisation and the post-communist mortality crisis: A cross-national analysis. The Lancet 373(9661): 399-407. doi:10.1016/S0140-6736(09)60005-2.
Thun, M.J., Day-Lally, C.A., Calle, E.E., Flanders, W.D., and Heath, C.W. (1995). Excess mortality among cigarette smokers: Changes in a 20-year interval.
American Journal of Public Health 85(9): 1223-1230.
doi:10.2105/AJPH.85.9.1223.
United Nations (1988). Sex differentials in life expectancy and mortality in developed countries: An analysis by age groups and causes of death from recent and historical data. Population Bulletin of United Nations 25: 65-107.
United Nations (2007). World Population Prospects Population Database: 2006 Revision [electronic resource]. http://esa.un.org/unpp/.
Valkonen, T. and Van Poppel, F. (1997). The contribution of smoking to sex differences in life expectancy: Four Nordic countries and The Netherlands 1970-1989. European Journal of Public Health 7(3): 302-310. doi:10.1093/eurpub/7.3.302.
Vallin, J. and Meslé, F. (2004). Convergences and divergences in mortality. A new approach to health transition. Demographic Research SC2(2): 11-44. doi:10.4054/DemRes.2004.S2.2.
Waldron, I. (1985). What do we know about causes of sex differences in mortality? A review of the literature. Population Bulletin of the United Nations 18: 59-76. Waldron, I. (1986). The contribution of smoking to sex differences in mortality. Public
Health Reports 101(2): 163-173.
Wen, C.-P., Tsai, S.P., Chen, C.-J., and Cheng, T.-Y. (2004). The mortality risks of smokers in Taiwan. Part I: Cause-specific mortality. Preventive Medicine 39(3): 528-535. doi:10.1016/j.ypmed.2004.02.010.
Appendix
The method of quantification of smoking related mortality
All calculations and elements of notation detailed in this Appendix are age- and sex-specific, unless otherwise stated.
Calculations proceed through the following four stages.
1) Computation of the excess deaths from lung cancer for each country (country X) through the application of the American non-smokers’ age and sex-specific lung cancer death rates (from the second wave of the American Cancer Society Cancer Prevention Study, ACS CPS-II) to population figures of country X. The difference between the actual number of deaths from lung cancer in country X and the ‘would be’ number (if country X experienced lung cancer death rates of non-smokers) represents the excess mortality from lung cancer in this country.
2) Computation of the proportions of smokers and non-smokers in country X, assuming that the observed death rates from lung cancer in country X are a weighted sum of rates of smokers and non-smokers. This procedure relies on an assumption that American non-smokers’ lung cancer rates and relative risks in relation to lung cancer (from ACS CPS-II) are universal.
3) Computation of the proportion of smoking related deaths in country X (called also an etiologic fraction) for causes other than lung cancer. Etiologic fraction (EF) is a function of the proportion of smokers (P), calculated at a previous step, and of the cause-specific relative risks (RR) of smokers to non-smokers obtained from ACS CPS-II:
*( 1)
1 *( 1)
P RR
EF
P RR
(1)
However, Peto et al. (1992, 1994) suggest halving of the relative risks to generate conservative estimates.
*( 1)
2 *( 1)
P RR
EF
P RR
Halving is essentially an arbitrary practice (Peto et al. 1992), but it helps to avoid overestimation of the smoking related deaths. In the paper, I produce and present two types of estimates based on equations (1) and (2).
4) Computation of smoking related deaths in country X from causes other than lung cancer. Multiplication of etiologic fraction by total number of deaths from a given cause in country X gives the number of excess, i.e. smoking related deaths, from this cause in this country.
Relative risks observed in the ACS CPS-II that are used by Peto et al. (1992, 1994) and in this study are set out in a table below, together with the International Classification of Diseases (ICD) codes:
Appendix Table 1: ICD codes and relative risks of smokers versus non-smokers in ACS-CPS II
Relative Risks
Cause of death ICD-9 code ICD-8 code ICD-7 code Male Female
Lung cancer 162 162 162-163 24.22 12.5
Upper aerodigestive
cancer 140-150,161 140-150,161 140-148,150,161 7.87 6.95 Other cancers rest of 140-209 rest of 140-209 rest of 140-209 1.69 1.2 Chronic obstructive
pulmonary disease (COPD)
490-496 490-493 501-502 13.82 14.21
Other causes (1)
age 45-59 3.05 2.69
60-64 2.31 2.68
65-69 2.09 2.52
70-74 2.00 2.00
75+ 1.54 1.44
Note: (1) Excluding cirrhosis and external causes of death.