Volume 1 | Issue 2 Article 9
2014
Childhood Health and Household Income
Patrick MaloneUniversity of Minnesota, Morris
Follow this and additional works at:http://digitalcommons.morris.umn.edu/horizons
Part of theHealth Economics Commons
This Article is brought to you for free and open access by University of Minnesota Morris Digital Well. It has been accepted for inclusion in Scholarly Horizons: University of Minnesota, Morris Undergraduate Journal by an authorized administrator of University of Minnesota Morris Digital Well. For more information, please contactskulann@morris.umn.edu.
Recommended Citation
Malone, Patrick (2014) "Childhood Health and Household Income,"Scholarly Horizons: University of Minnesota, Morris Undergraduate Journal: Vol. 1: Iss. 2, Article 9.
Childhood Health and Household Income Patrick Malone
Abstract
Health Economics literature is rich with studies that find a positive association between childhood health and family income. This relationship is also known as
childhood health and income gradient. Several other studies also find that this gradient becomes steeper as children age. This research paper empirically reexamines this phenomenon using 2009-2012 data from the National Health Interview Survey. While the study finds the existence the gradient effects, it finds the gradient to be flatter than those found earlier studies.
Introduction & Background
Childhood health is important for children’s human capital development and in
turn, has serious implications for their future success. Health economics literature is rich
with studies that find a strong positive effect of family income on childhood health. This
relationship between childhood health and family income is known as the child health–
income gradient and is used to explain the disparity between the health statuses of
wealthier and poorer children.
One of the pioneering papers in this area is by Case et al. (2002). The authors
not only find a strong effect of family income on childhood health status, but also find
this relationship to be even stronger as children age. In other words, they find the
income-health gradient to be steeper as children age. The intuition behind a positive
association between household income and childhood health is fairly straightforward
where wealthier parents manage to afford better medical care and nutritional food items,
resulting in better health outcomes. The study attributes the emergence of chronic
conditions in early childhood and the accumulation of those effects as the children
with better health care facilities manage to tackle the chronic conditions, the adverse
health effects of chronic conditions accumulates over time for poorer children in
absence of proper health care due to low income. The study by Case et al. (2002) has
been very influential in the health economics literature and has been a guiding paper for
many other studies. Currie et al. 2007 uses an English data set to recreate the Case et
al. (2002) study. The recreated study finds that England also has a child health-income
gradient similar to the one in the US. The English gradient while present, is considerably
smaller and less steep compared to the one found in the US. The authors attribute this
to the single payer health care system in UK which allows the entire population to
access health insurance. However; the existence of a gradient has shown that there are
some external factors outside the access to health insurance that causes the gradient to
steepen as children age.
In a similar study, Khanam et al. (2009) find the gradient effect to be smaller in
Australia in comparison to the US and the UK. The authors find the effect of income on
health to be lower once the model controls for additional factors such as parental
education and parental health. The paper argues that parental health may be the best
indicator of child health in poorer households in Australia. In contrast, Reinhold et al.
(2012) find the gradient effect in Germany to be as strong as that in the U.S. However;
even though the gradient exists in Germany, the effect of income did not accumulate
with age. Reinhold et al. (2012) found similar results to Case et al. (2002) for chronic
conditions. Wealthier children were able to manage their chronic conditions better.
In a recent paper, Currie et al. (2008) examine this effect in the wake of rapid public
expanded Medicaid to children post 1996. While the authors find the existence of such
gradient effect in the US where poorer children face adverse health conditions as they
age, they find this effect to have wakened in comparison to Case et al. (2002).
Interestingly, the authors find Medicaid contributing to better childhood health as
children age, leading them to explore other causes of poor childhood health.
Given the background, the primary objective of this paper is to reexamine the
health-income gradient effect in the US. This is an important contribution given that the
most of the studies cited earlier on the US utilizes the data that are at least a decade old
and there have been some significant health care reforms that have greatly increased
insurance coverage in the US which may have led to a change in the child
health-income gradient. The paper finds a gradient effect between childhood health and
household income and the effect of income is still found to be increasing with age.
However, in comparison with other studies, this paper finds the gradient to be flatter.
There are some other factors, such as parental education, that are becoming more
important in early childhood that has changed from past literature.
Data
The data source used in this research is from the National Health Interview
survey (NHIS). This survey collects data on a wide range of demographic, health, and
insurance related variables for both children and adults. The data in this paper covers
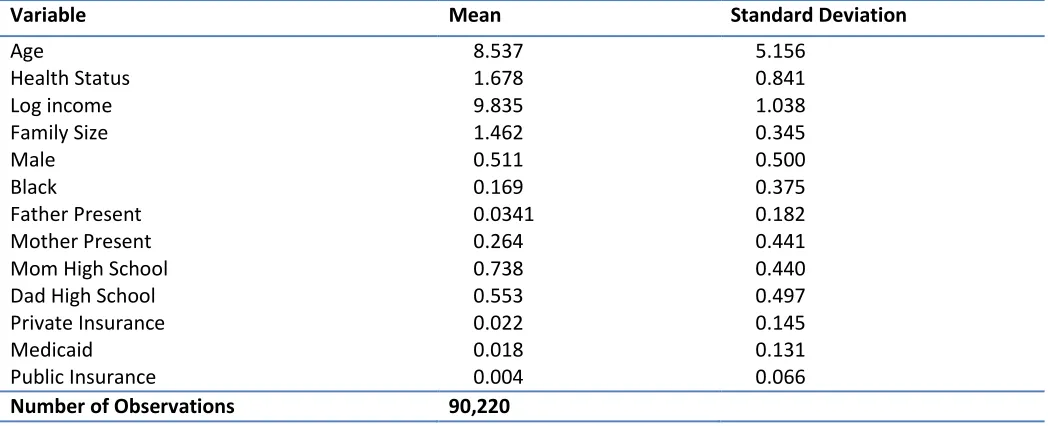
information from 2009 to 2012 for children below 18 years. The summary statistics for
Table 1 – Summary Statistics
SOURCE: NHIS
In the NHIS health is rated on a scale of 1 to 5, 1 being excellent and 5 being
poor. The health status information for the children is based on parental opinion, not
from medical observation. The data that this paper uses is for children under 18. The
average age is 8.537 and average health status is 1.678. The mean income is $18,676
and natural log is used to keep income measures consistent with past literature. The
parental variables, Mom High School and Dad High School, are defined as if the
parents have 12 or more years of education. Roughly 74 percent of the mothers and 55
percent of the fathers had more than 12 years of education. The parental education
variables are dummy variables, which means if the parents have their high school
diploma or more, the variable takes the value of 1 and if they do not have 12 years of
education it takes a value of 0. This is similar to the demographic variables where if the
child has that characteristic the variable takes the value of 1.
About 50 percent of the sample was male and approximately 17 percent were
African American.
Variable Mean Standard Deviation
Age 8.537 5.156
Health Status 1.678 0.841
Log income 9.835 1.038
Family Size 1.462 0.345
Male 0.511 0.500
Black 0.169 0.375
Father Present 0.0341 0.182
Mother Present 0.264 0.441
Mom High School 0.738 0.440
Dad High School 0.553 0.497
Private Insurance 0.022 0.145
Medicaid 0.018 0.131
Public Insurance 0.004 0.066
Model
The estimated model in this paper is similar to that proposed by Case et al.
(2002). The dependent variable is childhood health status as a function of household
income, parental controls variables on insurance availability and additional variables to
control for regional and year effects.
ChildhoodHealth= ( )
( )
)
The model is estimated using the ordered probit estimation methodology given that the
dependent variable is not a continuous one and takes values between 1 through 5.. This
model is estimated for four different age groups 0-3, 4-8, 9-12, and 13-17 to evaluate
the changes to income-health gradient as children age.
Results
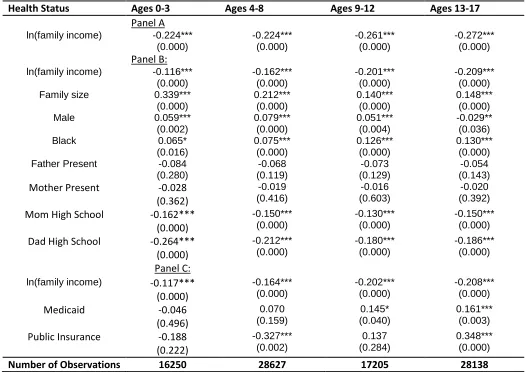
The estimated ordered probit coefficients are reported in table 2. Panel A reports
the effect of household income on childhood health status for different age groups. The
estimated coefficients are negative and significant at the 1% level which emphasizes
the importance of household income in influencing childhood health1. As we can see,
the absolute values of the coefficients marginally increase as we move to older age
groups. This corroborates that the accumulated effect of income on childhood health as
a child ages as cited by the literature.
1
Table 2 – Ordered Probit Estimations
Health Status Ages 0-3 Ages 4-8 Ages 9-12 Ages 13-17
Panel A ln(family income) -0.224***
(0.000) -0.224*** (0.000) -0.261*** (0.000) -0.272*** (0.000) Panel B:
ln(family income) -0.116*** (0.000) -0.162*** (0.000) -0.201*** (0.000) -0.209*** (0.000)
Family size 0.339***
(0.000) 0.212*** (0.000) 0.140*** (0.000) 0.148*** (0.000)
Male 0.059***
(0.002) 0.079*** (0.000) 0.051*** (0.004) -0.029** (0.036)
Black 0.065*
(0.016) 0.075*** (0.000) 0.126*** (0.000) 0.130*** (0.000)
Father Present -0.084
(0.280) -0.068 (0.119) -0.073 (0.129) -0.054 (0.143)
Mother Present -0.028
(0.362) -0.019 (0.416) -0.016 (0.603) -0.020 (0.392)
Mom High School -0.162***
(0.000) -0.150*** (0.000) -0.130*** (0.000) -0.150*** (0.000)
Dad High School -0.264***
(0.000) -0.212*** (0.000) -0.180*** (0.000) -0.186*** (0.000) Panel C:
ln(family income) -0.117*** (0.000) -0.164*** (0.000) -0.202*** (0.000) -0.208*** (0.000) Medicaid -0.046 (0.496) 0.070 (0.159) 0.145* (0.040) 0.161*** (0.003)
Public Insurance -0.188
(0.222) -0.327*** (0.002) 0.137 (0.284) 0.348*** (0.000)
Number of Observations 16250 28627 17205 28138
Source: NHIS, Controls 1 is just a basic function between health status and ln(family income). NHIS controls 2 introduce the race, gender and parental controls as well as the region and year controls. The final control group uses the same controls as the second but introduces the insurance variables. (*) significant at 10 %;(**) significant at 5%; (***) significant at 1%.
Panel B estimates the model after including additional control variables. A clearer
picture emerges once we compare the estimated coefficients for the income variable
across different age groups. As we can see, the absolute values of the coefficient
increase as we move to higher age groups. This provides evidence that the income
health gradient becomes steeper as children age and further highlights the accumulated
effect of income on childhood health. The estimated model in Panel B also provides
it is not statistically significant. The Black and male coefficients both have positive
values for almost every age group for both. This infers that the likelihood of being in
poor health is higher for a male or an African American. The effect of parental education
on childhood health is positive and significant. Intuitively this is important because
parents that are better educated are more likely to be better informed and have a
greater knowledge of their child’s health. This helps these children to have better health
statuses because their parents are able to help them better. Interestingly, the effect of
father’s education is stronger than that of mother’s which comes as a contrast to the
earlier literature which finds a stronger role for mother’s education.
The Panel C reports the results for the expanded model that controls for
insurance availability along with the controls included in Panel B. For conciseness, we
only report the estimated coefficients for the income and insurance variables. The
coefficients on income reveal similar information to those reported in panel A and B.
The coefficient on Medicaid is negative and insignificant for the lowest age group, but
the coefficient becomes positive as we move to older age groups. In fact, it becomes
positive and significant for the last two age groups. This implies that older children with
access Medicaid have a higher chance of being in worse health. This may be because
children with access to Medicaid are already in the poorer income brackets so they may
be experiencing some of the other adverse effects and the results are showing that just
having access to Medicaid is not increasing their chances of being in good health. The
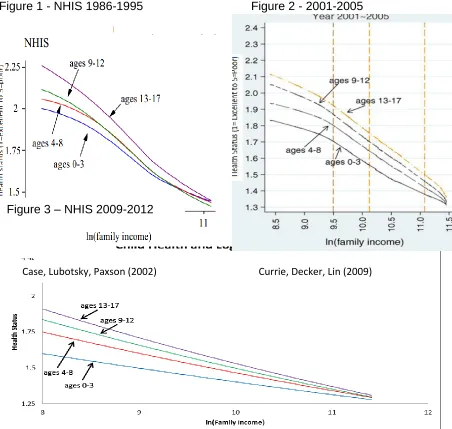
Figure 1 - NHIS 1986-1995 Figure 2 - 2001-2005
(Case, Paxson, Lubotsky (2002)) (Currie, Decker, Lin (2007))
Figure 3 - NHIS 2009-2012
Figure 3 - NHIS 2009-2012
The above figures compare the evidence on income-health gradient from three
different studies on the US that utilizes the NHIS data for different time periods. Figures
1 and 2 are from Case et al. (2002) and Currie et al. (2007), and correspond to period
1986-1995 and 2001-2005 respectively. Figure 3 reports the evidence from our study
and corresponds to 2009-2012. The common theme among these three figures is that
household income affects childhood health positively and the gradient steepens as
children age. Interestingly, the gradient flattens as from 1986-1995 through 2009-2012.
This implies that though income is an important variable in determining childhood Case, Lubotsky, Paxson (2002) Currie, Decker, Lin (2009)
health, its effect has weakened over time. This can be attributed to various control
variables that are included in the model. The most important one is the parental
education. As we know, the educational attainment of US population has grown over
time. Given that educated parents are better informed and affect childhood health
positively, the flattening gradient can be attributed to parental education. Also, the
access to insurance and public health care has increased over the last two decades,
hence can be argued to be factors contributing to flatter income-health gradient.
Policy Implications
Many of the recent policies regarding health insurance reforms over the past 20
years have focused intensely on the expansion of health coverage. While expanding
coverage allows more people to see a physician and be able to take care of themselves
before it becomes an emergency, there are other factors that are more relevant
affecting childhood health. One of the factors that policy makers should consider
beyond the provision public health insurance is the provision of health education both to
children as well as to parents. As our previous analysis shows that parental education is
one of the very influential factors that have contributed in flattening the gradient. This is
important in the sense that such health education programs make parents more aware
of their child’s health and hence, will help them to make informed decision to improve
their children’s health by utilizing the available insurance. Further, the literature cited
earlier also finds the existence of gradient effect even in countries with universal health
insurance coverage. This further indicates that simply expanding health insurance
coverage is not enough to make the gradient disappear. Universal health coverage
children stay in better health longer. Future health policy may want to make an attempt
to improve the health of older children. Older children tend to be in worse health than
younger children and this might be due to a lesser utilization of insurance among
adolescents in poorer households. Focusing on making their health better, possibly
through education programs or creating more incentives to see the doctor, could lead to
a greater equalization in human capital by the time they reach early adulthood.
Conclusion
This paper makes an important contribution to the health economics literature by
empirically reexamining the concept income health gradient for the US by using
2009-2012 NHIS data. The empirical exercise reveals the existence of gradient effect, albeit
much flatter that is documented in the literature. Importantly, other factors such as
parental education are important contributors in flattening this gradient effect. Further
the study emphasizes that expansion of medical coverage cannot be the lone solution
to eliminate this effect as the study finds older children to have weaker health even in
the presence of public health coverage programs
As an extension, it will be interesting to reexamine the contribution of chronic
conditions in explaining the existence of gradient effects. It would be interesting to see if
poorer children are still more likely to be diagnosed with these diseases even in the
presence of an increased access to health insurance. Also extending the research to
include more detailed parental variables could provide some more insights on how to
help parents help their children. This could lead to some important information that
References
Case, Anne, and Christina Paxson. "Causes and Consequences of Early-Life Health."Demography
47.S (2010): S65-85. Print.
Currie, Janet. "Healthy, Wealthy, and Wise: Socioeconomic Status, Poor Health in Childhood,
and Human Capital Development." Journal of Economic Literature 47.1 (2009): 87-122. Print.
Case, Anne, Darren Lubotsky, and Christina Paxson. "Economic Status and Health in Childhood: The
Origins of the Gradient." American Economic Review 92.5 (2002): 1308-334. Print.
Anne Case, and Christina Paxson. "Causes and Consequences of Early-Life Health."Demography
47.S (2010): S65-85. Print.
Case, Anne, Diana Lee, and Christina Paxson. "The Income Gradient in Children's Health: A Comment
on Currie, Shields and Wheatley Price☆." Journal of Health Economics27.3 (2008): 801- 07.
Print.
Currie, Janet, Sandra Decker, and Wanchuan Lin. "Has Public Health Insurance for Older Children
Reduced Disparities in Access to Care and Health Outcomes?" Journal of Health Economics,
2008. Web. 10 Apr. 2014.
Fletcher, Jason, and Barbara Wolfe. "Increasing Our Understanding Of The Health-Income Gradient In
Children." Health Economics (2013): N/a. Print.
Currie, Alison, Michael A. Shields, and Stephen Wheatley Price. "The Child Health/family Income
Gradient: Evidence from England." Journal of Health Economics 26.2 (2007): 213-32. Print.
Murasko, Jason E. "An Evaluation of the Age-profile in the Relationship between Household Income
and the Health of Children in the United States." Journal of Health Economics 27.6 (2008):
1489-502. Print.
Martinson, Melissa L. "Income Inequality in Health at All Ages: A Comparison of the United States and
England." American Journal of Public Health 102.11 (2012): 2049-056. Print.
Condliffe, Simon, and Charles R. Link. "The Relationship between Economic Status and Child Health:
Evidence from the United States." American Economic Review 98.4 (2008): 1605-618. Print.
Smith, James P., Yan Shen, John Strauss, Yang Zhe, and Yaohui Zhao. "The Effects of Childhood
Health on Adult Health and SES in China." Economic Development and Cultural Change 61.1
(2012): 127-56. Print.
Khanam, Rasheda, Hong Son Nghiem, and Luke B. Connelly. "Child Health and the Income Gradient:
Violato, Mara, Stavros Petrou, and Ron Gray. "The Relationship between Household Income and
Childhood Respiratory Health in the United Kingdom." Social Science & Medicine 69.6 (2009):
955-63. Print.
Reinhold, Steffen, and Hendrik Jürges. "Parental Income and Child Health in Germany."Health
Economics (2011): N/a. Print.
Adler, Nancy E., Thomas Boyce, Margaret A. Chesney, Sheldon Cohen, Susan Folkman, Robert L.
Kahn, and S. Leonard Syme."Socioeconomic Status and Health: The Challenge of the
Gradient." American Psychologist 49.1 (1994): 15-24. Print.
Case, Anne, Diana Lee, and Christina Paxson. "The Income Gradient in Children's Health: A Comment
on Currie, Shields and Wheatley Price." Journal of Health Economics27.3 (2008): 801-07. Print.
Halfon, Neal, and Paul Newacheck. "Childhood Asthma and Poverty: Differential Impacts and Utilization of
Health Services." Pediatircs 91.1 (1993): 56-61. Web.
Case, A., and C. Paxson. "Parental Behavior And Child Health." Health Affairs 21.2 (2002): 164-78.