Is computer availability at home causally
related to reading achievement in grade 4? A
longitudinal difference in differences approach
to IEA data from 1991 to 2006
Monica Rosén
*and Jan‑Eric Gustafsson
Background
Is the level of home computer use causally related to reading achievement? This ques-tion is addressed in this paper theoretically, methodologically, and empirically through secondary analyses of data from reading literacy studies conducted by the IEA in 1991, 2001, and 2006. Based on previous analyses of aggregated country-level data (Rosén and Gustafsson 2014), our hypothesis is that increased computer use at home has a negative effect on reading achievement and that this can be explained by displacement theories.
Abstract
Research on effects of home computer use on children’s development of cognitive abilities and skills has yielded conflicting results, with some studies showing positive effects, others no effects, and yet others negative effects. These studies have typically used non‑experimental designs and one of the main reasons for the conflicting results is that studies differ with respect to how well they control for selection bias in com‑ parisons of children with different amounts of computer use. The current study takes advantage of data from international comparative studies of educational achievement and uses the trend design of these studies to conduct longitudinal analyses at the country level. This allows for a difference in differences approach which effectively con‑ trols for within‑country selection bias, time‑invariant country‑level omitted variables, and random errors of measurement in the independent and dependent variables. The empirical investigations are based on data from the IEA 10‑Year Trend Study and the PIRLS 2001 and 2006 studies. For these studies, information about frequency of home computer use is available in the student questionnaire. The main analytical approach employed in the paper is regression estimation based on micro‑data, with fixed coun‑ try effects and cluster‑robust standard‑errors. This approach allows estimation of main effects of home computer use and interaction effects with student characteristics (gen‑ der and socio‑economic status). For both data sets negative effects of home computer use on achievement are found. Results are discussed in substantive and methodologi‑ cal terms, focusing particularly on possible threats to valid causal inference, such as omitted variables that are not time invariant.
Keywords: Home computer use, Reading literacy, Causal inference, Difference in differences
Open Access
© 2016 Rosén and Gustafsson. This article is distributed under the terms of the Creative Commons Attribution 4.0 International License (http://creativecommons.org/licenses/by/4.0/), which permits unrestricted use, distribution, and reproduction in any medium, provided you give appropriate credit to the original author(s) and the source, provide a link to the Creative Commons license, and indicate if changes were made.
RESEARCH
We argue that the reallocation of time in favor of computer activities has resulted in less time being allocated to reading for enjoyment.
Along with the substantive question, the present study focuses on two methodologi-cal research questions: (1) to what extent does introduction of student level data into the analysis contribute to a more powerful and informative analysis of main effects of home computer use and interactions with student characteristics (gender and social background); and (2) to what extent do these analyses warrant generalized causal infer-ence about effects of home computer use on students’ reading achievement? We address these issues by taking advantage of the longitudinal design of the studies at the country level and use a difference in differences (DiD) estimation approach implemented with regression analysis with country fixed effects estimated from student level data.
Increasing access to computers at home has been observed in all western countries since the beginning of 1990s, although more rapidly so in the richest countries. Higher and higher proportions of children report that they use computers outside of school every day and for many hours. This indicates a societal change in spare time habits, and researchers across disciplines pose questions about their effects (Fraillon et al. 2014; OECD 2015). Of particular interest is the effect that increased computer use may have on educational achievement, given that there often are high expectations of positive effects on student learning (Grimes and Warschauer 2008; Holcomb 2009; Ophir et al.
2009). Negative effects on students’ learning have also been suggested as the access to computers with their many possibilities and options also include sources of distraction of various sorts (Bugeja 2007; Skolnik and Puzo 2008; Grimes and Warschauer 2008; Holcomb 2009; Wood et al. 2012; Junco 2012; McCoy 2013).
Previous research and theoretical foundations
The literature provides several categories of theories and hypotheses to explain why there may be an effect of computer use on reading achievement (see Rosén and Gustafs-son 2014, for a more elaborate description). One category is formed by Content theories, which argue that the effect is a function of the content of the computer use or the type of activity performed (e.g. searching for information, making a spreadsheet). The effect can be positive or negative depending upon the content. This is the same type of theory that has been suggested for the positive relationship found between watching educational TV programs and school achievement. This is in contradiction to the more general theory that children’s increased TV-watching would pacify children, which in turn would result in detrimental effects on their cognitive abilities (Schmidt and Anderson 2006; Schmidt & Vandewater 2008; Razel 2008).
displacement theory, if computer time replaces reading and educational activities, this may have negative effects on the development of skills.
Activation theory, which is often relied on in research on stress, is based on the idea that the brain needs to be activated at a certain level in order to function well. There may be a damaging effect on cognitive functioning if the computer tasks either under- or over-activate the brain through passive reception or information overload. On the other hand, if the tasks are instead interactive and cognitively challenging to an appropriate degree, computer use can result in positive effects on intellectual development.
A final category is Distraction theory, which argues that the multitude of activities, information, formats, and presentations distracts the computer user with tempting activities and sidetracking features that call for attention and disturb any learning activ-ity undertaken. This theoretical line of reasoning is based on two premises. The first is that computers offer a multitude of activities that anyone easily can switch between and that this type of multitasking is common behavior among users. Experimental research so far has shown multi-tasking to have a negative effect on achievement (Wood et al.
2012; Ophir et al. 2009; see also Welford 1967). Research has also shown that students often choose to engage in multi-tasking activities in parallel with learning activities to fight boredom, entertain themselves, and stay connected to the outside world (McCoy
2013). Research has also reported that students get distracted by the multi-tasking activ-ities conducted by their peers (Fried 2008; Sana 2012; Junco 2012). The second premise is the commercial presence in almost all internet activities and often also in free software of various sorts, exposing ads and teasers to the user screen in ways that are intended to be impossible not to notice (Hsieh and Chen 2011). Thus, according to distraction the-ory, even the most self-regulated and self-disciplined learner cannot avoid being affected by these features. Distraction theory might serve to explain why the extensive spread of home computers and internet access does not result in the many positive learning and democratic gains that are expected. It should be pointed out that none of the four theo-ries described exclude the other.
The different categories of theories thus predict both positive and negative effects of home computer use on achievement. The theories have not been systematically tested against each other, but they have more or less explicitly been relied upon in several empirical studies, briefly reviewed below.
Fiorini (2010) analyzed longitudinal data from an Australian sample of 4–5 year-olds using an instrumental variable approach and found positive effects of home com-puter use on two different cognitive tests measuring school readiness. Content theories seemed to provide the most plausible explanation for the outcomes, according to Fiorini (2010).
not generalize beyond the sub-population. Fairlie (2012a, b) has reported results from another study with the same experimental design but with a focus on low-income college students and minority students (N = 286, of which 141 students received a computer). His analyses show that the minority low-income students who received a computer achieved better results on several educational outcome variables than the minority low-income students who did not.
In a reanalysis of data from PIRLS 2001 and TIMSS 1999, Barber (2006) found a posi-tive correlation at the country level between computer access at home and student per-formance in reading, mathematics, and science. The relationship held even taking into account wealth differences between countries, measured by per capita income. Barber (2006) concluded that rich countries’ educational advantage is a result of better access to computers. However, the cross-sectional design of the study does not support strong causal inference and another interpretation of the findings is that the higher educational level of the rich countries has contributed both to increased computer access and higher achievement.
In a cross-sectional large-scale Irish study, Casey et al. (2012) investigated content theory by studying whether the applications used or tasks performed by the children on the home computer had differential effects on achievement. Using ordinary least squares (OLS) regressions they found computer use by 9-year-old children to be associated with higher reading and mathematics test scores, when other determinants were held constant. They also found that doing projects on the computer, surfing the internet for fun, and using email was associated with higher test results; however, these results were influenced by self-selection, so any causal conclusion based on the observed relations is not warranted.
Fuchs and Wößmann (2004) analyzed student data from 31 countries in the OECD’s PISA study in 2000 and found a positive correlation between computer access at home and student performance in reading and mathematics. However, this relationship disap-peared when controlling for student home background. When also controlling for dif-ferences in school resources and other institutional factors, the link between computer access at home and student performance turned strongly negative. Although not directly investigated, Fuchs and Wößmann (2004) hypothesized that the availability of comput-ers at home distracts students from effective learning, aligning their interpretation with distraction theories.
Using the German PISA data from 2003, Wittwer and Senkbeil (2008) investigated the relationship between home computer use and mathematics achievement. They argued that because computer activities often involve problem-solving there should be a posi-tive relationship with problem-solving in mathematics. They were surprised not to find any effect of home computer use on mathematics achievement when controlling for socio-economic factors and other leisure time activities such as reading and watching television.
with a modest but statistically significant negative impact on students’ mathematics and reading test scores. They also found increased availability of high-speed internet access to be associated with less frequent self‐reported computer use for homework, in addition to significantly lower test scores in mathematics and reading. Based on these findings, Vigdor et al. (2014) argued that universal access to home computers and high‐ speed internet access will broaden, rather than narrow, math and reading achievement gaps, because home computer technology is put to more productive use in households with more effective parental monitoring, and in households where parents can serve as more effective instructors in the productive use of online resources.
This brief review of the empirical literature of effects of home computer use on student achievement shows a mixture of positive, negative, and null effects of computer use on academic achievement. This lack of consistency may partly be explained by the fact that the studies have included a wide range of age groups, outcomes, and kinds of computer use, and such factors may interact with home computer use, causing both positive and negative effects for different combinations of factors.
Most previous research on the relation between computer use and school achievement has been guided by content theories, but the lack of firm empirical support together with unexpected findings of negative effects on achievement has made displacement theories more popular in recent research. Content theories may be more useful in settings where the computer activity undertaken is guided by specific learning tasks or learning goals. The spare time computer habits that children engage in do not seem to contribute to achievement in reading in general.
The lack of consistent results is likely also due to methodological challenges in mak-ing correct inferences about effects of home computer use from non-experimental data. Thus, the studies vary in the extent to which they control for selection bias when com-paring groups of students with varying amounts of home computer use. An interesting example demonstrating this is the Fuchs and Wößmann (2004) study, which showed that as the strength of control successively increased, the home computer use effect estimates changed from being positive to negative. Vigdor et al. (2014), who also found negative effects of home computer use, used a very powerful approach to control for selection bias based on estimating student fixed effects in longitudinal data.
Using the difference in differences approach
This approach can be used not only at the individual level, but also at higher levels of aggregation, such as the class, school, and country levels. Gustafsson (2007) observed that the repeated cross-sectional design used in the international studies of educational achievement (e.g. PISA, PIRLS, and TIMSS) to measure trends in the development of achievement have a longitudinal design at the country level. Thus, using data aggregated to the country level makes it possible to take advantage of the strength of longitudinal designs.
A previous study by Rosén and Gustafsson (2014) investigated the effect of home-computer use on reading achievement for 9–10 year-olds using a simple DiD approach where change in reading achievement was plotted against change in home computer use over two periods of time. In an analysis of change between 1991 and 2001 for the nine countries that participated in the IEA 10-Year Trend Study (10YTS) a significant negative relationship was found. The negative relation was replicated in an analysis that included the OECD countries participating in both PIRLS 2001 and PIRLS 2006. Nega-tive correlations also were found between home computer use and indicators of spare time reading habits, suggesting that the negative relation between home computer use and reading achievement was due to a displacement of reading time with computer time.
In these studies longitudinal data were created by aggregation of data to the country level. However, aggregation of data brings other advantages as well. For example, mecha-nisms that, at the individual level, are responsible for reverse causality, such as compen-satory resource allocation, are unlikely to be present at the country level (Gustafsson
2008). Aggregated data also have the advantage of not being as severely influenced by errors of measurement, compared to individual data. Thus, while student responses to single questionnaire items typically are highly unreliable, estimates of country means are very reliable when sample sizes are large (Jones and Norrander 1996). Therefore, the downward biasing effect of errors of measurement is less of an issue with aggregated data than with individual data.
There is reluctance to use aggregated data in many disciplines, which at least partly is due to the fear of committing the ‘ecological fallacy,’ or the fallacy of making inferences about relations between variables at the individual level from observed relations at an aggregated level. Even though correlations cannot be compared across levels of aggre-gation, unstandardized regression coefficients are invariant over levels of aggregation (see Angrist and Pischke 2009, pp. 40–42). Thus, the ecological fallacy arises because of shrinkage of the variances of the aggregated variables, which causes aggregate-level cor-relations not to reflect the strength of the individual-level cor-relationship. Therefore, inter-pretations of relations estimated with aggregated data must be based on unstandardized coefficients. Furthermore, it must be emphasized that many processes and relations within the field of education do occur at levels of observation above the individual level and both the strength and direction of relations among variables may be different across levels of observation. Thus, by focusing exclusively at the lowest level of observation, the researcher runs the risk of committing an “individualistic fallacy.”
is that this simple approach does not allow analysis of interactions between variables at different levels of observation. In many cases it is of great interest to investigate interac-tions between a treatment variable observed at an aggregate level and individual charac-teristics (e.g. does home computer use affect achievement for boys and girls in different ways?), making this a serious limitation of the method. But, the simple approach can be extended by instead conducting a so-called regression analysis with “fixed unit effects” based on individual-level data, and aggregated variables added for each case. This is the approach used in the present study, and it is presented in greater detail below.
Methods
To investigate effects of computer use at home on reading achievement we used data from two IEA trend studies of reading, the Reading Literacy Study 1991 (Elley 1994), which was repeated in 2001 in the 10YTS (Martin et al. 2003), and the IEA PIRLS stud-ies from 2001 (Mullis et al. 2003) to 2006 (Mullis 2007). Thus, the first analysis covers changes in reading achievement and computer use at home between 1991 and 2001, and the second covers changes between 2001 and 2006.
Data and variables
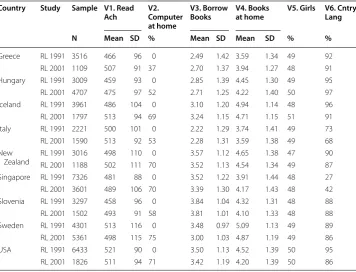
Nine countries participated in the 10YTS. The variables focused upon in the reanalysis were frequency of home computer use and frequency of borrowing books, both ana-lyzed at the country level. There were no questions about frequency of home computer use in the 10YTS. As such, information available in PIRLS 2001 study samples was used to fill this gap. For the 1991 study the frequencies were set to zero, under the assumption that home computers were not widely available in 1991. Along with these two variables, three student background variables were included: gender, number of books at home, and whether the language spoken at home was the language of the test. The model also included the plausible values for the total reading score, as well as for the sub-scores rep-resenting narrative, expository, and document text types. Before the analysis, the plau-sible values were divided by 100 in order to equalize the variances of the variables in the model. Descriptive information for this dataset is presented in Table 1, the results for each of the selected variables being summarized for each country at both 1991 and 2001.
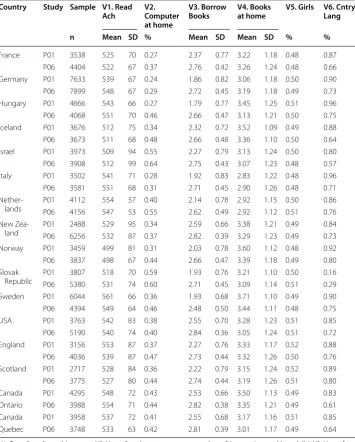
The second reanalysis is based on data from PIRLS 2001 and 2006. As in the Rosén and Gustafsson (2014) study only the OECD countries were included. However, Slove-nia was excluded, because no information was available about language spoken at home in PIRLS 2006. The same variables included in the 10YTS were selected for the PIRLS reanalysis as well. In both studies, students who reported that they used home comput-ers daily or almost daily, or once or twice weekly were assigned a code of 1, while those who reported less frequent use were assigned a code of 0. Descriptive information for this second dataset is presented in Table 2, the grade 4 results for each of the selected variables being summarized for 16 OECD school systems for the 2001 and 2006 studies.
Estimation techniques
As was mentioned in the introduction to the DiD above, regression analyses with fixed country effects were used in this study. We use the linear model:
(1)
where achievement T in country c at time t for student i is a function of home computer use (U), other time-varying country characteristics (C), and individual student character-istics (F) such as family background and gender. The model also includes a set of country dummy variables (μc) to represent time-invariant factors for country c, such as the level
of development of societal and educational institutions. There is also a dummy (μt)
repre-senting general change between the time points, and an error term, εcti. In this model the
country and time point fixed effects (μc and μt) partial out time-invariant country
charac-teristics, making the model estimate the parameters of interest from within-country vari-ation over time. It should be noted that according to Eq. (1) home computer use and the time-varying country characteristics are measured at the country level and disaggregated to the student level, while the individual characteristics are measured at the student level.
The model in (1) can also easily be extended by adding interaction terms. Here we are interested in estimating possible differential effects of home computer use as a function of student characteristics, such as gender. This is accomplished by adding cross-product terms (e.g., α2 (Uct × Gendercti)) to the equation. Before the cross-product was computed
the variables were centered around the grand means.
The regression equation includes a dummy variable for each country, minus one refer-ence country. Thus, if data for 16 countries are analysed, 15 dummy variables are added to the regression model, which has the same effect as computing difference scores. Such a regression model can, in principle, be estimated with any regression analysis Table 1 Descriptive information at the country level, sample sizes and summary informa-tion for the selected variables for the period 1991–2001
V1. Overall reading achievement, V2. How often do you use computer at home? (proportion weekly or daily), V3. How often do you borrow books from a school or public library? [never (1), hardly ever (2), monthly (3), once a week (4), more often (5)], V4. About how many books are there in your home? [none (1), 1–10 (2), 11–50 (3), 51–100 (4), 101–200 (5)], V5. Are you a boy or a girl? [boy (0), girl (1)], V6. How often do you speak [language of test] at home? [always (1), not always (0)]
RL reading literacy
Country Study Sample V1. Read
Ach V2. Computer
at home
V3. Borrow
Books V4. Books at home V5. Girls V6. Cntry Lang
N Mean SD % Mean SD Mean SD % %
Greece RL 1991 3516 466 96 0 2.49 1.42 3.59 1.34 49 92
RL 2001 1109 507 91 37 2.70 1.37 3.94 1.27 48 91
Hungary RL 1991 3009 459 93 0 2.85 1.39 4.45 1.30 49 95
RL 2001 4707 475 97 52 2.71 1.25 4.22 1.40 50 97
Iceland RL 1991 3961 486 104 0 3.10 1.20 4.94 1.14 48 96
RL 2001 1797 513 94 69 3.24 1.15 4.71 1.15 51 91
Italy RL 1991 2221 500 101 0 2.22 1.29 3.74 1.41 49 73
RL 2001 1590 513 92 53 2.28 1.31 3.59 1.38 49 68
New
Zealand RL 1991 3016RL 2001 1188 498502 110111 700 3.573.52 1.12 4.651.13 4.54 1.381.34 4947 9087
Singapore RL 1991 7326 481 88 0 3.52 1.22 3.91 1.44 48 27
RL 2001 3601 489 106 70 3.39 1.30 4.17 1.43 48 42
Slovenia RL 1991 3297 458 96 0 3.84 1.04 4.32 1.31 48 88
RL 2001 1502 493 91 58 3.81 1.01 4.10 1.33 48 88
Sweden RL 1991 4301 513 116 0 3.48 0.97 5.09 1.13 49 89
RL 2001 5361 498 115 75 3.00 1.03 4.87 1.19 49 86
USA RL 1991 6433 521 90 0 3.50 1.13 4.52 1.39 50 95
program. However, in order to obtain correct estimates of the standard-errors, the pro-gram needed to be able to take the effects of clustering of data into account. Sampling of clusters (e.g., countries and schools) typically implies loss of information compared to independent sampling of individuals, which, if uncorrected, causes underestima-tion of standard errors (Hox 2010). This can, for example, be done with the Stata pro-gram (“cluster-robust standard errors”) and with the Mplus propro-gram (“complex option”; Muthén and Muthén 1998–2012). When country-level analyses are conducted the coun-try identification variable is used to define the clusters.
Table 2 Descriptive information at the country level, sample sizes and summary informa-tion for the selected variables for the period 2001–2006, OECD countries only
V1. Overall reading achievement, V2. How often do you use computer at home? (proportion weekly or daily), V3. How often do you borrow books from a school or public library? [never (1), once or twice a month (2), at least once a week (3)], V4. About how many books are there in your home? [0–10 (1), 11–25 (2), 26–100 (3), 101–200 (4), more than 200 (5)], V5. Are you a boy or a girl? [boy (0), girl (1)], V6. How often do you speak (language of test) at home? [always (1), not always (0)] P01, PIRLS 2001; P06, PIRLS 2006
Country Study Sample V1. Read
Ach V2. Computer
at home
V3. Borrow
Books V4. Books at home V5. Girls V6. Cntry Lang
n Mean SD % Mean SD Mean SD % %
France P01 3538 525 70 0.27 2.37 0.77 3.22 1.18 0.48 0.87
P06 4404 522 67 0.37 2.76 0.42 3.26 1.24 0.48 0.66
Germany P01 7633 539 67 0.24 1.86 0.82 3.06 1.18 0.50 0.90
P06 7899 548 67 0.29 2.72 0.45 3.19 1.18 0.49 0.73
Hungary P01 4666 543 66 0.27 1.79 0.77 3.45 1.25 0.51 0.96
P06 4068 551 70 0.46 2.66 0.47 3.13 1.21 0.50 0.75
Iceland P01 3676 512 75 0.34 2.32 0.72 3.52 1.09 0.49 0.88
P06 3673 511 68 0.48 2.66 0.48 3.36 1.10 0.50 0.64
Israel P01 3973 509 94 0.55 2.27 0.79 3.13 1.24 0.50 0.80
P06 3908 512 99 0.64 2.75 0.43 3.07 1.23 0.48 0.57
Italy P01 3502 541 71 0.28 1.92 0.83 2.83 1.22 0.48 0.96
P06 3581 551 68 0.31 2.71 0.45 2.90 1.26 0.48 0.71
Nether‑
lands P01P06 41124156 554547 57 0.4053 0.55 2.142.62 0.78 2.920.49 2.92 1.12 0.511.15 0.50 0.860.76 New Zea‑
land P01P06 24886256 529532 95 0.3487 0.37 2.592.82 0.66 3.380.39 3.29 1.23 0.491.21 0.49 0.840.73
Norway P01 3459 499 81 0.31 2.03 0.78 3.60 1.12 0.48 0.92
P06 3837 498 67 0.44 2.66 0.47 3.39 1.18 0.49 0.80
Slovak
Republic P01P06 38075380 518531 70 0.5974 0.60 1.932.71 0.76 3.210.45 3.09 1.14 0.511.10 0.50 0.160.29
Sweden P01 6044 561 66 0.36 1.93 0.68 3.71 1.10 0.49 0.90
P06 4394 549 64 0.46 2.48 0.50 3.44 1.11 0.48 0.75
USA P01 3763 542 83 0.38 2.55 0.70 3.28 1.23 0.51 0.85
P06 5190 540 74 0.40 2.84 0.36 3.05 1.24 0.51 0.72
England P01 3156 553 87 0.37 2.27 0.76 3.33 1.17 0.52 0.88
P06 4036 539 87 0.47 2.73 0.44 3.32 1.26 0.50 0.76
Scotland P01 2717 528 84 0.36 2.22 0.79 3.15 1.24 0.52 0.89
P06 3775 527 80 0.44 2.74 0.44 3.19 1.26 0.51 0.80
Canada P01 4295 548 72 0.43 2.53 0.66 3.50 1.13 0.49 0.83
Ontario P06 3988 554 71 0.44 2.82 0.38 3.35 1.21 0.49 0.61
Canada P01 3958 537 72 0.41 2.55 0.68 3.17 1.16 0.51 0.85
Large-scale studies that use a matrix-sampling design generate a set of so-called plau-sible values for each participant, which together include information both about the characteristics of the population and the uncertainty that arises from the matrix-sam-pling design (see, e.g., von Davier et al. 2009). To take advantage of the plausible values it is most convenient to use programs that have special routines built into deal with these and to compute the unified solution. The analyses reported in this paper were conducted with the Mplus program. The MLR estimator was used and the data was weighted with individual case weights scaled to the overall sample size. All analyses were conducted with five plausible values and unified with the procedure implemented in Mplus. Because the regression models are saturated models, issues of model fit did not occur.
Results
We first report the results from the analysis of the 1991–2001 data, and then the results of the analysis of the 2001–2006 data.
Results from analyses of change between 1991 and 2001 (10YTS)
The analysis is based on a sequential procedure in which models of increasing complex-ity were tested. In order to demonstrate the logic and procedures of DiD we use this small example to present the results from each of the major steps.
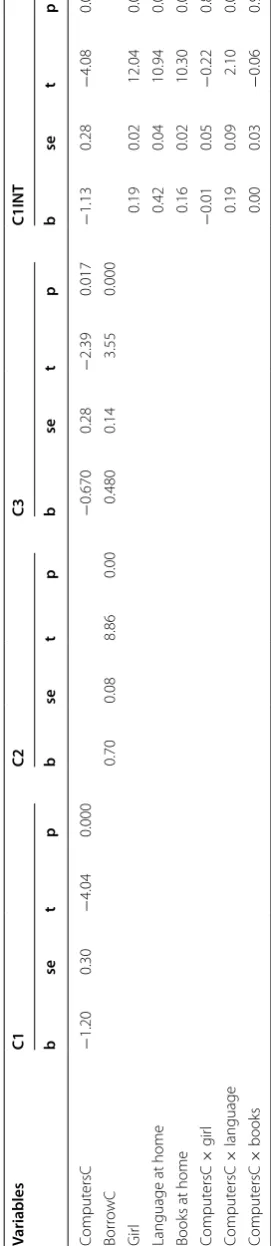
In the first step we only included the country level variable ‘Computer use at home’ (ComputersC) along with the country and time dummy variables (see Eq. 1 above) (Model C1). The estimates (see Table 3) showed that there was a significant nega-tive effect of computer use at home, the unstandardized regression coefficient being −1.20 for ComputersC. As has already been mentioned the plausible values for read-ing achievement were divided by 100, and the measure of computer use was expressed as the proportion of students saying they were using computers at least once or twice a week. Therefore, the estimated unstandardized coefficient of −1.20 implies a loss of 1.20 score points on the M = 500/SD = 100 scale for each percentage point that computer use increases. Thus, an increase by 0.10 of the proportion of students reporting use of computers at home at least once or twice weekly implies a loss of 12 score points on the overall reading scale, which is quite a substantial effect (0.12 SD).
Based on aggregated data for the nine countries, Rosén and Gustafsson (2014) esti-mated the regression coefficient for the difference scores for computer use and reading achievement at b = −1.13 (t = −2.83, df = 7, p < 0.025). The unstandardized regression coefficients thus were virtually identical in this analysis and the analysis based on micro-data reported in Table 3. However, the standardized coefficient was −0.73 in the analysis based on aggregated data, while it was −0.37 in the analysis based on student-level data. These differences reflect the different standard deviations of the variables in the two sets of data. They also imply that extra care should be taken in choice of which coefficient to interpret, and that generally the unstandardized regression coefficients should be the basis of interpretation of results.
Table 3 E stima tes in alt erna tiv e D iD mo dels f or the 10YT S Variables C1 C2 C3 C1INT b se t p b se t p b se t p b se t p Comput ersC − 1.20 0.30 − 4.04 0.000 − 0.670 0.28 − 2.39 0.017 − 1.13 0.28 − 4.08 0.000 Bor ro wC 0.70 0.08 8.86 0.00 0.480 0.14 3.55 0.000 Gir l 0.19 0.02 12.04 0.000
Language at home
0.42
0.04
10.94
0.000
Books at home
changes in amount of computer use are related to fixed country characteristics, such as economic and technological level, which in turn are correlated with achievement. Thus, the major increases in home computer use were observed in Sweden, USA, the Nether-lands, and Singapore while there was less change in Greece, Hungary, and Italy, which have lower levels of economic and technological development. Unless the influence of the fixed country characteristics on the results is removed, the results will be biased by these omitted variables. The introduction of country fixed effects thus serves to remove the biasing effects of such omitted variables.
In the next step the country level variable ‘Borrowing books at the library’ (BorrowC) was entered into the model (Model C2), still using the overall reading score as depend-ent variable, and according to this model there was a significant positive effect of bor-rowing books. When both ComputersC and BorrowC were entered into the regression model (Model C3), the partial regression coefficients were lower, but still significant. The decrease in the effect of ComputersC when BorrowC was introduced suggests that the negative effect of computer use is mediated via a decrease in consumption of reading materials. These results replicate those previously reported by Rosén and Gustafsson (2014), which were obtained with the simple procedure based on aggregated data only.
Countries also may change over time with respect to a large number of characteris-tics, and to the extent that these are related to student achievement, the effects of such changes need to be controlled for. We used three indicators to capture different aspects of social background; number of ‘Books at home’ as a proxy for student socio-economic background, ‘Language at home’ indicating whether the student speaks the language of the test at home or not, and gender. Gender and language at home were dummy-coded variables, those speaking the language of the test at home and girls coded 1, while boys and other language were coded 0. These three background variables are known to be related to reading achievement (e.g. Thorndike 1973; Elley 1994; Mullis et al. 2003, 2012; Mullis 2007). While the proportion of boys and girls is likely to remain fairly constant over the 10-year period investigated here, the other two variables may have changed dif-ferently in the nine countries, so they need to be included in the model.
There is also another reason to include these student characteristics in the model; namely, to investigate possible interaction effects with respect to reading achievement between student characteristics and frequency of computer use. Cross-product variables between ComputersC and each of the three student variables were therefore computed and entered into the model. The results are shown in Table 3 (Model C1INT).
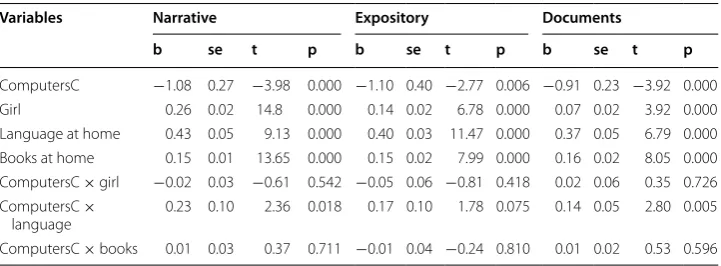
Results obtained in separate analyses of the three text types (Documents, Narrative, and Expository) using model C1INT are presented in Table 4. The estimates indicate that the effects of home computer use were more strongly negative for narrative and expository texts, than for the document text type. This is in line with expectations, given that home computer use, according to the displacement hypothesis, should affect skills in reading continuous text, rather than finding factual information in non-continuous texts such as graphs, maps, lists or sets of instructions, i.e., the text type that shares many similarities with how information often is presented at the computer screen. The relation between gender and performance on the narrative text type also was stronger than for the other two text types, and particularly so compared with documents. The interaction between language at home and computer use was strongest with respect to the narrative text type. The estimated coefficient for the interaction effect was lowest for documents.
In conclusion, the results obtained with analyses of student-level data replicate those found in previous research on aggregated data in showing that there is a general negative effect of home computer use on reading achievement. The fact that the estimate of the negative effect was reduced when frequency of borrowing books was introduced into the model also suggests that the home computer effect was mediated via a reduction of reading activities, which supports the displacement hypothesis. Support for this hypoth-esis was also provided by the finding that the effects of home computer use were more strongly negative for the narrative text type, than for documents and expository texts.
The analyses of student-level data also provided opportunities to investigate interac-tion effects with student background characteristics. And an interacinterac-tion was found between language spoken in the home and computer use, which, in particular, was apparent for the narrative text type. This outcome seems reasonable given that students who speak another language at home than the language used at school would be more vulnerable to influences which decrease opportunities to develop reading skills.
Results from analyses of change between 2001 and 2006 (PIRLS)
We now turn to the results from the analysis of the OECD countries in the PIRLS study that participated both in 2001 and 2006. The focus is on investigating if the results from the 10YTS replicate over time and across a wider selection of countries.
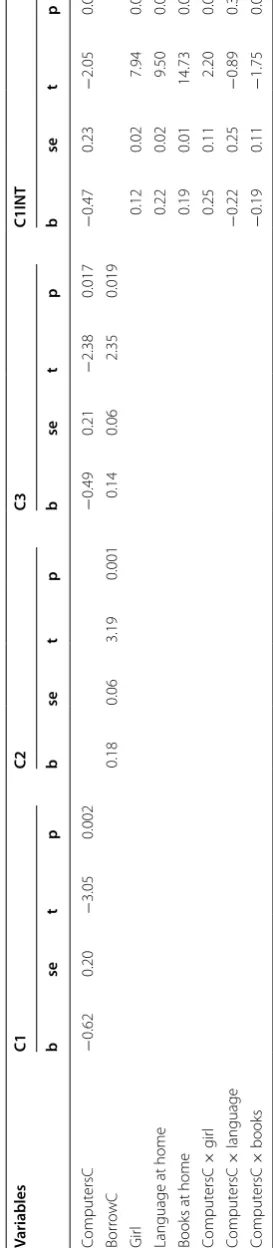
Results from the same models as were previously studied are presented in Table 5. Model C1 shows that in the present data there was also a significant negative effect of
Table 4 Estimates in DiD models for different reading types in the 10YTS
Variables Narrative Expository Documents
b se t p b se t p b se t p
ComputersC −1.08 0.27 −3.98 0.000 −1.10 0.40 −2.77 0.006 −0.91 0.23 −3.92 0.000
Girl 0.26 0.02 14.8 0.000 0.14 0.02 6.78 0.000 0.07 0.02 3.92 0.000
Language at home 0.43 0.05 9.13 0.000 0.40 0.03 11.47 0.000 0.37 0.05 6.79 0.000
Books at home 0.15 0.01 13.65 0.000 0.15 0.02 7.99 0.000 0.16 0.02 8.05 0.000
ComputersC × girl −0.02 0.03 −0.61 0.542 −0.05 0.06 −0.81 0.418 0.02 0.06 0.35 0.726
ComputersC ×
language 0.23 0.10 2.36 0.018 0.17 0.10 1.78 0.075 0.14 0.05 2.80 0.005
Table 5 E stima tes in alt erna tiv e D iD mo dels f
or the PIRLS study
Variables C1 C2 C3 C1INT b se t p b se t p b se t p b se t p Comput ersC − 0.62 0.20 − 3.05 0.002 − 0.49 0.21 − 2.38 0.017 − 0.47 0.23 − 2.05 0.040 Bor ro wC 0.18 0.06 3.19 0.001 0.14 0.06 2.35 0.019 Gir l 0.12 0.02 7.94 0.000
Language at home
0.22
0.02
9.50
0.000
Books at home
computer use at home. Additionally, there was a significant effect of borrowing books, and entering both variables in the regression equation caused the estimated effect of computer use at home to decrease. The general pattern of results in PIRLS thus agrees with what we found in the 10YTS. However, it should be noted that the size of the mated effect of computer use at home is smaller in PIRLS, the absolute value of the esti-mated regression coefficient only being about half as large as in the YTS.
It may also be noted that when the three student background variables and their interactions with computer use were added to the model, the effect of computer use decreased to b = −0.47. A model without the interaction terms produced the same result (b = −0.51), showing that part of the estimated effect can be attributed to coun-try-level changes in student characteristics over time.
In the 10YTS data we found an interaction effect between computer use and language spoken at home, but this interaction could not be found here. Instead there was an inter-action between gender and computer use in the PIRLS data, such that the negative effect of computer use was stronger for boys (−0.62) than for girls (−0.62 + 0.25 = −0.37).
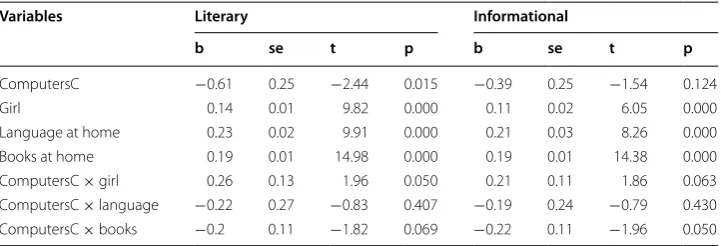
In PIRLS there are two different text types, literary and informational, and Table 6 pre-sents the results for the C1INT model separately for these. The effect of computer use was stronger for literary than for informational texts, and only for the former text type was the effect significant. The interaction effect between gender and computer use also was stronger for the literary text type, while the interaction was not significant for the informational text type.
Discussion and conclusions
In the current study we investigated effects of computer use at home on reading achieve-ment, using longitudinal data at the country level. The starting point was a previously reported study by Rosén and Gustafsson (2014) in which data aggregated to the country level was analysed. Here we instead used fixed effects regression techniques on student-level data to investigate two research questions: (1) to what extent does introduction of the student level data into the analysis contribute to a more powerful and informative analysis; and (2) to what extent do these analyses warrant generalized causal inference about effects of home computer use on students’ reading achievement?
With the 10YTS data we showed the global estimate of the effect of home computer use to be virtually identical when estimated from difference scores computed from
Table 6 Estimates in DiD models for different reading types in the PIRLS study
The model estimated corresponds to the C1INT model in Table 3
Variables Literary Informational
b se t p b se t p
ComputersC −0.61 0.25 −2.44 0.015 −0.39 0.25 −1.54 0.124
Girl 0.14 0.01 9.82 0.000 0.11 0.02 6.05 0.000
Language at home 0.23 0.02 9.91 0.000 0.21 0.03 8.26 0.000
Books at home 0.19 0.01 14.98 0.000 0.19 0.01 14.38 0.000
ComputersC × girl 0.26 0.13 1.96 0.050 0.21 0.11 1.86 0.063
ComputersC × language −0.22 0.27 −0.83 0.407 −0.19 0.24 −0.79 0.430
aggregated data, and when estimated with regression analysis of student-level data with country fixed effects. We also demonstrated that when the country fixed effects were removed from the regression model the effects of home computer use vanished. Simi-larly, it is easy to demonstrate that separate cross-sectional analyses of relations between frequency of computer use at home and reading achievement with aggregated data do not yield any meaningful results. The reason why it is necessary to control for the coun-try effects is that there are fixed councoun-try characteristics that are correlated both with home computer use and with reading achievement, and that introduce bias if not con-trolled for. Computing difference scores at the country level or using country dummies are two different ways to avoid the bias.
This approach thus controls for the effects of country characteristics that remain con-stant over time. However, while countries certainly have many characteristics that can safely be assumed to stay constant over shorter periods of time, many other character-istics change more or less constantly. One way to control for such charactercharacter-istics is to measure them and include the measures in the regression model. In the current study we included a set of indicators of student background characteristics in the models. For the 10YTS data they did not affect the outcome of the analysis, but for the PIRLS data they did reduce the size of the estimated effect of home computer use. The fact that there may be many other time-variant country characteristics that we have not measured prevents us from making strong claims of having established a causal relation between home computer use and reading achievement. Nevertheless, the results obtained with control for fixed country effects are much closer to the actual causal effects than those obtained without such control.
A related question is whether we can assume that the relation between home com-puter use and reading achievement generalizes over time. We found that the size of the estimated effect of computer use at home was smaller in PIRLS than in the 10YTS. While this could be an effect of the PIRLS tests measuring somewhat different aspects of reading literacy than did the 10YTS tests, this explanation does not seem particularly likely given that the PIRLS and 10YTS assessments have been shown to have consid-erable overlap (Gustafsson and Rosén 2006), and that the effects of computer use was relatively consistent across the different reading types represented in the 10YTS.Given the rapid change of technology and society, it seems reasonable to expect that inferences made about effects of computer use have quite limited generalizability across time. For example, the computers that were in use during the time period investigated here were not particularly useful for purposes of reading continuous text, while the current tech-nology, with tablets and high-resolution screens, is more reading-friendly. The results presented here may thus not generalize to the present situation. Even though strong and wide-reaching inferences may not be possible within this area, it does seem important to search for causal relations, both to understand historical changes and as a basis for more general theoretical development.
Thompson 2011). Although clustering on country level seems to be established practice in DiD analyses of data from international comparative studies (see, e.g. Hanushek et al.
2013), further research on the issue of estimating cluster-robust standard errors in such data would be valuable.
One of the potential advantages associated with use of student-level data is that it makes it possible to investigate differential effects as a function of student character-istics. With the 10YTS data an interaction was found between student home language and computer use, and with the PIRLS data an interaction was found between student gender and computer use. While both interaction effects seem reasonable and interpret-able they did not replicate across the two studies. One reason for this may be that the two studies involved quite different samples of countries, which may cause the effects to differ as a function student composition. For example, the language at home variable had twice as strong an effect on reading achievement in the 10YTS as in the PIRLS study, which may influence the interaction effect as well. Thus, even though no clear-cut and replicable interaction effects were found, the possibility to investigate such effects seems to be a very useful addition.
In a previous study, Rosén and Gustafsson (2014) concluded that the negative effects of computer use were best accounted for with a displacement theory, specifying the neg-ative effects of computers to be due to a diminishing amount of time and interest being spent on reading. From the displacement theory follows that the strongest effect would be found on reading of continuous text, which requires skills in both reading speed and reading comprehension, and these skills are developed during extensive practice of read-ing. Both studies showed the strongest effects of computer use on reading of continuous text, and particularly so of narrative, literary, texts, which provides additional support for the displacement theory.
In conclusion, the current study replicates and extends our previous research demon-strating negative effects of home computer use on reading literacy. These findings also are in agreement with results in other studies which have taken advantage of opportuni-ties to implement analytical procedures which guard against threats to valid causal infer-ence, and particularly so the Vigdor et al. (2014) study.
Authors’ information
Monica Rosén is since 2009 Professor of Education at the University of Gothenburg. Her main areas of research concern educational results at individual‑, group‑, and system levels, and factors associated with differences and change in educational outcome. She also share a strong interest for the methodological issues that follows these research interests; educational measurement, educational evaluation and assessment, comparative educational research, and statistical modeling techniques.
Jan‑Eric Gustafsson has since 1986 been Professor of Education at the University of Gothenburg. His substantively oriented research focuses on individual differences in cognitive abilities, and on determinants of educational outcomes at individual and system levels. His methodologically oriented research focuses on conceptual and technical issues of measurement within classical and modern test theory, and on the application of latent variable models to both non‑ nested and nested data.
Received: 21 January 2016 Accepted: 21 January 2016
References
Angrist, J. D., & Pischke, J. S. (2009). Mostly harmless econometrics: An empiricist’s companion. Princeton, NJ: Princeton University Press.
Bugeja, M. J. (2007). Distractions in the wireless classroom. Chronicle of Higher Education,53(21), C1–C4.
Casey, A., Layte, R., Lyons, S., & Silles, M. (2012). Home computer use and academic performance of nine‑year‑olds. Oxford Review of Education,38(5), 617–634.
Elley, W. B. (Ed.). (1994). The IEA study of reading literacy: Achievement and instruction in thirty-two school systems. Oxford: Pergamon Press.
Fairlie, R. W. (2012a). Academic achievement, technology and race: Experimental evidence. Economics of Education Review,31(5), 663–679.
Fairlie, R. W. (2012b). The effects of home access to technology on computer skills: Evidence from a field experiment. Information Economics and Policy,24(3), 243–253.
Fairlie, R. W., & Robinson, J. (2013). Experimental evidence on the effects of home computers on academic achievement among school children. American Economic Journal: Applied Economics,5(3), 211–240.
Fiorini, M. (2010). The effect of home computer use on children’s cognitive and non‑cognitive skills. Economics of Educa-tion Review,29(1), 55–72.
Fraillon, J., Ainley, J., Schulz, W., Friedman, T., & Gebhardt, E. (2014). Preparing for life in a digital age. The IEA international computer and information literacy study international report. New York: Springer.
Fried, C. B. (2008). In‑class laptop use and its effects on student learning. Computers & Education,50(3), 906–914. Fuchs, T., & Wößmann, L. (2004). Computers and student learning: Bivariate and multivariate evidence on the availability
and use of computers at home and at school. Brussels Economic Review,47, 359–385.
Grimes, D., & Warschauer, M. (2008). Learning with laptops: A multi‑method case study. Journal of Educational Computing Research,38(3), 305–332.
Gustafsson, J. E. (2007). Understanding causal influences on educational achievement through analysis of differences over time within countries. In T. Loveless (Ed.), Lessons learned: What international assessments tell us about math achievement (pp. 37–63). Washington, DC: Brookings.
Gustafsson, J. E. (2008). Effects of international comparative studies on educational quality on the quality of educational research. European Educational Research Journal,7(1), 1–17.
Gustafsson, J. E., & Rosén, M. (2006). The dimensional structure of reading assessment tasks in the IEA reading literacy study 1991 and the Progress in International Reading Literacy Study 2001. Educational Research and Evaluation, 12(5), 445–468.
Hanushek, E. A., Link, S., & Woessmann, L. (2013). Does school autonomy make sense everywhere? Panel estimates from PISA. Journal of Development Economics,104, 212–232.
Heckman, J. J., & Robb, R. (1986). Alternative methods for solving the problem of selection bias in evaluating the impact of treatments on outcomes. In H. Wainer (Ed.), Drawing inferences from self- selected samples (pp. 63–113). New York: Springer.
Holcomb, L. B. (2009). Results and lessons learned from 1:1 laptop initiatives: A collective review. TechTrends,53(6), 49–55. Hox, J. (2010). Multilevel analysis: Techniques and applications. London: Routledge.
Hsieh, Y. C., & Chen, K. H. (2011). How different information types affect viewer’s attention on internet advertising. Com-puters in Human Behavior,27(2), 935–945.
Jones, B. S., & Norrander, B. (1996). The reliability of aggregated public opinion measures. American Journal of Political Science,40(1), 295–309.
Junco, R. (2012). In‑class multitasking and academic performance. Computers in Human Behavior,28(6), 2236–2243. Lee, P. S., & Leung, L. (2006). Assessing the displacement effects of the Internet. Telematics and Informatics, 25(3), 145–155. Martin, M. O., Mullis, I. V. S., Gonzalez, E. J., & Kennedy, A. M. (2003). Trends in children’s literacy achievement 1991–2001: IEA’s repeat in nine countries of the 1991 Reading Literacy Study. Chestnut Hill, MA: TIMSS & PIRLS International Study Center, Lynch School of Education, Boston College.
McCoy, B. (2013). Digital distractions in the classroom: Student classroom use of digital devices for non‑class related purposes. Journal of Media Education,4, 5–14.
Mullis, I. V. S. (2007). PIRLS 2006: International report: IEA’s progress in international reading literacy study in primary schools in 40 countries. Chestnut Hill, MA: TIMSS & PIRLS International Study Center, Boston College.
Mullis, I. V., Martin, M. O., Foy, P., & Drucker, K. T. (2012). PIRLS 2011 international results in reading. Chestnut Hill, MA: TIMSS & PIRLS International Study Center, Boston College.
Mullis, I. V. S., Martin, M. O., Gonzalez, E. J., & Kennedy, A. M. (Eds.). (2003). PIRLS 2001 international report: IEA’s study of read-ing achievement in 35 countries. Chestnut Hill, MA: TIMSS & PIRLS International Study Center, Boston College. Muthén, L. K. & Muthén, B. O. (1998–2012). Mplus User’s Guide. Seventh Edition. Los Angeles, CA: Muthén & Muthén. Neuman, S. B. (1995). Literacy in the television age: The myth of the TV effect. Norwood, N.J.: Ablex.
Neuman, S. B. (1988). The displacement effect: Assessing the relation between television viewing and reading perfor‑ mance. Reading Research Quarterly,23(4), 414–440.
OECD. (2015). Students, computers and learning: Making the connection. Paris: OECD Publishing.
Ophir, E., Nass, C., & Wagner, A. D. (2009). Cognitive control in media multitaskers. Proceedings of the National Academy of Sciences,106(37), 15583–15587.
Razel, M. (2001). The complex model of television viewing and educational achievement. The Journal of Educational Research,94(6), 371–379.
Rosén, M., & Gustafsson, J.‑E. (2014). Has the increased access to computers at home caused reading achievement to decrease in Sweden? In R. Strietholt, W. Bos, J.‑E. Gustafsson, & M. Rosén (Eds.), Educational policy evaluation through international comparative assessments. Muenster, New York: Waxmann Verlag.
Sana, F. (2012). Laptop multitasking hinders classroom learning for both users and nearby peers. Computers & Education, 62, 24–31.
Schmidt, M. E., & Vandewater, E. A. (2008). Media and attention, cognition, and school achievement. The Future of children, 18(1), 63–85.
Skolnik, R., & Puzo, M. (2008). Utilization of laptop computers in the school of business classroom. Academy of Educational Leadership Journal,12(2), 1–10.
Subrahmanyam, K., Kraut, R. E., Greenfield, P. M., & Gross, E. F. (2000). The impact of home computer use on children’s activities and development. Children and Computer Technology,10(2), 123–144.
Thompson, S. B. (2011). Simple formulas for standard errors that cluster by both firm and time. Journal of Financial Economics,99(1), 1–10.
Thorndike, R. L. (1973). Reading comprehension education in 15 countries. Stockholm: Almquist & Wiksell.
Vigdor, J. L., Ladd, H. F., & Martinez, E. (2014). Scaling the digital divide: Home computer technology and dtudent achieve‑ ment. Economic Inquiry,52(3), 1103–1119.
Von Davier, M., Gonzalez, E., & Mislevy, R. (2009). What are plausible values and why are they useful. IERI monograph series, 2, 9–36.
Welford, A. T. (1967). Single‑channel operation in the brain. Acta Psychologica,27, 5–22.
Winship, C., & Morgan, S. L. (1999). The estimation of causal effects from observational data. Annual Review of Sociology, 25, 659–706.
Wittwer, J., & Senkbeil, M. (2008). Is students’ computer use at home related to their mathematical performance at school? Computers & Education,50(4), 1558–1571.