R E S E A R C H
Open Access
Sizing the association between lifestyle
behaviours and fatness in a large, heterogeneous
sample of youth of multiple ethnicities from 4
countries
John D Sluyter
1, Robert KR Scragg
2*, Lindsay D Plank
3, Gade D Waqa
4, Kalesita F Fotu
5and Boyd A Swinburn
2,6Abstract
Background:The magnitude of the relationship between lifestyle risk factors for obesity and adiposity is not clear. The aim of this study was to clarify this in order to determine the level of importance of lifestyle factors in obesity aetiology.
Methods:A cross-sectional analysis was carried out on data on youth who were not trying to change weight (n = 5714), aged 12 to 22 years and from 8 ethnic groups living in New Zealand, Australia, Fiji and Tonga.
Demographic and lifestyle data were measured by questionnaires. Fatness was measured by body mass index (BMI), BMI z-score and bioimpedance analysis, which was used to estimate percent body fat and total fat mass (TFM).
Associations between lifestyle and body composition variables were examined using linear regression and forest plots.
Results:TV watching was positively related to fatness in a dose-dependent manner. Strong, dose-dependent
associations were observed between fatness and soft drink consumption (positive relationship), breakfast consumption (inverse relationship) and after-school physical activity (inverse relationship). Breakfast consumption-fatness associations varied in size across ethnic groups. Lifestyle risk factors for obesity were associated with percentage differences in body composition variables that were greatest for TFM and smallest for BMI.
Conclusions:Lifestyle factors were most strongly related to TFM, which suggests that studies that use BMI alone to quantify fatness underestimate the full effect of lifestyle on adiposity. This study clarifies the size of lifestyle-fatness relationships observed in previous studies.
Keywords:Television, Soft drink, Breakfast, Physical activity, Obesity, Meta-analysis
Background
Obesity is a major public health problem [1]. There is a strong rationale for prevention programs targeted at youth because obesity in young people tends to persist into adulthood and adolescence is a key period where lifelong behaviours form [1]. Knowledge of lifestyle de-terminants of obesity is important as lifestyle factors are modifiable and their identification will help to define areas that are suitable for obesity interventions in these populations.
Previous studies and systematic reviews have demon-strated that TV watching, soft drink consumption, breakfast consumption and physical inactivity are risk factors for obesity in children and adolescents [2-7]. However, past studies did not adjust for dieting intention; so, for example, sugary drink-fatness associa-tions may be influenced by the possibility that over-weight individuals are limiting their intake of sugary drinks as a way of controlling their weight. For measure-ment of fatness, most studies have relied on only body mass index (BMI), which has a limited ability to quantify adiposity [8]. Another drawback is that the participants in several studies had a narrow variation in level of fat-ness and/or exposure to lifestyle obesity risk factors. In * Correspondence:[email protected]
2
Epidemiology and Biostatistics, School of Population Health, University of Auckland, Auckland, New Zealand
Full list of author information is available at the end of the article
© 2013 Sluyter et al.; licensee BioMed Central Ltd. This is an open access article distributed under the terms of the Creative Commons Attribution License (http://creativecommons.org/licenses/by/2.0), which permits unrestricted use, distribution, and reproduction in any medium, provided the original work is properly cited.
view of these limitations, it is not clear what the “true” sizes of the relationships between the abovementioned lifestyle factors and adiposity are. Establishing the mag-nitude of these associations is important as it determines the level of importance of lifestyle factors in obesity aeti-ology. Therefore, the aim of the current study was to examine in youth who were not actively trying to lose or gain weight the associations between lifestyle variables and fatness-related body composition variables at the in-dividual level. Our dataset allows us to clarify the size of these relationships by addressing important limitations (particularly those mentioned above) of previous studies.
Methods Participants
The current study is an analysis of the baseline data collected in the Obesity Prevention In Communities (OPIC) study, an obesity intervention study with follow-up that compared changes in fatness between participat-ing intervention and comparison sites in New Zealand, Australia, Fiji and Tonga. The participating sites were: in New Zealand, 7 schools in South Auckland with a high percentage of Pacific Island students; in Australia, 12 schools in East Geelong or the Barwon-South Western region of Victoria; in Fiji, 18 schools in Viti Levu; and, in
Tonga, 4 districts in Tongatapu and Vava’u. The overall
response rate (based on the number of students on the school roll) was 61% (varying from 49% to 74% by country) and a total of 17185 participated [9]. The sampling method of the OPIC study is described in more detail elsewhere [10]. All baseline data were collected between 2005 and 2006.
Ethics approval was obtained from the University of Auckland Human Participants Ethics Committee (in New Zealand), the Deakin University Human Research Ethics Committee (in Australia), National Health Research Council (NHRC) (in Fiji), the Fiji National Research Ethics Review Committee (FNRERC) Ethics Committee (in Fiji) and the Tonga National Health Ethics Research Commit-tee (TNHERC) (in Tonga). All participants gave informed consent.
Measurements
All measurements were carried out by trained staff using a standardised protocol. Height (±0.1 cm) was measured with a stadiometer at maximum inspiration. Impedance
(±1 Ω) and body weight (±0.1 kg) were measured in
light clothing (school uniform) and no socks or stock-ings on a Tanita BC-418 BIA device (Tanita Corp., Tokyo, Japan). BMI was calculated as body weight (kg)/
height (m)2. This was selected as a measure of fatness as
it is widely used in studies of children and adolescents. BMI z-score (BMIz) was derived from World Health Or-ganisation Growth Standards [11]. Total fat mass (TFM)
and percent body fat (%BF) were calculated using equations developed in Pacific Island, Maori, Asian and European adolescents [12].
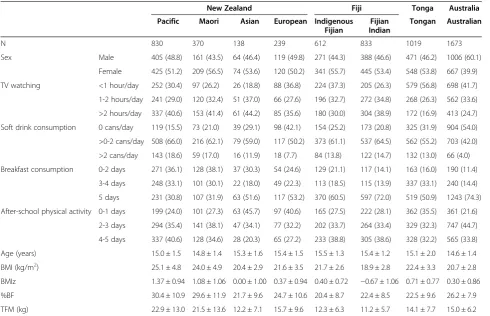
Demographic and lifestyle data were collected via ques-tionnaires administered through hand-held computers (personal digital assistants; PDAs) and via paper. Ethnicity was defined by self-identification. TV watching, soft drink consumption, breakfast consumption and after-school physical activity were selected for inclusion in analyses be-cause studies and systematic reviews show that they are obesity risk factors [2-7,13], successful intervention stud-ies exist [6,14,15], biologically plausible mechanisms can account for causal associations with fatness [2,3,5,13] and there was a large variation in exposure to these lifestyle
factors (Table 1).TV watchingwas assessed by four
ques-tions:“In the last 5 school days, how many days did you
watch TV, videos or DVDs (in your free time)?”,“On the
last school day that you watched TV, videos or DVDs,
how long did you watch for?”, “Last Saturday, how many
hours did you spend watching TV, videos or DVDs?” and
“Last Sunday, how many hours did you spend watching
TV, videos or DVDs?”Average daily TV viewingwas
calcu-lated as ((number of days of watching TV/videos/DVDs out of past 5 school days times the number of hours watched on the last school day) + (total number of hours spent watching TV, videos or DVDs last Saturday and Sunday combined))/7 days. The resulting values (hours per day) were categorised into three groups of approximate tertiles.
Soft drink consumption was assessed by the questions,
“In the last 5 school days (including time spent at home),
on how many days did you have regular (non-diet) soft
drinks?”and“On the last school day, how many glasses or
cans of soft drinks did you have?”For the latter, each glass
and can corresponded to 150 and 300 mL of soft drink, respectively, and the number of cans and corresponding number of glasses were both listed in responses to select
from (for example,“1 small glass/half a can (150 mL)”and
“2 small glasses/1 can (300 mL)”).Average daily soft drink
consumption(cans/day) was calculated as (number of days of soft drink consumption times consumption on the previous day)/5 days. The amounts (cans per day) were categorised into three groups of approximate tertiles.
Frequency of breakfast consumption was assessed with
the question,“In the last 5 school days, on how many days
did you have something to eat for breakfast before school
started?”After-school physical activitywas assessed by the
question, “In the last 5 school days, on how many days
after school, did you do sports, dance, cultural
perfor-mances or play games in which you were active?”As this
may measure training/practice sessions, it may also meas-ure physical activity (sports matches) that occurs on week-ends. For both questions, responses were categorised into three groups of approximate tertiles.
Dieting and attempts to lose weight make it difficult to establish from cross-sectional data the sizes of associa-tions between lifestyle factors and fatness [16]. Weight-loss practice can create: 1) reverse causation (mentioned in Introduction) and, 2) measurement error because the changing lifestyle habits no longer represent the typical lifestyle habits that contributed to the current weight, particularly if the changes occurred recently. For in-stance, if an individual consumed large quantities of soft drinks every day for many years, which contributed to weight gain, but consumption suddenly became low as a result of a recent attempt to reduce weight, the low con-sumption level would no longer represent the previous, long-term pattern of high consumption, thus making it difficult to establish the contribution of consumption to weight gain in the past. This measurement error is sys-tematic because overweight and obese students were more likely to be trying to lose weight than normal-weight students [16]. Restricting analysis to those who were not trying to change weight circumvents these problems: through exclusion of weight-change attempts, it reduces the possibility and influence of reverse caus-ation and reduces systematic measurement error, and
this increases internal validity [17]. Therefore,
weight-change attemptwas assessed by asking each participant
what he/she was doing about their weight. Students
an-swered, “trying to lose weight”, “trying to gain weight”,
“trying to stay at my current weight” or“not doing
any-thing about my weight”. For the analyses, the first two
and last two categories were combined into “change
weight”and“not change weight”categories, respectively.
To provide some adjustment for possible confounding by socio-economic status (SES), Socio-economic Indexes for Areas (SEIFA) scores [18] (based on data collected from the 2001 Australian census) were measured in Australia. No measure of SES was available in the datasets for the remaining three countries. To adjust for potential confounding arising from the possibility that overweight/obese individuals may be less likely to par-ticipate in sports because of fears of being teased [7], students were asked to rate how often other teenagers
teased them (responses ranging from“never” to “almost
always”).
Statistical analysis
In order to correct standard errors for design effects from clustered sampling, SUDAAN (version 10.0) was used for all analyses. Statistical significance was set at P < 0.05. All continuous variables were examined for normality.
Table 1 Characteristics of participants
New Zealand Fiji Tonga Australia Pacific Maori Asian European Indigenous
Fijian
Fijian Indian
Tongan Australian
N 830 370 138 239 612 833 1019 1673
Sex Male 405 (48.8) 161 (43.5) 64 (46.4) 119 (49.8) 271 (44.3) 388 (46.6) 471 (46.2) 1006 (60.1)
Female 425 (51.2) 209 (56.5) 74 (53.6) 120 (50.2) 341 (55.7) 445 (53.4) 548 (53.8) 667 (39.9)
TV watching <1 hour/day 252 (30.4) 97 (26.2) 26 (18.8) 88 (36.8) 224 (37.3) 205 (26.3) 579 (56.8) 698 (41.7)
1-2 hours/day 241 (29.0) 120 (32.4) 51 (37.0) 66 (27.6) 196 (32.7) 272 (34.8) 268 (26.3) 562 (33.6)
>2 hours/day 337 (40.6) 153 (41.4) 61 (44.2) 85 (35.6) 180 (30.0) 304 (38.9) 172 (16.9) 413 (24.7)
Soft drink consumption 0 cans/day 119 (15.5) 73 (21.0) 39 (29.1) 98 (42.1) 154 (25.2) 173 (20.8) 325 (31.9) 904 (54.0)
>0-2 cans/day 508 (66.0) 216 (62.1) 79 (59.0) 117 (50.2) 373 (61.1) 537 (64.5) 562 (55.2) 703 (42.0)
>2 cans/day 143 (18.6) 59 (17.0) 16 (11.9) 18 (7.7) 84 (13.8) 122 (14.7) 132 (13.0) 66 (4.0)
Breakfast consumption 0-2 days 271 (36.1) 128 (38.1) 37 (30.3) 54 (24.6) 129 (21.1) 117 (14.1) 163 (16.0) 190 (11.4)
3-4 days 248 (33.1) 101 (30.1) 22 (18.0) 49 (22.3) 113 (18.5) 115 (13.9) 337 (33.1) 240 (14.4)
5 days 231 (30.8) 107 (31.9) 63 (51.6) 117 (53.2) 370 (60.5) 597 (72.0) 519 (50.9) 1243 (74.3)
After-school physical activity 0-1 days 199 (24.0) 101 (27.3) 63 (45.7) 97 (40.6) 165 (27.5) 222 (28.1) 362 (35.5) 361 (21.6)
2-3 days 294 (35.4) 141 (38.1) 47 (34.1) 77 (32.2) 202 (33.7) 264 (33.4) 329 (32.3) 747 (44.7)
4-5 days 337 (40.6) 128 (34.6) 28 (20.3) 65 (27.2) 233 (38.8) 305 (38.6) 328 (32.2) 565 (33.8)
Age (years) 15.0 ± 1.5 14.8 ± 1.4 15.3 ± 1.6 15.4 ± 1.5 15.5 ± 1.3 15.4 ± 1.2 15.1 ± 2.0 14.6 ± 1.4
BMI (kg/m2) 25.1 ± 4.8 24.0 ± 4.9 20.4 ± 2.9 21.6 ± 3.5 21.7 ± 2.6 18.9 ± 2.8 22.4 ± 3.3 20.7 ± 2.8
BMIz 1.37 ± 0.94 1.08 ± 1.06 0.00 ± 1.00 0.37 ± 0.94 0.40 ± 0.72 −0.67 ± 1.06 0.71 ± 0.77 0.30 ± 0.86
%BF 30.4 ± 10.9 29.6 ± 11.9 21.7 ± 9.6 24.7 ± 10.6 20.4 ± 8.7 22.4 ± 8.5 22.5 ± 9.6 26.2 ± 7.9
TFM (kg) 22.9 ± 13.0 21.5 ± 13.6 12.2 ± 7.1 15.7 ± 9.6 12.3 ± 6.3 11.2 ± 5.7 14.1 ± 7.7 15.0 ± 6.2
BMI = Body mass index; BMIz = BMI z-score; %BF = Percent body fat; TFM = Total fat mass; Values are sample size (column %) or mean ± standard deviation.
Associations between lifestyle and body composition variables were examined by multiple linear regression. All models were adjusted for sex and age. Models for country-specific analyses and for all ethnic groups com-bined were additionally adjusted for ethnicity. Attempts to change weight have been shown to moderate relation-ships between lifestyle variables and fatness [16]. To examine whether this was the case in the current study, an interaction term consisting of the product of lifestyle and weight-change attempt (binary variable comprising
the abovementioned “change weight” and “not change
weight” categories) was added to models, adjusted for
sex, age, ethnicity, lifestyle factor and weight-change at-tempt. If the interaction was found to be significant, all subsequent analyses were restricted to those who were
in the “not change weight” category. The entire OPIC
questionnaire (questions are listed elsewhere [9]) was reviewed to identify potential confounders by examining correlations with fatness and the four lifestyle factors (TV watching, soft drink consumption, breakfast con-sumption and after-school physical activity). Some vari-ables, such as snack food consumption [9], were considered to be mediators [2,3,5,13] in causal lifestyle-fatness pathways and it may not be appropriate to adjust for these. Following this, identified potential
con-founders (SEIFA and teasing, described inMeasurements
section) were initially added to models, but as their in-clusion did not alter effect sizes by at least 10%, they were removed. The Wald F-test was used to assess whether associations were dose-dependent (that is, whether there were stepwise differences in fatness out-comes with stepped differences in exposure).
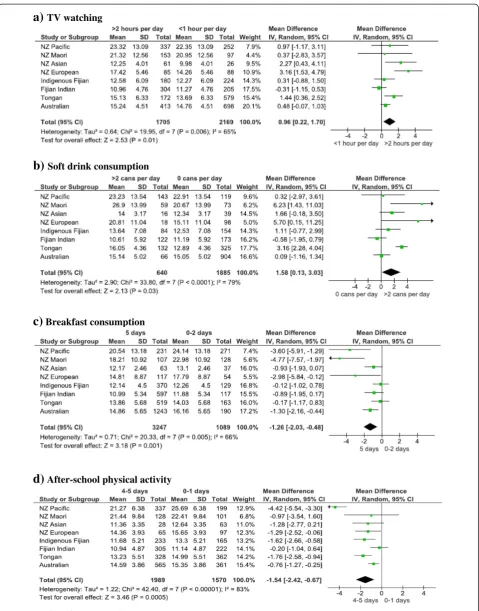
Using Review Manager version 5.0 (Nordic Cochrane Centre, Copenhagen), forest plots were constructed to il-lustrate the associations between the lifestyle and body composition variables. These showed the effect sizes and associated 95% confidence intervals for each ethnic group. Overall estimates of the pooled relation were cal-culated using inverse-variance weighting and with the use of random-effects models.
Results
Sample sizes in each of the lifestyle exposure groups, by weight-control attempt, are provided in Additional file 1. Lifestyle-fatness associations (all ethnic groups com-bined; adjusted for age, sex and ethnicity) among those not trying to change weight differed from corresponding
ones in the “change weight” group with respect to
strength and/or direction. That is, TV watching and soft drink consumption relationships were negative (positive
for the “not change weight” group, as detailed below),
breakfast consumption associations were stronger and after-school physical activity relationships were weaker (Additional file 2). This is reflected in the fact that
weight-change attempt moderated associations between all lifestyle and body composition variables (P-values for interactions ranging from 0.054 to <0.0001).
There-fore, those who were in the “change weight” category
were excluded from all further analyses. Characteristics
of the remaining participants – those who were not
trying to gain or lose weight (n = 5714)– are provided
in Table 1. The sample comprised 8 ethnic groups: Pacific Island, Maori, Asian and European (all four from New Zealand), Australian (from Australia), Tongan (from Tonga) and Indigenous Fijian and Fijian Indian (both from Fiji). Age ranged from 12 to 22 years. Not all participants answered all lifestyle questions so that total sample sizes for each of the lifestyle factors varied slightly.
Dose-related associations between lifestyle and body composition
Dose-related associations of lifestyle variables with body
composition variables – by ethnic group and country,
and among all ethnic groups combined – are shown in
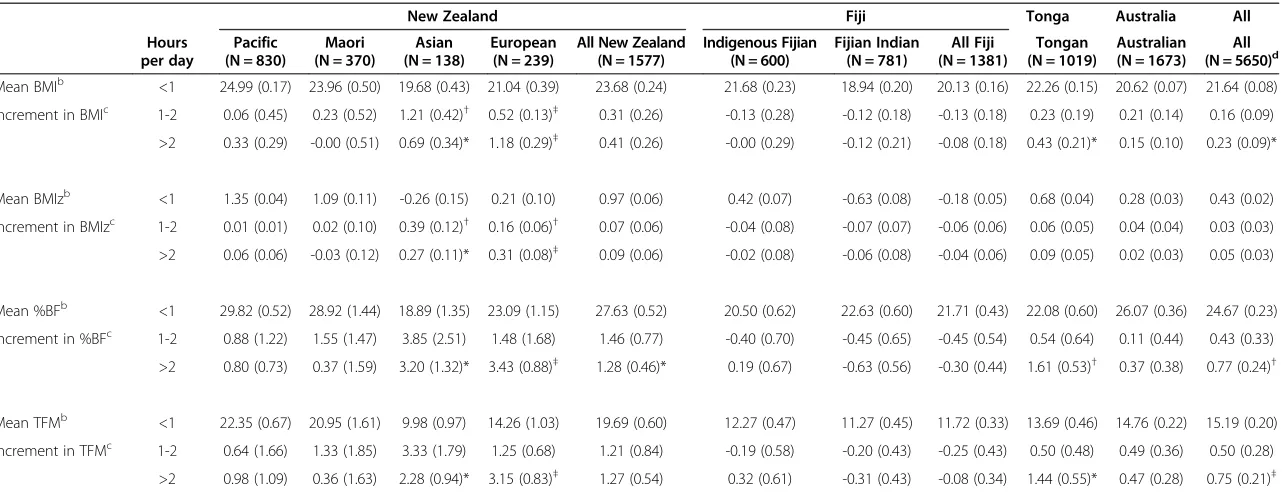
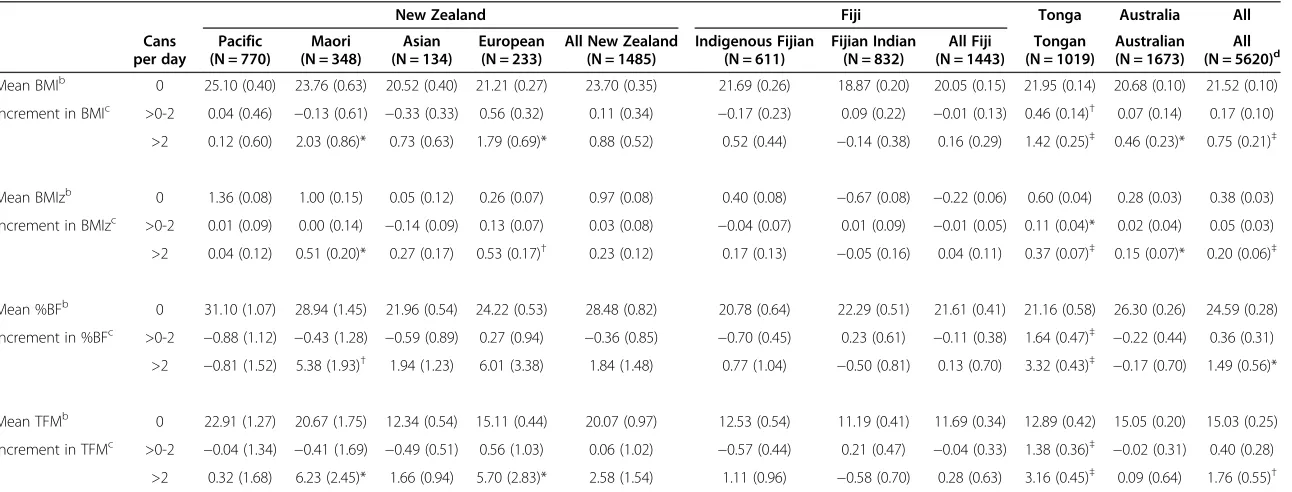
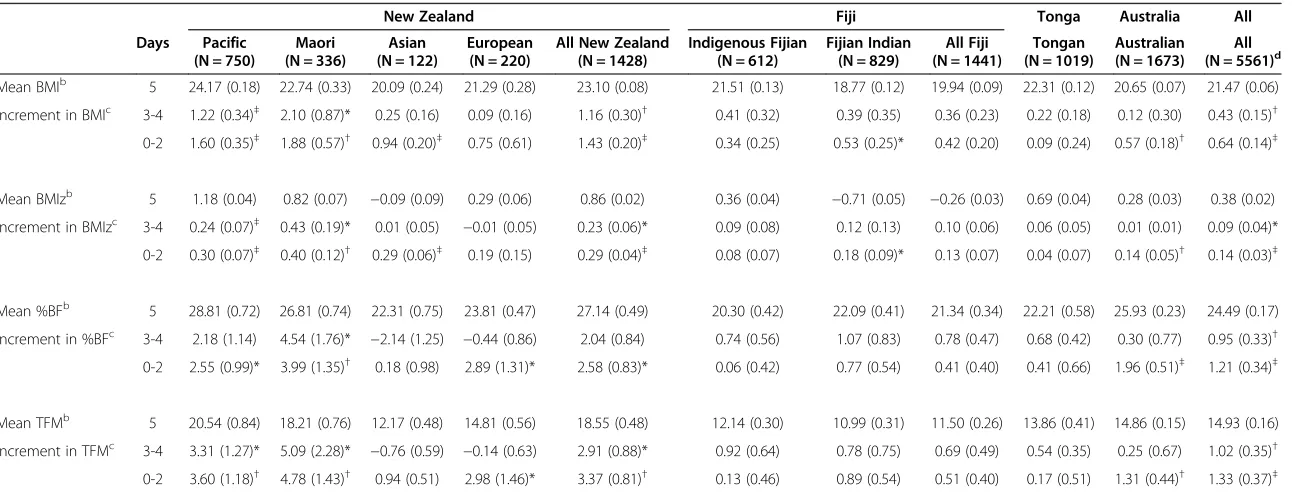
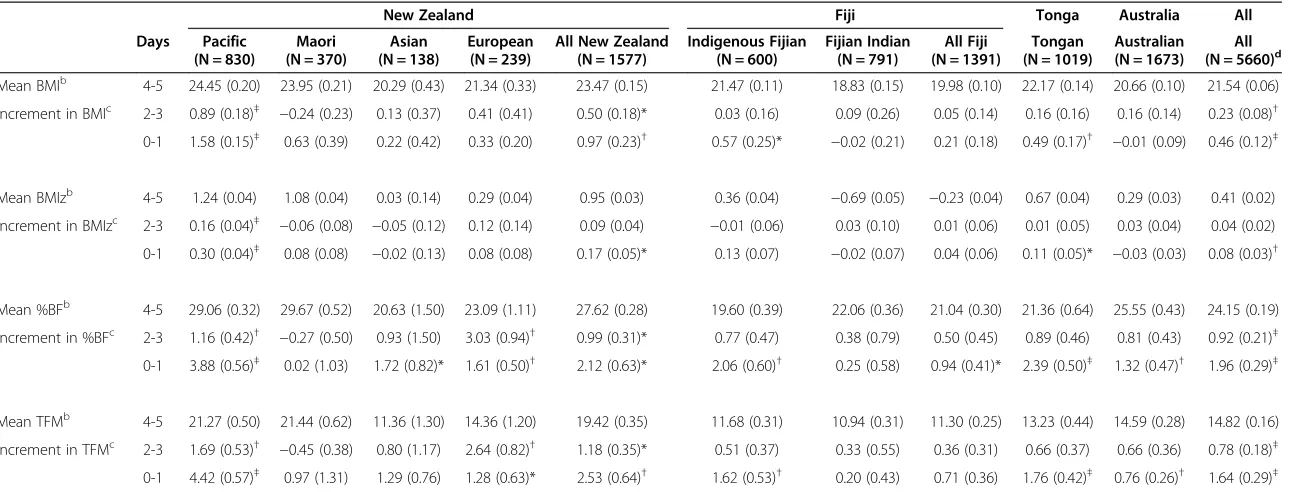
Tables 2, 3, 4 and 5. For TV watching (Table 2), among all ethnic groups combined, BMI, %BF and TFM were higher among those who watched TV for >2 hours per day than among those who watched for <1 hour per day (P = 0.018, 0.0019 and 0.0007, respectively). In addition, there were dose-related effects of increasing BMI, %BF and TFM with increasing TV exposure (P = 0.047, 0.0077 and 0.0031, respectively). Table 3 shows that, among all ethnic groups combined, soft drink consump-tion had positive and dose-dependent associaconsump-tions with body composition variables (P = 0.0022, 0.0029, 0.035 and 0.0091, for BMI, BMIz, %BF and TFM, respectively). For breakfast consumption (Table 4), there were inverse, dose-dependent associations between breakfast con-sumption and body composition variables among all eth-nic groups combined (P = 0.0001, 0.0004, 0.0019 and 0.0024, for BMI, BMIz, %BF and TFM, respectively). Table 5 shows that, among all ethnic groups combined, the relationships between after-school physical activity and body composition variables were inverse and dose-dependent (P = 0.0010, 0.020, <0.0001 and <0.0001, for BMI, BMIz, %BF and TFM respectively).
Consistency of associations across ethnic groups
Table 2 Relationship between TV watching and body composition variablesa
New Zealand Fiji Tonga Australia All
Hours per day
Pacific (N = 830)
Maori (N = 370)
Asian (N = 138)
European (N = 239)
All New Zealand (N = 1577)
Indigenous Fijian (N = 600)
Fijian Indian (N = 781)
All Fiji (N = 1381)
Tongan (N = 1019)
Australian (N = 1673)
All (N = 5650)d
Mean BMIb <1 24.99 (0.17) 23.96 (0.50) 19.68 (0.43) 21.04 (0.39) 23.68 (0.24) 21.68 (0.23) 18.94 (0.20) 20.13 (0.16) 22.26 (0.15) 20.62 (0.07) 21.64 (0.08)
Increment in BMIc 1-2 0.06 (0.45) 0.23 (0.52) 1.21 (0.42)† 0.52 (0.13)‡ 0.31 (0.26) -0.13 (0.28) -0.12 (0.18) -0.13 (0.18) 0.23 (0.19) 0.21 (0.14) 0.16 (0.09)
>2 0.33 (0.29) -0.00 (0.51) 0.69 (0.34)* 1.18 (0.29)‡ 0.41 (0.26) -0.00 (0.29) -0.12 (0.21) -0.08 (0.18) 0.43 (0.21)* 0.15 (0.10) 0.23 (0.09)*
Mean BMIzb <1 1.35 (0.04) 1.09 (0.11) -0.26 (0.15) 0.21 (0.10) 0.97 (0.06) 0.42 (0.07) -0.63 (0.08) -0.18 (0.05) 0.68 (0.04) 0.28 (0.03) 0.43 (0.02)
Increment in BMIzc 1-2 0.01 (0.01) 0.02 (0.10) 0.39 (0.12)† 0.16 (0.06)† 0.07 (0.06) -0.04 (0.08) -0.07 (0.07) -0.06 (0.06) 0.06 (0.05) 0.04 (0.04) 0.03 (0.03)
>2 0.06 (0.06) -0.03 (0.12) 0.27 (0.11)* 0.31 (0.08)‡ 0.09 (0.06) -0.02 (0.08) -0.06 (0.08) -0.04 (0.06) 0.09 (0.05) 0.02 (0.03) 0.05 (0.03)
Mean %BFb <1 29.82 (0.52) 28.92 (1.44) 18.89 (1.35) 23.09 (1.15) 27.63 (0.52) 20.50 (0.62) 22.63 (0.60) 21.71 (0.43) 22.08 (0.60) 26.07 (0.36) 24.67 (0.23)
Increment in %BFc 1-2 0.88 (1.22) 1.55 (1.47) 3.85 (2.51) 1.48 (1.68) 1.46 (0.77) -0.40 (0.70) -0.45 (0.65) -0.45 (0.54) 0.54 (0.64) 0.11 (0.44) 0.43 (0.33)
>2 0.80 (0.73) 0.37 (1.59) 3.20 (1.32)* 3.43 (0.88)‡ 1.28 (0.46)* 0.19 (0.67) -0.63 (0.56) -0.30 (0.44) 1.61 (0.53)† 0.37 (0.38) 0.77 (0.24)†
Mean TFMb <1 22.35 (0.67) 20.95 (1.61) 9.98 (0.97) 14.26 (1.03) 19.69 (0.60) 12.27 (0.47) 11.27 (0.45) 11.72 (0.33) 13.69 (0.46) 14.76 (0.22) 15.19 (0.20)
Increment in TFMc 1-2 0.64 (1.66) 1.33 (1.85) 3.33 (1.79) 1.25 (0.68) 1.21 (0.84) -0.19 (0.58) -0.20 (0.43) -0.25 (0.43) 0.50 (0.48) 0.49 (0.36) 0.50 (0.28)
>2 0.98 (1.09) 0.36 (1.63) 2.28 (0.94)* 3.15 (0.83)‡ 1.27 (0.54) 0.32 (0.61) -0.31 (0.43) -0.08 (0.34) 1.44 (0.55)* 0.47 (0.28) 0.75 (0.21)‡ a
Adjusted for age and sex.“New Zealand All”,“Fiji All”and“All countries”were further adjusted for ethnicity;b
Standard error in parentheses;c
Compared to“<1 hour per day”(reference category). Standard error in parentheses;d
R2
for BMI, BMIz, %BF and TFM models = 0.315, 0.311, 0.243 and 0.227, respectively; BMI = Body mass index (kg/m2
); BMIz = BMI z-score; %BF = Percent body fat (%); TFM = Total fat mass (kg); *P<0.05;†P < 0.01;‡P < 0.001.
Sluyter
et
al.
Internati
onal
Journal
of
Behavioral
Nutrition
and
Physical
Activity
2013,
10
:115
Page
5
o
f
1
4
http://ww
w.ijbnpa.org
/content/1
Table 3 Relationship between average daily soft drink consumption and body composition variablesa
New Zealand Fiji Tonga Australia All
Cans per day
Pacific (N = 770)
Maori (N = 348)
Asian (N = 134)
European (N = 233)
All New Zealand (N = 1485)
Indigenous Fijian (N = 611)
Fijian Indian (N = 832)
All Fiji (N = 1443)
Tongan (N = 1019)
Australian (N = 1673)
All (N = 5620)d
Mean BMIb 0 25.10 (0.40) 23.76 (0.63) 20.52 (0.40) 21.21 (0.27) 23.70 (0.35) 21.69 (0.26) 18.87 (0.20) 20.05 (0.15) 21.95 (0.14) 20.68 (0.10) 21.52 (0.10)
Increment in BMIc >0-2 0.04 (0.46) −0.13 (0.61) −0.33 (0.33) 0.56 (0.32) 0.11 (0.34) −0.17 (0.23) 0.09 (0.22) −0.01 (0.13) 0.46 (0.14)† 0.07 (0.14) 0.17 (0.10)
>2 0.12 (0.60) 2.03 (0.86)* 0.73 (0.63) 1.79 (0.69)* 0.88 (0.52) 0.52 (0.44) −0.14 (0.38) 0.16 (0.29) 1.42 (0.25)‡ 0.46 (0.23)* 0.75 (0.21)‡
Mean BMIzb 0 1.36 (0.08) 1.00 (0.15) 0.05 (0.12) 0.26 (0.07) 0.97 (0.08) 0.40 (0.08) −0.67 (0.08) −0.22 (0.06) 0.60 (0.04) 0.28 (0.03) 0.38 (0.03)
Increment in BMIzc >0-2 0.01 (0.09) 0.00 (0.14) −0.14 (0.09) 0.13 (0.07) 0.03 (0.08) −0.04 (0.07) 0.01 (0.09) −0.01 (0.05) 0.11 (0.04)* 0.02 (0.04) 0.05 (0.03)
>2 0.04 (0.12) 0.51 (0.20)* 0.27 (0.17) 0.53 (0.17)† 0.23 (0.12) 0.17 (0.13) −0.05 (0.16) 0.04 (0.11) 0.37 (0.07)‡ 0.15 (0.07)* 0.20 (0.06)‡
Mean %BFb 0 31.10 (1.07) 28.94 (1.45) 21.96 (0.54) 24.22 (0.53) 28.48 (0.82) 20.78 (0.64) 22.29 (0.51) 21.61 (0.41) 21.16 (0.58) 26.30 (0.26) 24.59 (0.28)
Increment in %BFc >0-2 −0.88 (1.12) −0.43 (1.28) −0.59 (0.89) 0.27 (0.94) −0.36 (0.85) −0.70 (0.45) 0.23 (0.61) −0.11 (0.38) 1.64 (0.47)‡ −0.22 (0.44) 0.36 (0.31)
>2 −0.81 (1.52) 5.38 (1.93)† 1.94 (1.23) 6.01 (3.38) 1.84 (1.48) 0.77 (1.04) −0.50 (0.81) 0.13 (0.70) 3.32 (0.43)‡ −0.17 (0.70) 1.49 (0.56)*
Mean TFMb 0 22.91 (1.27) 20.67 (1.75) 12.34 (0.54) 15.11 (0.44) 20.07 (0.97) 12.53 (0.54) 11.19 (0.41) 11.69 (0.34) 12.89 (0.42) 15.05 (0.20) 15.03 (0.25)
Increment in TFMc >0-2 −0.04 (1.34) −0.41 (1.69) −0.49 (0.51) 0.56 (1.03) 0.06 (1.02) −0.57 (0.44) 0.21 (0.47) −0.04 (0.33) 1.38 (0.36)‡ −0.02 (0.31) 0.40 (0.28)
>2 0.32 (1.68) 6.23 (2.45)* 1.66 (0.94) 5.70 (2.83)* 2.58 (1.54) 1.11 (0.96) −0.58 (0.70) 0.28 (0.63) 3.16 (0.45)‡ 0.09 (0.64) 1.76 (0.55)†
a
Adjusted for age and sex.“New Zealand All”,“Fiji All”and“All countries”were further adjusted for ethnicity;b
Standard error in parentheses;c
Compared to“0 cans per day”(reference category). Standard error in parentheses;d
R2
for BMI, BMIz, %BF and TFM models = 0.312, 0.310, 0.245 and 0.225, respectively; BMI = Body mass index (kg/m2
); BMIz = BMI z-score; %BF = Percent body fat (%); TFM = Total fat mass (kg); *P<0.05;†P <0.01;‡P <0.001.
Sluyter
et
al.
Internati
onal
Journal
of
Behavioral
Nutrition
and
Physical
Activity
2013,
10
:115
Page
6
o
f
1
4
http://ww
w.ijbnpa.org
/content/1
Table 4 Relationship between frequency of breakfast consumption and body composition variablesa
New Zealand Fiji Tonga Australia All
Days Pacific (N = 750)
Maori (N = 336)
Asian (N = 122)
European (N = 220)
All New Zealand (N = 1428)
Indigenous Fijian (N = 612)
Fijian Indian (N = 829)
All Fiji (N = 1441)
Tongan (N = 1019)
Australian (N = 1673)
All (N = 5561)d
Mean BMIb 5 24.17 (0.18) 22.74 (0.33) 20.09 (0.24) 21.29 (0.28) 23.10 (0.08) 21.51 (0.13) 18.77 (0.12) 19.94 (0.09) 22.31 (0.12) 20.65 (0.07) 21.47 (0.06)
Increment in BMIc 3-4 1.22 (0.34)‡ 2.10 (0.87)* 0.25 (0.16) 0.09 (0.16) 1.16 (0.30)† 0.41 (0.32) 0.39 (0.35) 0.36 (0.23) 0.22 (0.18) 0.12 (0.30) 0.43 (0.15)†
0-2 1.60 (0.35)‡ 1.88 (0.57)† 0.94 (0.20)‡ 0.75 (0.61) 1.43 (0.20)‡ 0.34 (0.25) 0.53 (0.25)* 0.42 (0.20) 0.09 (0.24) 0.57 (0.18)† 0.64 (0.14)‡
Mean BMIzb 5 1.18 (0.04) 0.82 (0.07) −0.09 (0.09) 0.29 (0.06) 0.86 (0.02) 0.36 (0.04) −0.71 (0.05) −0.26 (0.03) 0.69 (0.04) 0.28 (0.03) 0.38 (0.02)
Increment in BMIzc 3-4 0.24 (0.07)‡ 0.43 (0.19)* 0.01 (0.05) −0.01 (0.05) 0.23 (0.06)* 0.09 (0.08) 0.12 (0.13) 0.10 (0.06) 0.06 (0.05) 0.01 (0.01) 0.09 (0.04)*
0-2 0.30 (0.07)‡ 0.40 (0.12)† 0.29 (0.06)‡ 0.19 (0.15) 0.29 (0.04)‡ 0.08 (0.07) 0.18 (0.09)* 0.13 (0.07) 0.04 (0.07) 0.14 (0.05)† 0.14 (0.03)‡
Mean %BFb 5 28.81 (0.72) 26.81 (0.74) 22.31 (0.75) 23.81 (0.47) 27.14 (0.49) 20.30 (0.42) 22.09 (0.41) 21.34 (0.34) 22.21 (0.58) 25.93 (0.23) 24.49 (0.17)
Increment in %BFc 3-4 2.18 (1.14) 4.54 (1.76)* −2.14 (1.25) −0.44 (0.86) 2.04 (0.84) 0.74 (0.56) 1.07 (0.83) 0.78 (0.47) 0.68 (0.42) 0.30 (0.77) 0.95 (0.33)†
0-2 2.55 (0.99)* 3.99 (1.35)† 0.18 (0.98) 2.89 (1.31)* 2.58 (0.83)* 0.06 (0.42) 0.77 (0.54) 0.41 (0.40) 0.41 (0.66) 1.96 (0.51)‡ 1.21 (0.34)‡
Mean TFMb 5 20.54 (0.84) 18.21 (0.76) 12.17 (0.48) 14.81 (0.56) 18.55 (0.48) 12.14 (0.30) 10.99 (0.31) 11.50 (0.26) 13.86 (0.41) 14.86 (0.15) 14.93 (0.16)
Increment in TFMc 3-4 3.31 (1.27)* 5.09 (2.28)* −0.76 (0.59) −0.14 (0.63) 2.91 (0.88)* 0.92 (0.64) 0.78 (0.75) 0.69 (0.49) 0.54 (0.35) 0.25 (0.67) 1.02 (0.35)†
0-2 3.60 (1.18)† 4.78 (1.43)† 0.94 (0.51) 2.98 (1.46)* 3.37 (0.81)† 0.13 (0.46) 0.89 (0.54) 0.51 (0.40) 0.17 (0.51) 1.31 (0.44)† 1.33 (0.37)‡ a
Adjusted for age and sex.“New Zealand All”,“Fiji All”and“All countries”were further adjusted for ethnicity;bStandard error in parentheses;cCompared to“5 days”(reference category). Standard error in parentheses;d
R2
for BMI, BMIz, %BF and TFM models = 0.317, 0.311, 0.250 and 0.230, respectively; BMI = Body mass index (kg/m2
); BMIz = BMI z-score; %BF = Percent body fat (%); TFM = Total fat mass (kg); *P<0.05;†P <0.01;‡P <0.001.
Sluyter
et
al.
Internati
onal
Journal
of
Behavioral
Nutrition
and
Physical
Activity
2013,
10
:115
Page
7
o
f
1
4
http://ww
w.ijbnpa.org
/content/1
Table 5 Relationship between after-school physical activity and body composition variablesa
New Zealand Fiji Tonga Australia All
Days Pacific (N = 830)
Maori (N = 370)
Asian (N = 138)
European (N = 239)
All New Zealand (N = 1577)
Indigenous Fijian (N = 600)
Fijian Indian (N = 791)
All Fiji (N = 1391)
Tongan (N = 1019)
Australian (N = 1673)
All (N = 5660)d
Mean BMIb 4-5 24.45 (0.20) 23.95 (0.21) 20.29 (0.43) 21.34 (0.33) 23.47 (0.15) 21.47 (0.11) 18.83 (0.15) 19.98 (0.10) 22.17 (0.14) 20.66 (0.10) 21.54 (0.06)
Increment in BMIc 2-3 0.89 (0.18)‡ −0.24 (0.23) 0.13 (0.37) 0.41 (0.41) 0.50 (0.18)* 0.03 (0.16) 0.09 (0.26) 0.05 (0.14) 0.16 (0.16) 0.16 (0.14) 0.23 (0.08)†
0-1 1.58 (0.15)‡ 0.63 (0.39) 0.22 (0.42) 0.33 (0.20) 0.97 (0.23)† 0.57 (0.25)* −0.02 (0.21) 0.21 (0.18) 0.49 (0.17)† −0.01 (0.09) 0.46 (0.12)‡
Mean BMIzb 4-5 1.24 (0.04) 1.08 (0.04) 0.03 (0.14) 0.29 (0.04) 0.95 (0.03) 0.36 (0.04) −0.69 (0.05) −0.23 (0.04) 0.67 (0.04) 0.29 (0.03) 0.41 (0.02)
Increment in BMIzc 2-3 0.16 (0.04)‡ −0.06 (0.08) −0.05 (0.12) 0.12 (0.14) 0.09 (0.04) −0.01 (0.06) 0.03 (0.10) 0.01 (0.06) 0.01 (0.05) 0.03 (0.04) 0.04 (0.02)
0-1 0.30 (0.04)‡ 0.08 (0.08) −0.02 (0.13) 0.08 (0.08) 0.17 (0.05)* 0.13 (0.07) −0.02 (0.07) 0.04 (0.06) 0.11 (0.05)* −0.03 (0.03) 0.08 (0.03)†
Mean %BFb 4-5 29.06 (0.32) 29.67 (0.52) 20.63 (1.50) 23.09 (1.11) 27.62 (0.28) 19.60 (0.39) 22.06 (0.36) 21.04 (0.30) 21.36 (0.64) 25.55 (0.43) 24.15 (0.19)
Increment in %BFc 2-3 1.16 (0.42)† −0.27 (0.50) 0.93 (1.50) 3.03 (0.94)† 0.99 (0.31)* 0.77 (0.47) 0.38 (0.79) 0.50 (0.45) 0.89 (0.46) 0.81 (0.43) 0.92 (0.21)‡
0-1 3.88 (0.56)‡ 0.02 (1.03) 1.72 (0.82)* 1.61 (0.50)† 2.12 (0.63)* 2.06 (0.60)† 0.25 (0.58) 0.94 (0.41)* 2.39 (0.50)‡ 1.32 (0.47)† 1.96 (0.29)‡
Mean TFMb 4-5 21.27 (0.50) 21.44 (0.62) 11.36 (1.30) 14.36 (1.20) 19.42 (0.35) 11.68 (0.31) 10.94 (0.31) 11.30 (0.25) 13.23 (0.44) 14.59 (0.28) 14.82 (0.16)
Increment in TFMc 2-3 1.69 (0.53)† −0.45 (0.38) 0.80 (1.17) 2.64 (0.82)† 1.18 (0.35)* 0.51 (0.37) 0.33 (0.55) 0.36 (0.31) 0.66 (0.37) 0.66 (0.36) 0.78 (0.18)‡
0-1 4.42 (0.57)‡ 0.97 (1.31) 1.29 (0.76) 1.28 (0.63)* 2.53 (0.64)† 1.62 (0.53)† 0.20 (0.43) 0.71 (0.36) 1.76 (0.42)‡ 0.76 (0.26)† 1.64 (0.29)‡
a
Adjusted for age and sex.“New Zealand All”,“Fiji All”and“All countries”were further adjusted for ethnicity;b
Standard error in parentheses;c
Compared to“4-5 days”(reference category). Standard error in parentheses;d
R2
for BMI, BMIz, %BF and TFM models = 0.317, 0.313, 0.247 and 0.230, respectively; BMI = Body mass index (kg/m2
); BMIz = BMI z-score; %BF = Percent body fat (%); TFM = Total fat mass (kg); *P<0.05;†P <0.01;‡P <0.001.
Sluyter
et
al.
Internati
onal
Journal
of
Behavioral
Nutrition
and
Physical
Activity
2013,
10
:115
Page
8
o
f
1
4
http://ww
w.ijbnpa.org
/content/1
a)
TV watchingb)
Soft drink consumptionc)
Breakfast consumptiond)
After-school physical activityFigure 1(See legend on next page.)
associations were inverse for breakfast consumption and after-school physical activity. Of note, effect sizes for breakfast consumption were largest among New Zealand Pacific and Maori groups.
Variable strength of associations with different body composition variables
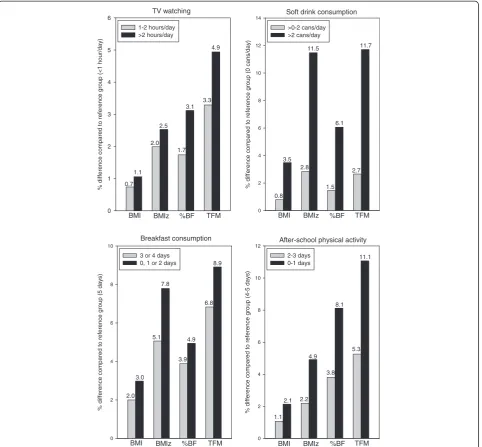
To compare the strength of lifestyle-fatness associations across body composition variables, overall (all ethnic groups combined) differences in BMI, %BF and TFM tabulated in Tables 2, 3, 4 and 5 were expressed as a percentage of mean values in the corresponding refer-ence group category (tabulated) and the resulting values were graphed in Figure 2. This was done for BMIz too, but the differences and reference group mean values used in the calculations were percentiles derived by converting the mean BMIz values across the lifestyle ex-posure groups into percentile values. This transform-ation was applied in order to avoid having denominators
(reference group mean values) that may be≤0 in the
cal-culations when raw z-score values are used. As shown in Figure 2, for all 4 lifestyle variables, differences in life-style exposure groups were associated with percentage differences in body composition variables that were greatest for TFM, followed by either BMIz or %BF and then BMI.
Discussion
This study showed that TV watching was positively re-lated to fatness in a dose-dependent manner. Strong, dose-dependent associations between fatness and soft drink consumption (positive relationship), breakfast con-sumption (inverse relationship) and after-school physical activity (inverse relationship) were observed. These asso-ciations were independent of ethnicity, sex and age. Along with their effect sizes, a highlight of our study was that differences in lifestyle obesity risk factors were associated with percentage differences in body compos-ition variables that were greatest for TFM, followed by either BMIz or %BF and then BMI.
The positive TV watching- and soft drink-fatness asso-ciations and the inverse breakfast consumption- and physical activity-fatness relationships we observed have previously been reported in studies carried out inter-nationally [2-7]. However, our study differs from those
studies in that we adjusted for dieting intention and quantified %BF and TFM.
Of particular interest was the size of the associations. In the present study, compared to the low-exposure cat-egories, BMI in the high-exposure categories was
be-tween 0.23 and 0.75 kg/m2higher (Tables 2, 3, 4 and 5)
or between 1.1 to 3.5% higher (Figure 2). These effect sizes are larger than those reported in meta-analyses and several previous studies [2,3,5]. This difference may
re-flect strengths of our study (discussed below) – in
par-ticular, the large variation in fatness level and exposure to lifestyle factors (Table 1), together with accounting for dieting intention in analyses.
Change in the level of exposure to lifestyle obesity risk factors, such as an increase in soft drink consumption, alters fat stores through change in energy intake or ex-penditure. BMIz, %BF and, in particular, BMI have a lim-ited ability to reflect these changes in body composition as they are influenced by total fat-free mass. In addition,
increases in TFM will be ‘underestimated’ by the
changes in %BF since the latter is based on the ratio of TFM and body weight, both of which increase with in-creasing TFM. Consistent with this, the present study showed that lifestyle variables were most strongly related to TFM and had weaker associations with BMIz, %BF and BMI. To our knowledge, this is the first study to show this in children and adolescents; the relative strength of associations of these four body composition variables with lifestyle factors has not been formally assessed by previous work.
Across ethnic groups, TV watching and soft drink con-sumption associations were consistently positive, while the breakfast consumption and after-school physical ac-tivity associations were consistently inverse. TV watching relationships were dose-dependent, while soft drink con-sumption, breakfast consumption and after-school physical activity relationships were strong plus dose-dependent. Of note, associations were especially strong for soft drink consumption and after-school physical activity, with TFM percentage differences between highest and lowest exposure categories exceeding 11% (Figure 2). In the light of suc-cessful intervention studies [6,14,15], the consistent, strong and dose-dependent nature of these associations gives evidence that they may well be causal.
In the Pacific region (defined in this paper as Australia, New Zealand and other Pacific Island coun-tries), the prevalence of obesity is among the highest in (See figure on previous page.)
Figure 1Forest plots of relationships between lifestyle variables and total fat mass (adjusted for age and sex). a)TV watching (<1 hour/ day versus >2 hours/day),b)Soft drink consumption (0 cans/day versus >2 cans/day),c)Breakfast consumption (5 days versus 0, 1 or 2 days), d)After-school physical activity (4–5 days versus 0–1 days). NZ = New Zealand.
the world [19]. Due to the geographical location of our par-ticipants, this study has the ability to provide particularly relevant evidence for youth in the Pacific region. Previous studies similar to ours have a limited ability to do so, espe-cially since they were small, used BMI alone as a fatness measure, did not adjust for dieting intention or studied mainly primary-school aged children [16,18,20-44]. Given that our study addressed these drawbacks, it provides stron-ger evidence of whether lifestyle factors contribute to obes-ity in Pacific region youth. In addition, our study defines a type of physical activity (after-school physical activity) that is predictive of fatness, which is important because this
helps to specify an appropriate physical activity intervention target. Few studies have done this [18,41]; nearly all have
measured overall physical activity (such as daily step
counts) instead.
This study has a unique ability to explain ethnic dis-parities in fatness levels that exist among adolescents in the Pacific region (Table 1, [9]). Of note, fatness levels are especially high among New Zealand Pacific Island and Maori youth (Table 1, [9]), indicating a need for obesity interventions targeted at these groups. These dis-parities are partly due to the fact that high TV watching, high soft drink consumption and breakfast skipping are
TV watching
% dif
fe
rence compared t
o
ref
e
rence group (<
1 hour /day ) 0 1 2 3 4 5 6 1-2 hours/day >2 hours/day
BMI %BF TFM
0.7 1.1 1.7 3.1 3.3 4.9 BMIz 2.5 2.0
Soft drink consumption
% dif ferenc e c o mpared to re fe re nce gr oup (0 cans/day ) 0 2 4 6 8 10 12 14 >0-2 cans/day >2 cans/day
BMI %BF TFM
0.8 3.5 1.5 6.1 2.7 11.7 BMIz 2.8 11.5 Breakfast consumption % dif ference compa red to ref e re nc e grou p (5 day s ) 0 2 4 6 8 10
3 or 4 days 0, 1 or 2 days
BMI %BF TFM
2.0 3.0 3.9 4.9 6.8 8.9 BMIz 5.1 7.8
After-school physical activity
% dif ference compar e d t o r e fe rence group (4 -5 day s ) 0 2 4 6 8 10 12 2-3 days 0-1 days %BF TFM 1.1 2.1 3.8 8.1 5.3 11.1 BMI BMIz 2.2 4.9
Figure 2Relationship between lifestyle and body composition variables (as a % of mean values of reference group from Tables 2, 3, 4, 5) in all ethnic groups combined.BMI = Body mass index; BMIz = BMI z-score (values are derived from transforming mean BMIz values from regression analyses into percentiles); %BF = Percent body fat; TFM = Total fat mass.
more prevalent in these groups (Table 1, [9]). Breakfast skipping is a particularly important explanation as its as-sociation with fatness is strongest in these groups (Table 4 and Figure 1). This may be attributed to ethnic differences in factors that determine the level of con-sumption of unhealthy (energy-dense) food outside of
home –a plausible mediator in the breakfast
skipping-fatness association. These factors include: 1) healthiness and accessibility of school food options outside of home (in school canteens and shops) and, 2) spending money allocated for school food purchase.
This study is the largest that we are aware of carried out in children and adolescents in the Pacific region [16,18,20-44] and larger than most of those performed outside the Pacific region [2-4,7]. Other study strengths are that physical measurements were objectively measured (not self-reported), the use of validated %BF and TFM measures, the large variation in fatness level and exposure to lifestyle factors (Table 1), and the ethnically and geographically diverse nature of the sample. Furthermore, serving size was included in the assessment of soft drink consumption; this is often not the case [3]. Finally, the large number of sub-samples (8 ethnic groups) and homogenous mea-surements across these facilitated assessment of consistency of associations. Studies that have examined consistency have utilised fewer sub-groups or have pooled together re-sults of different studies with heterogenous measurements.
A limitation of this study is error inherent in the measurement of the lifestyle variables. Random
meas-urement error associated with the lifestyle variables –
resulting from day-to-day variation in lifestyle habits and
imperfect memory to recall these–would weaken
asso-ciations. Therefore, the associations may well be stron-ger than we observed. Being cross-sectional, this study is unable to rule out the possibility of reverse causation. However, this possibility and any influence of reverse causation were reduced for some reasons. Firstly, ana-lysis was restricted to those who said they were not try-ing to change weight, so the trigger for reverse causality (trying to lose weight) would have been minimal. Sec-ondly, lifestyle factors were most strongly related to TFM, followed by %BF and then BMI, and this hierarch-ical pattern would fit a forward causation (changes in energy intake or expenditure leading to changes in TFM, as discussed above) but a reverse-causation mechanism would be unlikely to produce this hierarchy of strength of relationships. In addition, if reverse causation did ac-count for the relationships between physical activity and fatness, fear of being teased may act as a mediator [7]. However, when a measure of this mediator was adjusted for, the physical activity-fatness associations remained significant (data not shown), which gives some evidence to suggest that reverse causation did not fully explain these associations.
The fact that analysis was largely restricted to those who were not trying to change weight would have lim-ited the ability to extrapolate findings to those trying to change weight. Because of the improvement in internal
validity it provided (as discussed in Measurements),
given that a notable fraction of participants were trying to change weight (Additional file 1), this restriction was
considered to be–by us and Rothman et al.[17]–
im-portant and justifiable. However, our findings have at
least some applicability to the“change weight”group
be-cause individuals from this group probably would have previously made no attempts to change weight, which is supported from epidemiological evidence that weight-control attempts are less prevalent in childhood than in adolescence [45]. In other words, our results suggest that lifestyle factors may well have contributed to weight gain of individuals before they tried to change weight.
With regard to SES confounding, the participants were recruited from schools with similar SES and there was low variation in personal SES in the areas sampled from in New Zealand [16]. Further, in Australia, analyses showed that inclusion of SEIFA scores in statistical models did not alter our conclusions (data not shown). These factors re-duce the possibility of confounding by SES.
We did not measure pubertal status, which may have been a covariate worth controlling for in statistical models. However, maturational stage is correlated with age and sex, and may have varied with ethnicity in our dataset [46]. Thus, at least some adjustment for puberty would have been provided through the inclusion of age, sex and ethnicity in models. Further, any correlation be-tween pubertal stage and lifestyle factors might be medi-ated by weight-control attempt [47], but we accounted for the latter in the analyses.
The self-reported nature of the lifestyle data collection raises the possibility of there being social desirability bias associated with the measurement of the lifestyle variables. For instance, obese adolescents may have under-reported their intake of soft drinks because of their unhealthy con-notation. However, any influence on the results from this source of error was minimised by indicating to the stu-dents that all collected data were confidential and having each student answer survey questions alone.
Conclusions
was most common and had the strongest relationship with fatness in New Zealand Pacific and Maori groups. Interven-tion studies are required to determine effective ways of car-rying out these recommendations. Lifestyle factors have the strongest association with TFM and the weakest relationship with BMI, which reflects the limited usefulness of the latter as a measure of TFM. This suggests that obesity interven-tions and studies that use BMI alone to quantify fatness underestimate the full effect of lifestyle factors on adiposity. This is of great significance because BMI is widely used to measure body fat. For example, conclusions made by many studies on the effectiveness of obesity interventions [48] and by lifestyle-fatness meta-analyses on effect sizes [3,5,49,50] are based on the use of BMI as a fatness measure.
Additional files
Additional file 1:Lifestyle characteristics of all participants by weight-control attempt.Sample numbers in lifestyle exposure categories stratified by weight-control attempt.
Additional file 2:Relationships between lifestyle and body composition variables (adjusted for age, sex and ethnicity) by weight-control attempt and among all participants.Graphs of lifestyle-fatness associations.
Abbreviations
BMI:Body mass index; BMIz: Body mass index z-score; %BF: Percent body fat; TFM: Total fat mass; SES: Socio-economic status; OPIC: Obesity prevention in communities; SEIFA: Socio-economic indexes for areas.
Competing interests
The authors declare that they have no competing interests.
Authors’contributions
JS acquired data for the OPIC study, contributed to the conception of the manuscript research questions, performed all statistical analyses and drafted the manuscript. RS contributed to study conception and design, acquired data, contributed to the conception of the manuscript research questions and the interpretation of findings, provided advice for statistical analysis and critically reviewed the manuscript. LP participated in the interpretation of findings and critically reviewed the manuscript. Both GW and KF collected data and participated in critical revision of the manuscript. BS contributed to study conception and design, contributed to the interpretation of findings and critically reviewed the manuscript. All authors read and approved the final manuscript.
Acknowledgements
This study was funded by the Health Research Council of New Zealand (HRC; New Zealand), Wellcome Trust (UK) and the National Health and Medical Research Council of Australia (Australia). The authors gratefully acknowledge the numerous people who were involved in the OPIC project, including co-investigators, other staff and postgraduate students, partner organisations, and particularly the schools, students, parents and communities. JS was supported by the NZ Ministry of Health and HRC.
Author details
1Pacific Health, School of Population Health, University of Auckland, Auckland, New Zealand.2Epidemiology and Biostatistics, School of Population Health, University of Auckland, Auckland, New Zealand. 3
Department of Surgery, School of Medicine, University of Auckland, Auckland, New Zealand.4Fiji School of Medicine, College of Medicine, Nursing and Health Sciences, Fiji National University, Suva, Fiji.5Tonga Health Systems Support Program, Ministry of Health, Nuku’alofa, Tonga.6WHO Collaborating Centre for Obesity Prevention, Deakin University, Melbourne, Australia.
Received: 12 February 2013 Accepted: 19 September 2013 Published: 12 October 2013
References
1. Lobstein T, Baur L, Uauy R:Obesity in children and young people: a crisis in public health.Obesity Rev2004,5:4–104.
2. Swinburn B, Shelly A:Effects of TV time and other sedentary pursuits.
Int J Obes2008,32(Suppl 7):S132–136.
3. Vartanian LR, Schwartz MB, Brownell KD:Effects of soft drink consumption on nutrition and health: a systematic review and meta-analysis.
Am J Public Health2007,97:667–675.
4. Rampersaud GC, Pereira MA, Girard BL, Adams J, Metzl JD:Breakfast habits, nutritional status, body weight, and academic performance in children and adolescents.J Am Diet Assoc2005,105:743–760.
5. Marshall SJ, Biddle SJH, Gorely T, Cameron N, Murdey I:Relationships between media use, body fatness and physical activity in children and youth: a meta-analysis.Int J Obes2004,28:1238–1246.
6. Atlantis E, Barnes EH, Singh MAF:Efficacy of exercise for treating overweight in children and adolescents: a systematic review.Int J Obes
2006,30:1027–1040.
7. Must A, Tybor DJ:Physical activity and sedentary behavior: a review of longitudinal studies of weight and adiposity in youth.Int J Obes2005, 29(Suppl 2):S84–96.
8. Sluyter JD, Schaaf D, Scragg RKR, Plank LD:Body mass index and percent body fat in a New Zealand multi-ethnic adolescent population.
Int J Pediatr Obes2011,6:36–44.
9. Utter J, Faeamani G, Malakellis M, Vanualailai N, Kremer P, Scragg R, Swinburn B:Lifestyle and obesity in South Pacific youth: Baseline results from the Pacific Obesity Prevention In Communities (OPIC) Project in New Zealand, Fiji, Tonga and Australia.Auckland: University of Auckland; 2008. 10. Swinburn BA, Millar L, Utter J, Kremer P, Moodie M, Mavoa H, Snowdon W,
McCabe MP, Malakellis M, de Courten M, Waqa G, Fotu KF, Roberts G, Scragg R:The pacific obesity prevention in communities project: project overview and methods.Obesity Rev2011,12(Suppl 2):3–11.
11. de Onis M, Onyango AW, Borghi E, Siyam A, Nishida C, Siekmann J: Development of a WHO growth reference for school-aged children and adolescents.Bull World Health Organ2007,85:660–667.
12. Sluyter JD, Schaaf D, Scragg RKR, Plank LD:Prediction of fatness by standing 8-electrode bioimpedance: a multiethnic adolescent population.Obesity2010,18:183–189.
13. de La Hunty A, Gibson S, Ashwell M:Does regular breakfast cereal consumption help children and adolescents stay slimmer? A systematic review and meta-analysis.Obes Facts2013,6:70–85.
14. Robinson TN:Reducing children’s television viewing to prevent obesity: a randomized controlled trial.JAMA1999,282:1561–1567.
15. James J, Thomas P, Cavan D, Kerr D:Preventing childhood obesity by reducing consumption of carbonated drinks: cluster randomised controlled trial.BMJ2004,328:1237–1239.
16. Utter J, Scragg R, Ni Mhurchu C, Schaaf D:What effect do attempts to lose weight have on the observed relationship between nutrition behaviors and body mass index among adolescents?Int J Behav Nutr Phys Act2007,4:40. 17. Rothman KJ, Greenland S, Lash TL:Modern Epidemiology.3rd edition.
Philadelphia: Lippincott Williams & Wilkins; 2008:146–147. 129. 18. Salmon J, Timpero A, Cleland V, Venn A:Trends in children’s physical
activity and weight status in high and low socio-economic status areas of Melbourne, Victoria, 1985–2001.Aust N Z J Public Health2005, 29:337–342.
19. Hodge AM, Dowse GK, Zimmet PZ, Collins VR:Prevalence and secular trends in obesity in Pacific and Indian Ocean island populations.Obes Res1995,3(Suppl 2):77s–87s.
20. Burke V, Beilin LJ, Simmer K, Oddy WH, Blake KV, Doherty D, Kendall GE, Newnham JP, Landau LI, Stanley FJ:Predictors of body mass index and associations with cardiovascular risk factors in Australian children: a prospective cohort study.Int J Obes2005,29:15–23.
21. Wake M, Hesketh K, Waters E:Television, computer use and body mass index in Australian primary school children.J Paediatr Child Health2003, 39:130–134.
22. Utter J, Scragg R, Schaaf D, Fitzgerald E, Wilson N:Correlates of body mass index among a nationally representative sample of New Zealand children.Int J Pediatr Obes2007,2:104–113.
23. Utter J, Scragg R, Schaaf D:Associations between television viewing and consumption of commonly advertised foods among New Zealand children and young adolescents.Public Health Nutr2006,9:606–612. 24. Oliver M, Schluter PJ, Rush E, Schofield GM, Paterson J:Physical activity,
sedentariness, and body fatness in a sample of 6-year-old Pacific children.Int J Pediatr Obes2011,6:e565–573.
25. Hancox RJ, Poulton R:Watching television is associated with childhood obesity: but is it clinically important?Int J Obes2006,30:171–175. 26. Hancox RJ, Milne BJ, Poulton R:Association between child and adolescent
television viewing and adult health: a longitudinal birth cohort study.
Lancet2004,364:257–262.
27. Blair NJ, Thompson JMD, Black PN, Becroft DMO, Clark PM, Han DY, Robinson E, Waldie KE, Wild CJ, Mitchell EA:Risk factors for obesity in 7-year-old European children: the Auckland birthweight collaborative study.Arch Dis Child2007,92:866–871.
28. Tam CS, Garnett SP, Cowell CT, Campbell K, Cabrera G, Baur LA:Soft drink consumption and excess weight gain in Australian school students: results from the Nepean study.Int J Obes2006,30:1091–1093. 29. Duncan JS, Schofield G, Duncan EK, Rush EC:Risk factors for excess body
fatness in New Zealand children.Asia Pacific J Clin Nutr2008,17:138–147. 30. Thompson-McCormick JJ, Thomas JJ, Bainivualiku A, Khan AN, Becker AE:
Breakfast skipping as a risk correlate of overweight and obesity in school-going ethnic Fijian adolescent girls.Asia Pacific J Clin Nutr2010, 19:372–382.
31. Milligan RAK, Burke V, Beilin LJ, Dunbar DL, Spencer MJ, Balde E, Gracey MP: Influence of gender and socio-economic status on dietary patterns and nutrient intakes in 18-year-old Australians.Aust N Z J Public Health1998, 22:485–493.
32. Utter J, Scragg R, Mhurchu CN, Schaaf D:At-home breakfast consumption among New Zealand children: associations with body mass index and related nutrition behaviors.J Am Diet Assoc2007,107:570–576. 33. Olds TS, Ferrar KE, Schranz NK, Maher CA:Obese adolescents are less
active than their normal-weight peers, but wherein lies the difference?
J Adolesc Health2011,48:189–195.
34. Vincent SD, Pangrazi RP, Raustorp A, Tomson LM, Cuddihy TF:Activity levels and body mass index of children in the United States, Sweden, and Australia.Med Sci Sports Exerc2003,35:1367–1373.
35. Abbott RA, Davies PSW:Habitual physical activity and physical activity intensity: their relation to body composition in 5.0-10.5-y-old children.
Eur J Clin Nutr2004,58:285–291.
36. Ziviani J, Macdonald D, Ward H, Jenkins D, Rodger S:Physical activity of young children: a two-year follow-up.Phys Occup Ther Pediatr2008, 28:25–39.
37. Cuddihy T, Michaud-Tomson L, Jones EK, Johnston AO:Exploring the relationship between daily steps, body mass index and physical self-esteem in female Australian adolescents.J Exerc Sci Fit2006,4:25–35. 38. Hands B, Parker H:Pedometer-determined physical activity, BMI, and waist girth in 7- To 16-year-old children and adolescents.J Phys Act Health2008,5(Suppl 1)S153–165.
39. Dwyer T, Coonan WE, Leitch DR, Hetzel BS, Baghurst RA:An investigation of the effects of daily physical activity on the health of primary school students in South Australia.Int J Epidemiol1983,12:308–313. 40. Smith BJ, Phongsavan P, Havea D, Halavatau V, Chey T:Body mass index,
physical activity and dietary behaviours among adolescents in the Kingdom of Tonga.Public Health Nutr2007,10:137–144.
41. Teevale T, Thomas DR, Scragg R, Faeamani G, Nosa V:The role of sociocultural factors in obesity aetiology in Pacific adolescents and their parents: a mixed-methods study in Auckland, New Zealand.N Z Med J
2010,123:1–11.
42. Duncan JS, Schofield G, Duncan EK:Pedometer-determined physical activity and body composition in New Zealand children.Med Sci Sports Exerc2006,38:1402–1409.
43. Duncan JS, Schofield G, Duncan EK:Step count recommendations for children based on body fat.Prev Med2007,44:42–44.
44. Taylor R, McAuley K, Williams S, Barbezat W, Nielsen G, Mann J:Reducing weight gain in children through enhancing physical activity and nutrition: the APPLE project.Int J Pediatr Obes2006,1:146–152. 45. Duncan JS, Duncan EK, Schofield G:Associations between weight
perceptions, weight control and body fatness in a multiethnic sample of adolescent girls.Public Health Nutr2011,14:93–100.
46. Ministry of Health:NZ Food: NZ Children. Key results of the 2002 National Children’s Nutrition Survey.Wellington (NZ): Ministry of Health; 2003. 47. Simon AE, Wardle J, Jarvis MJ, Steggles N, Cartwright M:Examining the
relationship between pubertal stage, adolescent health behaviours and stress.Psychol Med2003,33:1369–1379.
48. Oude Luttikhuis H, Baur L, Jansen H, Shrewsbury VA, O’Malley C, Stolk RP, Summerbell CD:Interventions for treating obesity in children.Cochrane Database Syst Rev2009,1:CD001872.
49. Forshee RA, Anderson PA, Storey ML:Sugar-sweetened beverages and body mass index in children and adolescents: a meta-analysis.Am J Clin Nutr2008,87:1662–1671.
50. Harris KC, Kuramoto LK, Schulzer M, Retallack JE:Effect of school-based physical activity interventions on body mass index in children: a meta-analysis.CMAJ2009,180:719–726.
doi:10.1186/1479-5868-10-115
Cite this article as:Sluyteret al.:Sizing the association between lifestyle behaviours and fatness in a large, heterogeneous sample of youth of multiple ethnicities from 4 countries.International Journal of Behavioral
Nutrition and Physical Activity201310:115.
Submit your next manuscript to BioMed Central and take full advantage of:
• Convenient online submission
• Thorough peer review
• No space constraints or color figure charges
• Immediate publication on acceptance
• Inclusion in PubMed, CAS, Scopus and Google Scholar
• Research which is freely available for redistribution
Submit your manuscript at www.biomedcentral.com/submit