R E S E A R C H
Open Access
National youth sedentary behavior and
physical activity daily patterns using latent
class analysis applied to accelerometry
Kelly R. Evenson
1*, Fang Wen
2, Derek Hales
3and Amy H. Herring
4Abstract
Background:Applying latent class analysis (LCA) to accelerometry can help elucidated underlying patterns. This study described the patterns of accelerometer-determined sedentary behavior and physical activity among youth by applying LCA to a nationally representative United States (US) sample.
Methods:Using 2003–2006 National Health and Nutrition Examination Survey data, 3998 youths 6–17 years wore an ActiGraph 7164 accelerometer for one week, providing > =3 days of wear for > =8 h/day from 6:00 am-midnight. Cutpoints defined sedentary behavior (<100 counts/minute), light activity (100–2295 counts/minute), moderate to vigorous physical activity (MVPA; > = 2296 counts/minute), and vigorous activity (> = 4012 counts/minute). To account for wear time differences, outcomes were expressed as percent of day in a given intensity. LCA was used to classify daily (Monday through Sunday) patterns of average counts/minute, sedentary behavior, light activity, MVPA, and vigorous activity separately. The latent classes were explored overall and by age (6–11, 12–14, 15–17 years), gender, and whether or not youth attended school during measurement. Estimates were weighted to account for the sampling frame.
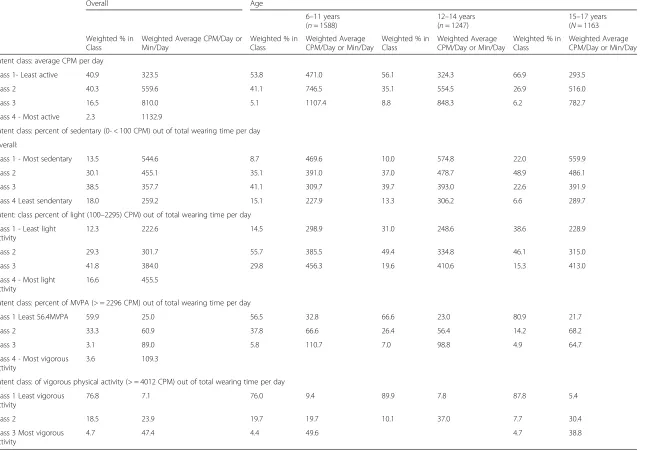
Results:For average counts/minute/day, four classes emerged from least to most active: 40.9 % of population (mean 323.5 counts/minute/day), 40.3 % (559.6 counts/minute/day), 16.5 % (810.0 counts/minute/day), and 2.3 % (1132.9 counts/minute/day). For percent of sedentary behavior, four classes emerged: 13.5 % of population (mean 544.6 min/day), 30.1 % (455.1 min/day), 38.5 % (357.7 min/day), and 18.0 % (259.2 min/day). For percent of light activity, four classes emerged: 12.3 % of population (mean 222.6 min/day), 29.3 % (301.7 min/day), 41.8 % (384.0 min/day), and 16.6 % (455.5 min/day). For percent of MVPA, four classes emerged: 59.9 % of population (mean 25.0 min/day), 33.3 % (60.9 min/day), 3.1 % (89.0 min/day), and 3.6 % (109.3 min/day). For percent of vigorous activity, three classes emerged: 76.8 % of population (mean 7.1 min/day), 18.5 % (23.9 min/day), and 4.7 % (47.4 min/day). Classes were developed by age, gender, and school attendance since some patterns differed when stratifying by these factors.
Conclusion:The models supported patterns for average intensity, sedentary behavior, light activity, MVPA, and vigorous activity. These latent class derived patterns can be used in other youth studies to explore correlates or outcomes and to target sedentary behavior or physical activity interventions.
Keywords:Accelerometry, Children, Cluster analysis, Latent class analysis, Surveillance
* Correspondence:[email protected]
1Department of Epidemiology at the Gillings School of Global Public Health, Center for Health Promotion and Disease Prevention, University of North Carolina, 137 East Franklin Street, Suite 306, Chapel Hill, NC 27514, USA Full list of author information is available at the end of the article
© 2016 Evenson et al.Open AccessThis article is distributed under the terms of the Creative Commons Attribution 4.0 International License (http://creativecommons.org/licenses/by/4.0/), which permits unrestricted use, distribution, and reproduction in any medium, provided you give appropriate credit to the original author(s) and the source, provide a link to the Creative Commons license, and indicate if changes were made. The Creative Commons Public Domain Dedication waiver (http://creativecommons.org/publicdomain/zero/1.0/) applies to the data made available in this article, unless otherwise stated.
Evensonet al. International Journal of Behavioral Nutrition and Physical Activity
(2016) 13:55
Background
In 2010, the World Health Organization recommended that youth 5–17 years should accumulate at least 60 min of moderate to vigorous physical activity (MVPA) daily, with amounts great than 60 min/day conferring add-itional health benefits [1]. They also recommended that vigorous intensity activities should be incorporated at least 3 times/week. This recommendation was similar to the 2008 United States (US) Physical Activity Guidelines for Americans that recommended similar amounts of MVPA and vigorous activity [2].
Accelerometry is increasingly being used to conduct surveillance for physical activity and sedentary behavior among youth. This type of measure can provide infor-mation at very small increments of time called epochs. Usually, studies aggregate the information provided by the accelerometer to a daily or weekly average. While this aggregation is useful, and allows for exploration into whether or not a participant met physical activity guide-lines, it can mask underlying patterns of behavior throughout the week.
The application of latent class analysis (LCA) is emer-ging as a statistical method to describe patterns of physical activity and sedentary behavior using accelero-metry. For example, it has been used in national studies of adults to describe accelerometer-assessed patterns of physical activity and sedentary behavior [3, 4] and to use those patterns to explore correlates [5]. Among youth, one study of adolescents derived latent classes using self-reported physical activity and sedentary behavior [6, 7], and another study of 6th to 11th graders combined self-reported physical activity with accelerometer-assessed MVPA to create latent classes [8]. The derivation of latent class assignments among youth can subsequently be used to explore correlates or outcomes with those classifications, and to target sed-entary behavior or physical activity interventions by those patterns.
While LCA has been applied to measures of physical activity among youth, the studies reviewed did not in-clude younger ages. No youth studies were found that focused on accelerometry only to derive detailed pat-terns or that applied LCA to accelerometer-assessed sed-entary behavior. The purpose of this study was to identify classes of sedentary behavior and physical activ-ity patterns among a national sample of US youth. We explored whether these patterns differed by age, gender, and whether or not they were attending school at the time of measurement.
Methods
The National Health and Nutrition Examination Survey (NHANES) data used in this study were obtained during 2003–2006, the most recent publicly available data with
accelerometry. Participants, or if applicable due to age their parents or guardians, provided informed consent before the interview or any measurements were taken. The consenting documents are available for the 2003–2004 [9] and 2005– 2006 [10] cohorts. Additionally, this research was approved by the University of North Carolina Institutional Review Board.
Accelerometry measurement
Youth ages 6 and older were asked to wear the ActiGraph accelerometer (model #AM7164) on their hip for seven consecutive days during waking hours and outside of any water-based activities. Beginning at midnight on the day following the clinic visit, the accelerometer recorded 1-minute epochs of analog acceleration and converted it to a digital signal. The 24-hour data were reduced to record-ings from 6:00 am to midnight. Nonwear was defined from the accelerometer by 1-minute time intervals with consecutive zero counts for at least a 90-minute time win-dow (winwin-dow 1), allowing short time intervals with non-zero counts lasting up to 2 min (allowance interval) if no counts are detected during both the 30 min (window 2) upstream and downstream from that interval. Any non-zero counts except the allowed short intervals were con-sidered wearing time. This algorithm was developed on youths and adults, with evidence for validity [11].
We characterized average intensity of physical activity using average counts/minute. Then, using cutpoints from a calibration study [12] shown to be useful for ages 5 to 15 years [13], we defined various intensities of phys-ical activity including sedentary, light, moderate, vigor-ous, and MVPA. Since the cutpoints were derived in 15-second epochs, we translated them as follows:
Sedentary behavior: 0–25 counts/15-seconds to 0–99 counts/minute
Light: 26–573 counts/15-seconds to 100–2295 counts/ minute
Moderate: 574–1002 counts/15-seconds to 2296–4011 counts/minute
Vigorous: > = 1003 counts/15-seconds to > =4012 counts/minute
MVPA: > = 574 counts/15-seconds to > =2296 counts/ minute
Because the ActiGraph processing aggregates counts, and cutpoints are estimated based on steady state activ-ities, the longer epoch should approximate the shorter one. Sedentary behavior is defined as waking activities performed while sitting or in a reclining posture [14]. Unfortunately the ActiGraph used for this study cannot distinguish sedentary behavior from standing without moving. Thus the term“sedentary”used in this paper in-cludes some standing without moving.
Other measures
Self-reported sociodemographic measures used in this report included age, gender, race/ethnicity (Non-His-panic White, Non-His(Non-His-panic Black, His(Non-His-panic, other), and whether or not they were attending school at the time of measurement. Out of school could indicate they were on vacation or between grades in school.
Statistical methods
The sample was limited to those age 6 to 17 years (n = 5607), who participated in the accelerometer portion of NHANES during 2003–2006 (n= 5030). We further excluded 355 participants whose accelerometer was not in calibration or was faulty upon return (i.e., re-cording no counts) and 677 who did not provide at least 3 days of accelerometer wear for > =8 h/day (from 6:00 am to midnight) over a seven-day period. This left a final sample size of 3998 in which 8.7 % had three days of wear (n= 349), 12.6 % four days (n= 503), 17.9 % five days (n= 717), 27.5 % six days (n= 1099), and 33.3 % seven days (n= 1330). Intraclass correlation coefficients were calculated for average counts/minute, percent light, percent MVPA, percent vig-orous, and percent sedentary behavior among the full sample (n= 3998). The intraclass correlation coefficients ranged from 0.69 to 0.75 for 3 days, except for vigorous activity which produced the lowest value (0.64). Due to the similarities to more days of wear, we chose > =3 days for > =8 hours/day of wear as the minimum wear criteria. Following this, we explored day-level outliers among the accelerometry measures by exploring descriptive statistics and box plots. Four participants with ex-treme outliers on a given day were removed, but these participants were still retained in the overall sample since they provided > =3 days of accelerometry data even with the day removed.
To account for the differential probability of selec-tion, all percents and means were weighted to the 2000 census using the 4-year sample weights pro-vided by NHANES. The data were nested (i.e., screener, household interview, examination), such that non-response and post-stratification adjustments were applied.
Using LCA, we used 3 to 7 adherent days from the participant’s accelerometry to determine classes, or nat-ural groupings, of participants who tended to accumu-late their physical activity or sedentary behavior in a similar daily pattern. The derived classes were among participants who shared similar means, separately calcu-lated for the following weighted indicators:
– counts per minute per day,
– percent of sedentary behavior out of total wearing time per day,
– percent of light activity out of total wearing time per day,
– percent of MVPA out of total wearing time per day, and
– percent of vigorous activity out of total wearing time per day.
The LCA was performed using MPlus (version 7.11) [15], which allowed for the complex survey design in conjunction with the modeling. Mixture modelling was applied to describe the relationship between up to 7 adherent days of accelerometry and the categor-ical latent variable using a set of linear regression equations. Although we had information on day of the week of measurement, we did not have access to the time ordering of the measures (e.g., one partici-pant might start the 7 day window on Thursday, so that Wednesday’s and Thursday’s data were collected one week apart). Our latent class models do not make assumptions about proximity of weekdays, but rather control for day of the week without the as-sumption that Wednesday and Thursday’s measures fall on adjacent days.
Several criteria were used to guide the final number of classes for each sedentary behavior or physical activity variable which included:
(1)the bootstrap likelihood ratio test, which compared the fit of k classes to (k-1) classes,
(2)sample size of the classes, and
(3)substantive knowledge, including a practical interpretation of what each class represented, along with visual inspection, to ensure that the classes were sufficiently separated from each other (entropy).
For each variable, we began with a 2- or 3-class model and continued up to 7 classes. Beyond this point the sample sizes of the most active and most sedentary classes became too small. Each participant was assigned to one class based on the highest pos-terior class membership probability. In addition, a sensitivity analysis was conducted among those who contributed two adherent weekend days and therefore one or more adherent weekdays (n= 2215) to explore whether missing weekends days impacted the results. The patterns for average intensity, sedentary behavior, light activity, MVPA, and vigorous activity were simi-lar to those in the overall sample (n= 3998) and therefore not presented.
To test measurement invariance across age group, gender, and school characteristics, a multi-group LCA analysis was implemented using the same number of la-tent classes developed on the same physical activity
measure on the full sample. Two multi-group LCA models were built: an unrestricted model and a restricted model where model parameters of day-to-day accelerom-eter measures were restricted to be equal across groups. Likelihood ratio chi-square tests were performed by com-paring model fit from the two models (unrestricted vs. re-stricted). A significant p value indicated that a LCA model should be conducted by groups. Using SAS ® release 9.3 (Cary, North Carolina), classes were explored using weighted means of each variable by day of the week and for the overall results by accelerometer wear time.
Agreement between the overall assignment and the stratified assignment were compared using percent agreement and weighted kappa coefficients (e.g., com-paring the assignment among males from the overall LCA to the assignment from the male-only LCA). Weighted kappa coefficients were interpreted as 0–<0.2 poor, 0.2- < 0.4 fair, 0.4- < 0.6 moderate, 0.6- < 0.8 sub-stantial, and 0.8- < 1.0 almost perfect [16], with a lower coefficient indicating a greater need for the stratified assignment.
Results
The sample comprised 3998 youth 6 to 17 years, distrib-uted relatively evenly by age group (39.7 % 6–11 years, 31.2 % 12–14 years, 29.1 % 15–17 years) and gender (49.8 % female, 50.2 % male). More youth reported at-tending school at the time of the measurement (77.9 %) compared to not being in school (22.1 %), while 307 were missing on this measure. Youth 6 to 17 years were classified into 4 classes for average counts/minute/day and percent of time in sedentary behavior, light activity, and MVPA and 3 classes for percent of time in vigorous activity. The bootstrap likelihood ratio test to compare k to (k-1) classes was <0.001 in all cases.
For each latent class, we explored accelerometer wear time overall and by day within each derived class. For all variables, weighted mean weekly accelerometer wear time ranged from 12.9 to 13.3 h/day by derived class (data not shown). Mean wear was slightly longer for classes with more sedentary behavior (13.2 h/day class 4) compared to less sedentary behavior (12.9 h/day class 1), and less light activity (13.3 h/day class 4) compared to more light activity (12.9 h/day class 1), and more orous activity (13.2 h/day class 3) compared to less vig-orous activity (13.1 h/day class 1).
Following development of the final LCA overall, meas-urement invariance was tested by group. For all sedentary behavior and physical activity classes with each of the strati-fication variables (age, gender, and school characteristics), the tests were significant for all solutions. This indicated that the models should be conducted by groups and, there-fore, we also present stratified results.
Average intensity
Overall
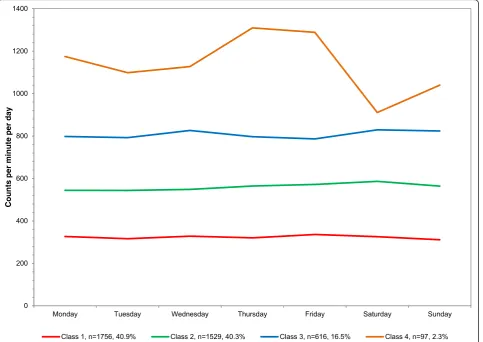
The sample averaged 507.9 counts/minute/day. For aver-age counts/minute/day, four classes emerged from least to most active: 40.9 % of population (mean 323.5 counts/minute/day), 40.3 % (559.6), 16.5 % (810.0), and 2.3 % (1132.9) (Table 1). The average counts/minute across the week is plotted in Fig. 1 with corresponding numeric values in Additional file 1. Classes 2 to 4 were stable across all days of the week. However, the most ac-tive class (class 4) remained higher on the weekdays (1098.7 to 1309.4 average counts/minute/day) and lower on the weekends (911.0 to 1040.0 average counts/mi-nute/day) but still higher than any other class.
Stratified
The stratified average counts/minute/day by class and day are plotted in Additional file 2 with corresponding nu-meric values in Additional file 1. The average counts/mi-nute/day was lower with each successive age group (620.0 age 6–11, 468.4 age 12–14, 397.3 age 15–17), lower among girls (446.8) compared to boys (568.7), and lower among youth in school (483.1) compared to out of school (520.7). A 3-class solution emerged for each age group, with the highest average counts/minute/day class repre-senting the smallest sample (5.1 % age 6–11, 8.8 % age 12–14, and 6.2 % age 15–17). For age 6–11, the lower two classes had consistent counts across the week, while the most active class (class 3) had more variability, ranging from 912.9 on Saturday to 1221.5 on Thursday. For age 12–14, the three classes had consistent counts across the week. For age 15–17, the lowest class (class 1) was stable across all days of the week, while the other two classes were higher on weekdays and lower on weekends.
A 4-class solution emerged for boys, but a 3-class so-lution fit best for girls with the most active class includ-ing only 48 girls. Most patterns were stable across the week, with the exception of the most active boys with higher average intensity on the weekdays (1115.2–1365.2 counts/minute/day) than the weekends (880.9–1016.1 counts/minute/day).
A 4-class solution emerged for in school, but a 3-class solution emerged for out of school with the most active class including only 20 youth. Both in and out of school were stable across the week for all but the most active classes, which displayed higher average intensity on the weekdays (1062.0–1269.8 in school, 1202.0–1475.7 out of school) and lower on the weekends (919.1–1138.8 in school, 646.0–760.6 out of school).
Using the final model class assignments, we compared agreement of average intensity between the overall as-signment to the stratified asas-signment (Table 2). The weighted kappa agreement was almost perfect for all
Table 1Descriptive information on latent classes derived from accelerometry, overall and by age, gender, and school characteristics, among youth 6–17 years; NHANES 2003-2006
Overall Age
6–11 years (n= 1588)
12–14 years (n= 1247)
15–17 years (N= 1163
Weighted % in Class
Weighted Average CPM/Day or Min/Day
Weighted % in Class
Weighted Average CPM/Day or Min/Day
Weighted % in Class
Weighted Average CPM/Day or Min/Day
Weighted % in Class
Weighted Average CPM/Day or Min/Day
Latent class: average CPM per day
Class 1- Least active 40.9 323.5 53.8 471.0 56.1 324.3 66.9 293.5
Class 2 40.3 559.6 41.1 746.5 35.1 554.5 26.9 516.0
Class 3 16.5 810.0 5.1 1107.4 8.8 848.3 6.2 782.7
Class 4 - Most active 2.3 1132.9
Latent class: percent of sedentary (0- < 100 CPM) out of total wearing time per day
Overall:
Class 1 - Most sedentary 13.5 544.6 8.7 469.6 10.0 574.8 22.0 559.9
Class 2 30.1 455.1 35.1 391.0 37.0 478.7 48.9 486.1
Class 3 38.5 357.7 41.1 309.7 39.7 393.0 22.6 391.9
Class 4 Least sendentary 18.0 259.2 15.1 227.9 13.3 306.2 6.6 289.7
Latent: class percent of light (100–2295) CPM) out of total wearing time per day
Class 1 - Least light activity
12.3 222.6 14.5 298.9 31.0 248.6 38.6 228.9
Class 2 29.3 301.7 55.7 385.5 49.4 334.8 46.1 315.0
Class 3 41.8 384.0 29.8 456.3 19.6 410.6 15.3 413.0
Class 4 - Most light activity
16.6 455.5
Latent class: percent of MVPA (> = 2296 CPM) out of total wearing time per day
Class 1 Least 56.4MVPA 59.9 25.0 56.5 32.8 66.6 23.0 80.9 21.7
Class 2 33.3 60.9 37.8 66.6 26.4 56.4 14.2 68.2
Class 3 3.1 89.0 5.8 110.7 7.0 98.8 4.9 64.7
Class 4 - Most vigorous activity
3.6 109.3
Latent class: of vigorous physical activity (> = 4012 CPM) out of total wearing time per day
Class 1 Least vigorous activity
76.8 7.1 76.0 9.4 89.9 7.8 87.8 5.4
Class 2 18.5 23.9 19.7 19.7 10.1 37.0 7.7 30.4
Class 3 Most vigorous activity
4.7 47.4 4.4 49.6 4.7 38.8
Evenson
et
al.
Internationa
lJournal
of
Behavio
ral
Nutrition
and
Physical
Activity
(2016) 13:55
Page
5
of
Gender In or Out of School
Gender In or Out of School
Boys (n= 2006)
Girls (n= 1992)
In School (n= 2874) Out of School (n= 817)
Weighted % in Class
Weighted Average CPM/Day or Min/Day
Weighted % in Class
Weighted Average CPM/Day or Min/Day
Weighted % in Class
Weighted Average CPM/Day or Min/Day
Weighted % in Class
Weighted Average CPM/Day or Min/Day
Latent class: average CPM per day
39.4 370.8 59.8 331.7 44.4 316.0 60.8 390.5
40.4 605.4 37.5 624.5 37.4 532.1 36.8 720.6
17.7 860.4 2.7 1055.9 16.3 774.3 2.4 1124.0
2.6 1147.0 1.8 1138.1
Latent class: percent of sedentary (0- < 100 CPM) out of total wearing time per day
12.2 534.3 15.1 549.4 13.2 557.2 27.6 483.3
33.3 441.9 29.5 466.2 29.5 476.4 49.9 363.5
39.0 343.8 35.7 366.9 36.6 387.8 22.5 258.4
15.5 240.7 19.7 275.1 20.7 292.5
Latent: class percent of light (100–2295) CPM) out of total wearing time per day
10.5 221.9 13.5 222.3 16.3 228.8 29.9 253.5
30.2 306.7 29.1 297.1 32.0 307.5 50.7 362.6
43.4 390.1 39.1 376.2 39.1 385.4 19.4 455.9
15.9 461.4 18.3 376.2 12.6 446.2
Latent class: percent of MVPA (> = 2296 CPM) out of total wearing time per day
56.6 31.7 69.4 21.6 61.0 23.9 68.8 26.5
33.8 68.4 28.7 55.7 31.4 57.8 29.0 68.1
4.4 87.6 2.0 99.0 2.9 96.5 2.2 118.6
5.1 112.0 4.7 99.0
Latent class: of vigorous physical activity (> = 4012 CPM) out of total wearing time per day
75.0 9.5 81.3 5.4 79.8 7.1 84.2 7.9
20.0 28.0 16.3 20.4 16.7 25.5 8.8 26.7
5.0 50.5 2.4 44.6 3.5 50.4 7.0 37.8
Abbreviations:CPMcounts per minute,minminute,MVPAmoderate to vigorous physical activity Note: In some cases, a 2-class or 3-class solution is presented rather than a 4-class solution
Evenson
et
al.
Internationa
lJournal
of
Behavio
ral
Nutrition
and
Physical
Activity
(2016) 13:55
Page
6
of
categories except for age 6–11 (fair 0.30) and out of school (moderate 0.46).
Sedentary behavior
Overall
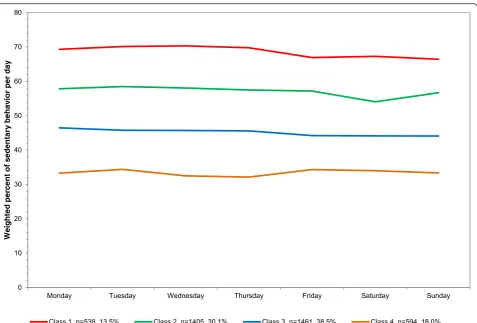
The sample averaged 50.9 % of sedentary behavior out of total wearing time or 6.8 h/day in sedentary behavior. For percent of sedentary behavior out of total wearing time, four classes were identified from most to least sed-entary: 13.5 % of population (mean 544.6 min/day), 30.1 % (455.1), 38.5 % (357.7), and 18.0 % in the highest class (259.2) (Table 1). The mean percents across the week are plotted in Fig. 2 with corresponding numeric values in Additional file 1 and average minutes/day in Additional file 3. The percent of the day in sedentary be-havior was stable across all days of the week for all four classes.
Stratified
The percent of the day in sedentary behavior out of total wearing time was higher with each successive age group (43.2 % age 6–11, 53.9 % age 12–14, 58.1 % age 15–17), among girls (52.3 %) compared to boys (49.5 %), and
when in school (52.6 %) compared to out of school (49.8 %). The stratified mean percents by class and day are plotted in Additional file 2 with corresponding nu-meric values in Additional file 1, along with mean mi-nutes/day in sedentary behavior in Additional file 3.
A 4-class solution for percent time in sedentary behav-ior emerged for each age group. For age 6–11 years, the most sedentary class 1 had higher percent of the day in sedentary behavior on the weekdays (60.8–63.8 %) and lower on the weekends (51.9–57.5 %). Most other classes across age groups were stable across the week with one exception. For age 15–17 years, the least sedentary class 4 had a lower percent of the day in sedentary behavior on weekdays (33.7–38.5 %) and higher on weekends (40.5–50.7 %).
A 4-class solution for percent of the day in sedentary behavior emerged for boys and girls, with percent time stable across the week. A 4-class solution for percent of the day in sedentary behavior emerged for in school, but a 3-class solution emerged for out of school, with per-cent time stable across the week.
Using the final model class assignments, we compared agreement of sedentary behavior between the overall
Fig. 1Latent class analysis plotted for weighted mean counts per minute per day among youth 6–17 years; NHANES 2003–2006
assignment to the stratified assignment (Table 2). Weighted kappa agreement was almost perfect for gen-der and in school, but lower for age (6–11 years, moder-ate 0.48; 12–14 years, substantial 0.67; 15–17 years, substantial 0.75) and out of school (fair 0.39).
Light activity
Overall
The sample averaged 43.8 % of light activity out of total wearing time or 349.0 min/day in light activity. For per-cent of light activity out of total wearing time, four clas-ses emerged from least to most light activity: 12.3 % of population (mean 222.6 min/day), 29.3 % (301.7), 41.8 % (384.0), and 16.6 % (455.5) (Table 1). The means across the week are plotted in Fig. 3 with corresponding nu-meric values in Additional file 1 and average minutes/ day in Additional file 3. The percent of the day in light activity was stable across all days of the week for all four classes.
Stratified
The percent of the day in light activity out of total wear-ing time was lower with each successive age group (50.3 % age 6–11, 41.1 % age 12–14, 37.8 % age 15–17), but was similar by gender (43.7 % girls and 43.9 % boys) and school characteristics (42.4 % in school and 44.9 % out of school). The stratified mean percents by class and day are plotted in Additional file 2 with corresponding numeric values in Additional file 1, along with mean mi-nutes/day in light activity in Additional file 3.
A 3-class solution emerged for each age group, with most classes stable on the weekdays and slightly higher on the weekends. However, for age 6–11 years, the most light activity class 3 was stable and high across the entire week (58.4–60.5 %) and for age 15–17 years, the most light activity class 3 was stable on the weekdays (52.1– 54.7 %) and lower on the weekends (48.5–51.2 %).
A 4-class solution for percent of time in light activity emerged for boys and girls separately, with all derived classes relatively stable across the week. The light activ-ity classes were quite similar between boys and girls. For percent of time in light activity, a 4-class solution emerged for in school and a 3-class solution emerged for out of school. For both in and out of school, the per-cent of time in light activity was stable across the week.
Using the final model class assignments, we compared agreement of light intensity between the overall assign-ment to the stratified assignassign-ment (Table 2). Weighted kappa agreement was almost perfect for gender and in school, but lower for age group (6–11 years, poor 0.14; 12–14 years, moderate 0.53; 15–17 years, substantial 0.75) and out of school (fair 0.31).
Moderate to vigorous physical activity
Overall
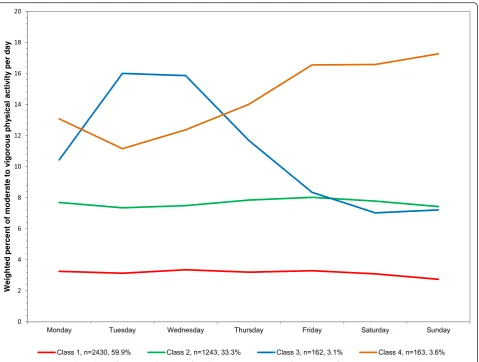
The sample averaged 5.3 % of MVPA out of total wear-ing time or 42.7 min/day in MVPA. For percent of MVPA out of total wearing time, four classes emerged from least to most MVPA: 59.9 % of population (mean 25.0 min/day), 33.3 % (60.9), 3.1 % (89.0), and 3.6 %
Table 2Percent agreement and weighted kappa by age, gender, and school characteristics among youth 6–17 years; NHANES 2003–2006
Age Gender In or Out School
6–11 years (n= 1588)
12–14 years (n= 1247
15–17 years (N =1163)
Boys (n= 2006)
Girls (n= 1192)
In School (n= 2873)
Out of School (n= 817) Latent class: average CPM per day
% agreement 40.2 97.0 94.4 85.1 83.7 93.7 60.2
Weighted kappa 0.30 0.96 0.90 0.83 0.73 0.92 0.46
Latent class: percent of sedentary (0- < 100 CPM) out of total wearing time per day
% agreement 52.2 71.0 78.9 85.2 87.7 80.6 46.5
Weighted kappa 0.48 0.67 0.75 0.85 0.88 0.80 0.39
Latent: class percent of light (100–2295) CPM) out of total wearing time per day
% agreement 31.9 63.4 81.1 97.0 95.9 96.3 36.8
Weighted kappa 0.14 0.53 0.75 0.97 0.96 0.96 0.31
Latent class: percent of MVPA (> = 2296 CPM) out of total wearing time per day
% agreement 86.4 93.3 88.7 88.3 94.9 94.4 86.5
Weighted kappa 0.8 0.89 0.74 0.85 0.88 0.89 0.77
Latent class: of vigorous physical activity (> = 4012 CPM) out of total wearing time per day
% agreement 94.1 91.4 89.9 89.7 94.7 97.3 86.2
Weighted kappa 0.89 0.71 0.73 0.83 0.81 0.94 0.70
Abbreviations:CPMcounts per minute
(109.3) (Table 1). The means across the week are plotted in Fig. 4 with corresponding numeric values in Additional file 1 and average minutes/day in Additional file 3. The percent of the day in MVPA was stable across all days of the week for the least active classes (1 and 2). Class 3 was higher on Monday through Thursday (10.4– 16.0 %), but lower on Friday through Sunday (7.0– 8.3 %). Class 4, the most active class, was lower on Monday through Thursday (11.2–14.0 %), but highest on Friday through Sunday (16.6–17.3 %).
Stratified
The percent of the day in MVPA out of total wearing time was lower with each successive age group (6.5 % age 6–11, 5.0 % age 12–14, 4.1 % age 15–17) and among girls (4.1 %) compared to boys (6.6 %), but similar by school characteristics (5.1 % in school and 5.3 % out of school). A 3-class solution for percent of time in MVPA emerged for each age group. The stratified mean percents by class and day are plotted in Additional file 2 with corresponding numeric values in Additional file 1, along with mean minutes/ day in MVPA in Additional file 3.
For all three age groups, the classes with the lowest MVPA were relatively stable across the week. However for the highest classes, among age 6–11 the percent time in MVPA was high Monday through Thursday (12.5– 14.4 %) and even higher Friday through Sunday (15.7– 16.7 %), while for age 12–14 the percent time in MVPA was high on weekdays (11.9–13.7 %) and somewhat lower on the weekend (10.3–11.4 %). For age 15–17, the middle class was relatively stable on the weekdays (7.9– 10.8 %) and lower on the weekend (4.2–6.3 %), while the highest class varied across the week (4.0–15.7 %).
A 4-class solution for percent time in MVPA emerged for boys, but a 3-class solution fit best for girls with the most active class including only 41 girls. For girls, all three classes were stable across the week. For boys, the lower two classes (1 and 2) were stable across the week. However, among boys class 3 had more percent time in MVPA from Monday through Thursday (9.6–16.7 %) compared to Friday through Sunday (4.9–8.4 %), and the most active class had relatively high percent time in MVPA from Monday through Thursday (11.5–14.5 %) with even higher time on Friday through Sunday (17.0–18.0 %).
Fig. 2Latent class analysis plotted for weighted percent of sedentary behavior out of total wearing time per day among youth 6–17 years; NHANES 2003–2006
A 4-class solution for percent time in MVPA emerged for in school, but a 3-class solution emerged for out of school with the most active class including only 24 youth. For both in and out of school, the lower two clas-ses were relatively stable across the week. For in school, class 3 was higher Monday through Thursday (10.7– 16.7 %) and lower Friday through Sunday (7.0–9.0 %), while the most active class had relatively high percent time in MVPA from Monday through Thursday (9.5– 11.8 %) with even higher time on Friday through Sunday (14.4–15.9 %). For a small group out of school, the most active class was high during the weekdays (14.7–17.5 %) and even higher on the weekends (18.6–21.8 %).
Using the final model class assignments, we com-pared agreement of MVPA between the overall as-signment to the stratified asas-signment (Table 2). Weighted kappa agreement was almost perfect for gender, age 6–11 and 12–14 years, and in school, and slightly lower among age 15–17 (substantial 0.74) and out of school (substantial 0.77).
Vigorous activity
Overall
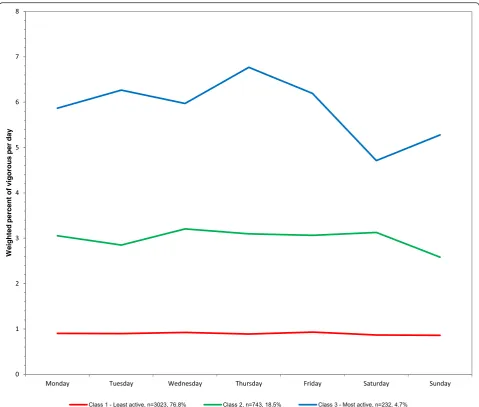
The sample averaged 1.6 % of vigorous activity out of total wearing time or 12.7 min/day in vigorous activity. For percent of vigorous activity out of total wearing time, three classes emerged from least to most vigorous activity: 76.8 % of population (mean 7.1 min/day), 18.5 % (23.9), and 4.7 % (47.4) (Table 1). The means across the week are plotted in Fig. 5 with corresponding numeric values in Additional file 1 and average minutes/day in Additional file 3. The percent of the day in vigorous ac-tivity was stable across all days of the week for all three classes.
Stratified
The percent of the day in vigorous activity out of total wearing time was slightly lower with each successive age group (1.9 % age 6–11, 1.5 % age 12–14, 1.2 % age 15– 17), lower for girls (1.1 %) compared to boys (2.1 %), but similar by school characteristics (1.5 % in school and
Fig. 3Latent class analysis plotted for weighted percent of light activity out of total wearing time per day among youth 6–17 years; NHANES 2003–2006
1.6 % out of school). A 3-class solution emerged for each ages 6–11 and 15–17, and a 2-class solution emerged for ages 12–14, with most classes relatively stable across the week. The stratified mean percents by class and day are plotted in Additional file 2 with corresponding numeric values in Additional file 1, along with mean minutes/day in vigorous activity in Additional file 3.
A 3-class solution for percent of time in vigorous ac-tivity emerged for boys and girls separately, with the lower two classes relatively stable across the week. How-ever, for both boys and girls, the highest classes (class 3) were lower on Saturday and Sunday. For percent of time in vigorous activity, a 3-class solution emerged for both in and out school and both were stable across the week.
Using the final model class assignments, we compared agreement of vigorous activity between the overall as-signment to the stratified assignment (Table 2). Weighted kappa agreement was almost perfect for gen-der, ages 6–11 years, and in school, but lower for ages 12–14 years (substantial 0.71), 15–17 years (substantial 0.73), and out of school (substantial 0.70).
Discussion
Our results indicated common ways in which physical ac-tivity and sedentary behavior can be accumulated across a week among US youth 6–17 years of age. We identified patterns for the overall sample, as well as distinct patterns by age group, gender, and whether the participant was in or out of school at the time of measurement. For average intensity, sedentary behavior, light activity, and vigorous activity, the absolute level seemed to be more important for the creation of the latent classes than the variation day-to-day. However, for MVPA, the day of week did add important information to the class assignments.
As described by others [8], the LCA approach can be viewed as a method of audience segmentation where a broad population is divided into small homogeneous groups or segments based on meaningful behavior pat-terns. LCA can be used to contribute to audience seg-mentation and provides information for framing and tailoring specific communication messages and interven-tion strategies. For example, in this study such messages could be tailored to the 40.9 % of youth who
Fig. 4Latent class analysis plotted for weighted percent of moderate to vigorous physical activity out of total wearing time per day among youth 6–17 years; NHANES 2003–2006
accumulated very little physical activity throughout the week, as indicated by low average counts/minute/ day found in class 1.
Sedentary behavior, such as sitting, constitutes time spent in periods of little or no movement while awake, and at an energy expenditure ranging from 1.0 to 1.5 metabolic equivalents [14]. In the NHANES sample, sed-entary behavior was higher among 15–17 year olds, girls, and those out of school. Using LCA, we identified unique groups of youth of particular concern; the most sedentary group included 13.5 % of the population and averaged 68.8 % of the day in sedentary behaviors. In the prior LCA study of adult accelerometry in NHANES, a weekend couch potato class emerged, comprised of lon-ger bouts of sedentary behavior on the weekends, but fewer on the weekdays. The class most similar to this in
the youth sample was found among 15–17 year olds, where sedentary behavior was lower on the weekdays but higher on the weekends (class 4). In a review of studies exploring physical activity, sedentary behavior, and diet contributing to obesity, Leech at al. [17] found that studies often identified a cluster defined by high levels of sedentary behavior. They suggested examining the types of sedentary behaviors that clustered with diet and physical activity by gender. For example, several studies identified a sedentary class pattern for both boys and girls, but the types of self-reported sedentary behav-iors that comprised these assignments differed. In the first study, the sedentary class found for boys included more video games, computer, television, while for girls it mainly comprised computer, phone, reading [8]. In two other studies, girls were more likely to be assigned to
Fig. 5Latent class analysis plotted for weighted percent of vigorous activity out of total wearing time per day among youth 6–17 years; NHANES 2003–2006
the sedentary cluster that included socialize on the phone and have higher levels of homework, in contrast to boys who were more likely to be assigned to the high screen time cluster [18, 19].
MVPA patterns among youth were most variable across the week compared to the other four measures. Interestingly, we found some MVPA patterns were stable Monday through Thursday and then differed for Friday through Sunday. This is in contrast to US adult MVPA accelerometry patterns. For adults, if differences across the week were identified within a class, then it occurred between weekdays and weekend days, such as for the weekend warrior class [4]. In the Leech et al. [17] review, all but one study found either different clusters or clas-ses by gender or significant differences in the proportion of boys and girls by cluster or class, with a higher pro-portion of boys falling into the higher clusters or classes. This finding is consistent with the accelerometer find-ings in our study.
Future studies and applications
With the development of these latent class assignments, exploration into correlates and associations with other health behaviors collected in NHANES can be further explored to understand their usefulness over and above traditional time-based measures of physical activity and sedentary behavior. The patterns can be used to target interventions aimed at increasing physical activity or re-ducing sedentary behavior. The LCA techniques could further be applied to the NHANES data to develop (i) classes for cardiovascular- or obesity-related health be-haviors that included physical activity (see review [17]), (ii) classes for physical activity, sedentary behavior, and sleep (such as Carson et al. [20]), or (iii) classes that combine self-reported and accelerometer-assessed phys-ical activity (such as Patnode et al. [8]). In addition, LCA can be applied to accelerometry data with multiple mea-sures to assess class patterns over time (such as Barnett et al. [21]) or on patterns within the day.
Strengths and limitations
The strengths of the study included a national sample of youth 5–17 years with detailed measurement of physical activity and sedentary behavior. Our detailed analysis fo-cused only on accelerometry, and provided class assign-ments overall and by age, gender, and school characteristics that can be used by others or applied to other data. However, this study also has several limita-tions. First, the uniaxial accelerometer used by NHANES under counts some activities, such as bicycling and weight lifting, and misses other activities, such as swimming, be-cause the monitor was not waterproof and participants were told to remove it for any water-based activity.
Presumably, there may be some sports that youth played in which wearing the accelerometer was prohibited.
Second, to date the most advanced cleaning protocol to remove nonwear time for the ActiGraph, in the absence of a diary indicating wear time, is an algorithm developed by Choi and colleagues among youth > =10 years and adults [11]. The research group later published a study of adults, showing that applying the algorithm using vector magni-tude provided improved results than using the vertical axis only [22]. However, for the accelerometer used in NHANES only vertical counts were available. It is also un-known if the cleaning algorithm was appropriate for ages less than 10 years, although studies have applied it. Third, the cutpoints we used are only estimates of physical activ-ity and sedentary behavior, and as mentioned in the methods section the sedentary behavior definition does in-clude standing without moving. Newer accelerometers that provide raw data can improve upon these estimations of intensity. We extrapolated cutpoints derived on 15-second accelerometer data [12] and applied it to the 60-second data available from NHANES. Because the cutpoints were derived on steady state activities in the la-boratory, the amount of error in making this translation should be minimized.
Fourth, although the overall sample size approached 4000 youth, as indicated in the results some class assign-ments had small sample sizes. Moreover, our attempt to explore classes by multiple groups, such as age by gender, was limited due to this issue and thus is not presented. A review paper also recognized this challenge in existing cluster analyses and recommended future studies with large enough sample sizes to overcome this challenge [17]. There are also inherent limitations to the statistical analysis that should be acknowledged. The LCA models with sampling weights applied to these data assume data are missing at random. This assumption may not always be true, for example when the accelerometer is removed for water activities. The bootstrap likelihood ratio test we used was based on unweighted data and did not ac-count for the sampling design. However, we also used other criteria to make the final determination for the number of classes to use, including class sample size, substantive knowledge, and visual inspection.
Conclusion
The patterns derived from this LCA provide a novel way to explore sedentary behavior and physical activity, using not only level of physical activity, but patterns across days. Many studies collect one week of accelerometry and collapse variables into weekly, weekday, or weekend measures only. This study developed latent classes that can be used by others to gain insight into the relation-ships between sedentary and physical activity behavior and other outcomes in the NHANES data repository or
to apply to studies with similar protocols. The usefulness of this approach is that common patterns that are identi-fied can be intervention targets by class or day of the week.
Additional files
Additional file 1:Online Table 1: Weighted average physical activity and sedentary behavior in counts/minute or percent by day of the week for each latent class derived from accelerometry, overall and by age, gender, and school characteristics, among youth 6–17 years; NHANES 2003–2006. (PDF 56 kb)
Additional file 2:Latent class analysis plotted for (1) weighted average counts/minute/day and weighted percent of (2) sedentary behavior, (3) light activity, (4) moderate to vigorous physical activity and (5) vigorous activity out of total wearing time per day, by age, gender, and school characteristics, among youth 6–17 years; NHANES 2003–2006. (PDF 144 kb)
Additional file 3:Online Table 2: Weighted average physical activity and sedentary behavior in minutes/day by day of the week for each latent class derived from accelerometry, overall and by age, gender, and school characteristics, among youth 6–17 years; NHANES 2003–2006. (PDF 44 kb)
Abbreviations
LCA:latent class analysis; MVPA: moderate to vigorous physical activity; NHANES: National Health and Nutrition Examination Survey.
Competing interests
The author(s) declare that they have no competing interests.
Authors’contributions
KRE developed the aims of the study and drafted the paper, while all remaining authors provided critical feedback on earlier drafts of the paper. AHH, DH, and FW provided input on the analysis of the study, while FW wrote all analytic programs. All authors read and approved the final manuscript.
Acknowledgment
The project was supported by the National Institute of Health (NIH), National Heart, Lung, And Blood Institute (NHLBI), theEunice Kennedy ShriverNational Institute of Child Health, and Development and the Office of Behavioral and Social Sciences Research through #U01 HL103561. We also acknowledge support from NHLBI #R21 HL115385. The content is solely the responsibility of the authors and does not necessarily represent the official views of the National Institutes of Health.
Author details
1Department of Epidemiology at the Gillings School of Global Public Health, Center for Health Promotion and Disease Prevention, University of North Carolina, 137 East Franklin Street, Suite 306, Chapel Hill, NC 27514, USA. 2Department of Epidemiology at the Gillings School of Global Public Health, University of North Carolina, Chapel Hill, NC, USA.3Department of Nutrition at the Gillings School of Global Public Health, University of North Carolina, Chapel Hill, NC, USA.4Department of Biostatistics at the Gillings School of Global Public Health, Carolina Population Center, University of North Carolina, Chapel Hill, NC, USA.
Received: 26 November 2015 Accepted: 28 April 2016
References
1. World Health Organization. Global Recommendations on Physical Activity for Health. Geneva; http://whqlibdoc.who.int/publications/2010/ 9789241599979_eng.pdf. Accessed 13 Apr 2016.
2. U.S. Department of Health and Human Services. Physical Activity Guidelines for Americans. Washington: ODPHP Publication No. U0036; 2008. http:// www.health.gov/paguidelines. Accessed 13 Apr 2016.
3. Metzger JS, Catellier DJ, Evenson KR, Treuth MS, Rosamond WD, Siega-Riz AM. Patterns of objectively measured physical activity in the United States. Med Sci Sports Exerc. 2008;40(4):630–8. doi:10.1249/MSS.0b013e3181620ebc. 4. Evenson KR, Wen F, Metzger JS, Herring AH. Physical activity and sedentary
behavior patterns using accelerometry from a national sample of United States adults. Intl J Behavioral Nutr Phys Activity. 2015;12(1):20. doi:10.1186/ s12966-015-0183-7.
5. Jones S, Wen F, Herring AH, Evenson KR. Correlates of US adult physical activity and sedentary behavior patterns. J Sci Med Sport. 2016. doi:10.1016/ j.jsams.2016.03.009.
6. Liu J, Kim J, Colabianchi N, Ortaglia A, Pate RR. Co-varying patterns of physical activity and sedentary behaviors and their long-term maintenance among adolescents. J Phys Activity Health. 2010;7(4):465–74.
7. Kim Y, Barreira TV, Kang M. Concurrent associations of physical activity and screen-based sedentary behavior on obesity among US adolescents: A latent class analysis. J Epidemiol. 2015. doi:10.2188/jea.JE20150068. 8. Patnode CD, Lytle LA, Erickson DJ, Sirard JR, Barr-Anderson DJ, Story M. Physical
activity and sedentary activity patterns among children and adolescents: a latent class analysis approach. J Phys Activity Health. 2011;8(4):457–67.
9. National Center for Health Statistics. 2003–2004 National Health and Nutrition Examination Survey (NHANES): Survey brochures and consent documents. 2015. http://www.cdc.gov/nchs/nhanes/nhanes2003-2004/ brochures03_04.htm. Accessed 13 Apr 2016.
10. National Center for Health Statistics. 2005–2006 National Health and Nutrition Examination Survey (NHANES): Survey brochures and consent documents. http://www.cdc.gov/nchs/nhanes/nhanes2005-2006/ brochures05_06.htm. Accessed 13 Apr 2016.
11. Choi L, Liu Z, Matthews CE, Buchowski MS. Validation of accelerometer wear and nonwear time classification algorithm. Med Sci Sports Exerc. 2011;43(2): 357–64. doi:10.1249/MSS.0b013e3181ed61a3.
12. Evenson K, Catellier D, Gill K, Ondrak K, McMurray R. Calibration of two objective measures of physical activity for children. J Sport Sci. 2008;26(14):1557–65. 13. Trost SG, Loprinzi PD, Moore R, Pfeiffer KA. Comparison of accelerometer
cut points for predicting activity intensity in youth. Med Sci Sports Exerc. 2011;43(7):1360–8. doi:10.1249/MSS.0b013e318206476e.
14. Sedentary Behaviour Research Network. Standardized use of the terms
“sedentary”and“sedentary behaviours”. Applied Physiol Nutrition Metabolism. 2012;37:540–2.
15. Muthén L, Muthén B. Mplus User’s Guide - Fifth Edition (1998–2007). ed. Los Angeles: Muthén and Muthén; 2007.
16. Landis J, Koch G. The measurement of observer agreement for categorical data. Biometrics. 1977;33:159–74.
17. Leech RM, McNaughton SA, Timperio A. The clustering of diet, physical activity and sedentary behavior in children and adolescents: a review. Intl J Behavioral Nutrition Phys Activity. 2014;11:4. doi:10.1186/1479-5868-11-4. 18. Gorely T, Marshall SJ, Biddle SJ, Cameron N. Patterns of sedentary behaviour
and physical activity among adolescents in the United Kingdom: Project STIL. J Behav Med. 2007;30(6):521–31. doi:10.1007/s10865-007-9126-3. 19. Marshall S, Biddle S, Sallis J, McKenzie T, Conway T. Clustering of sedentary
behaviors and physical activity among youth: A cross-national study. Pediatr Exerc Sci. 2002;14:401–17.
20. Carson V, Faulkner G, Sabiston CM, Tremblay MS, Leatherdale ST. Patterns of movement behaviors and their association with overweight and obesity in youth. Intl J Public health. 2015;60(5):551–9. doi:10.1007/s00038-015-0685-8. 21. Barnett TA, Gauvin L, Craig CL, Katzmarzyk PT. Distinct trajectories of leisure
time physical activity and predictors of trajectory class membership: a 22 year cohort study. Intl J Behavioral Nutrition Phys Activity. 2008;5:57. doi:10.1186/1479-5868-5-57.
22. Choi L, Ward SC, Schnelle JF, Buchowski MS. Assessment of wear/nonwear time classification algorithms for triaxial accelerometer. Med Sci Sports Exerc. 2012;44(10):2009–16. doi:10.1249/MSS.0b013e318258cb36.