M E T H O D O L O G Y
Open Access
Using statistical methods and genotyping to
detect tuberculosis outbreaks
J Steve Kammerer
1,2*, Nong Shang
1, Sandy P Althomsons
1, Maryam B Haddad
1, Juliana Grant
1and Thomas R Navin
1Abstract
Background:Early identification of outbreaks remains a key component in continuing to reduce the burden of infectious disease in the United States. Previous studies have applied statistical methods to detect unexpected cases of disease in space or time. The objectives of our study were to assess the ability and timeliness of three spatio-temporal methods to detect known outbreaks of tuberculosis.
Methods:We used routinely available molecular and surveillance data to retrospectively assess the effectiveness of three statistical methods in detecting tuberculosis outbreaks: county-based log-likelihood ratio, cumulative sums, and a spatial scan statistic.
Results:Our methods identified 8 of the 9 outbreaks, and 6 outbreaks would have been identified 1–52 months (median = 10 months) before local public health authorities identified them. Assuming no delays in data availability, 46 (59.7%) of the 77 patients in the 9 outbreaks were identified after our statistical methods would have detected the outbreak but before local public health authorities became aware of the problem.
Conclusions:Statistical methods, when applied retrospectively to routinely collected tuberculosis data, can
successfully detect known outbreaks, potentially months before local public health authorities become aware of the problem. The three methods showed similar results; no single method was clearly superior to the other two. Further study to elucidate the performance of these methods in detecting tuberculosis outbreaks will be done in a prospective analysis.
Keywords:Tuberculosis, SaTScan, Outbreak detection, Genotyping, Log-likelihood ratio, Cumulative sums
Background
Statistical algorithms applied to disease surveillance data aim to identify which cases most likely represent outbreaks, before local public health authorities would otherwise become aware of them. Early detection of outbreaks may increase the ability of local authorities to prevent additional outbreak-related cases. The algo-rithms work by applying statistical techniques to reported cases of disease, laboratory data, or pharmacy data to identify unusual deviations from expected values; some techniques use historic data to detect devia-tions from temporal trends and others examine spatial or spatio-temporal differences in disease concentrations
[1,2]. Non-statistical methods may also be applied to de-tect changes in the spatio-temporal distribution of dis-ease burden.
Tuberculosis (TB) incidence has been declining in the United States for almost two decades, resulting in 10,528 reported cases and a rate of 3.4 per 100,000 in 2011 (5.8% and 6.4% decrease, respectively, from 2010)
[3]. Molecular characterization ofMycobacterium
tuber-culosis isolates (TB genotyping) provides a mechanism to detect TB transmission events that might otherwise go unnoticed, based on the principle that epidemiologi-cally linked cases share a similar genotype. In the
United States, routine genotyping of M. tuberculosis
isolates from culture-positive TB cases started in 2004 through the Centers for Disease Control and Prevention’s (CDC) National Tuberculosis Genotyping Service [4]. In 2010, CDC launched the TB Genotyping Information * Correspondence:[email protected]
1Division of Tuberculosis Elimination, Centers for Disease Control and
Prevention, 1600 Clifton Rd NE, Atlanta, GA 30333, USA
2Northrop Grumman Corporation, 2800 Century Parkway NE, Atlanta, GA
30345, USA
Management System (TB GIMS), a secure web-based database available to all 50 states, the District of Columbia, Puerto Rico, and the U.S.-affiliated Pacific Islands [5]. In 2008 and 2009, 80% and 87% of U.S. culture-positive cases, respectively, had complete geno-type and surveillance records available in TB GIMS.
We retrospectively assessed the effectiveness of three statistical methods for detecting infectious disease out-breaks, using surveillance and genotyping data associ-ated with TB outbreaks investigassoci-ated by CDC during
2008–2009. We selected cumulative sums (CUSUM) as
one of our outbreak detection methods since they are an industrial standard and used by CDC in the Early Aber-ration Reporting System [2]; however, CUSUM is more challenging to implement with rare diseases such as TB. SaTScan and county-based log-likelihood ratio (LLR) both use the likelihood ratio method, with SaTScan adding a geographic search function [6]. We included county-based LLR as one of our methods for compari-son because it is simple and consistent with how TB control is structured in the U.S., and thus may be easily applied in our setting.
Methods
Data sources and definitions
We selected known TB outbreaks to compare the sensi-tivity of the three statistical algorithms. State and local health departments requested CDC assistance with nine TB outbreaks during 2008–2009; field investigations of individual patients and their epidemiologic links con-firmed that these cases represented recent transmission and should be considered outbreaks [7]. The date that local public health authorities first became aware of the potential TB outbreak was typically several weeks, and occasionally months, before CDC was invited to assist; the best estimate of that date was therefore determined based on discussion with local authorities once CDC be-came involved.
Cases were considered clustered if their isolates exactly matched by both spoligotype and 12-locus Mycobacterial Interspersed Repetitive Unit genotype re-sults [8]. Analyses performed using the selected three statistical methods were restricted to TB cases reported to the National TB Surveillance System (NTSS) after January 1, 2005, and before the outbreak investigation commenced, and to records with both a valid genotype and corresponding NTSS record in TB GIMS. Out-breaks investigated before 2008 were excluded due to insufficient background data, because 2005 is the earli-est year with nationally representative genotyping data. Outbreaks investigated after 2009 were excluded be-cause surveillance data were incomplete at the time of this analysis. The date used for all analyses was the count date available from NTSS data, defined as the
date that the health department verified the case as TB and included it in the official case count.
Location data available from NTSS include the county (used for CUSUM and county-based LLR methods) and 5-digit zip code (used for SaTScan method) associated with the patient’s residence at the time of diagnosis as determined by the local health department. Home ad-dresses are not collected by the surveillance system.
Statistical methods
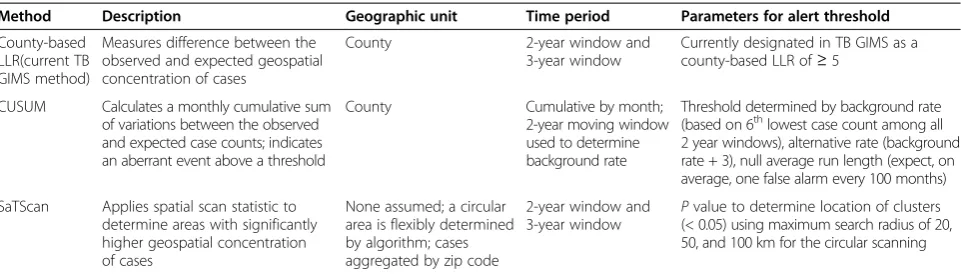
We assessed three methodologies: county-based log-likelihood ratio (LLR), cumulative sums (CUSUM), and a spatial scan statistic (SaTScan) (Table 1). CUSUM uses a temporal approach within a specified geographic area; county-based LLR and SaTScan both use spatial methods. The three detection methods were evaluated separately for the ability to detect each outbreak-associated genotype.
Method 1: county-based LLR
The LLR method assumed cases follow a Poisson distri-bution, and compared the ratio of cases with the out-break genotype to all genotyped TB cases inside a given geographic area, which we defined as a county, to the ra-tio in the rest of the United States. The LLR calculara-tion is as follows:
LLR¼ nilog ni=nðniþNiÞ all=Nall
þ nolog no=nðnoþNoÞ all=Nall
where ni = TB cases with the outbreak genotype inside
the county,Ni= cases with all other genotypes inside the
county, no = cases with the outbreak genotype outside
the county, No = cases with all other genotypes outside
the county,nall= all cases with the outbreak genotype in
the United States (i.e., ni+no), andNall = all genotyped
cases in the United States (i.e.,ni+no+Ni+No).
A higher value of LLR indicates a greater likelihood that the specified county has an unexpected concentra-tion of cases with a certain genotype. TB GIMS, which currently employs this methodology using a 3-year time window, reports the county-based LLR as an“alert” if a TB genotype in that county has an LLR≥5; this thresh-old was selected by a group of national experts based on a review of TB genotyping clusters in the United States in 2009.
each outbreak would have first alerted using the TB GIMS cut point.
Method 2: county-based CUSUM
CUSUM is used to detect temporal aberrations in a fixed geographic region, which we defined as a county. For each of the nine outbreak counties, we applied a Poisson distribution-based CUSUM procedure to the monthly number of TB cases with the outbreak genotype. The procedure carried out monthly statistical tests sequen-tially, with the null hypothesis defined as no aberration and the alternative hypothesis as the occurrence of some aberration.
A CUSUM curve was constructed with monthly updated values of the CUSUM statistic, and a horizontal line representing the critical value for rejecting the null hypothesis (threshold) was added to the graph. An aber-ration was noted at the month and year the CUSUM curve crossed above the threshold. Constructing the CUSUM curve and the threshold line requires specifica-tion of the following parameters: the background event rate (no aberration); a definition of the aberration that we would like to detect (in terms of increased event rate over the background rate); and the null average run length, defined as the acceptable false alarm rate (aver-age number of months between two alarms when there is no aberration).
We counted the number of cases with the outbreak genotype within all 2-year time windows contained in the study period (i.e., with start dates of January 1, 2005 through January 1, 2008, advancing one month at a time). The case counts from the resulting 37 time win-dows were sorted and the sixth smallest count, deter-mined heuristically, was used as the background rate; a rate of 0.5 was used if the count was zero. The aberrant rate was then defined as the background rate plus the minimal detectable outbreak. Based on CDC experience with previous TB outbreaks, we defined the minimal de-tectable outbreak as 3 cases in a 2-year period [7].
The threshold was chosen based on the background and aberrant event rates and a null average run length of approximately 100 months [9]. An alert was identified if and when the monthly CUSUM value exceeded the threshold.
Method 3: SaTScan
The spatial scan statistic, as implemented in the SaTScan software, has been used extensively to detect localized clusters of disease [10-14]. We applied SaTScan version 8.0.2 (Kulldorff, Boston) using a retrospective, purely spatial analysis and the discrete Poisson probability model. A detailed description of SaTScan methods can be found elsewhere [6]. Briefly, the LLR for the Poisson model is calculated for a pool of candidate circular win-dows with different locations and sizes. The spatial scan statistic is defined as the maximum LLR among all the candidate clusters, and is tested for statistical signifi-cance using 999 Monte Carlo replications to derive the
P value, based on the distribution of the spatial scan
statistic under the null hypothesis of spatial randomness of cases. After determining the most likely cluster (i.e., maximum SaTScan LLR), the algorithm continues to search for additional clusters under the assumption that a case can only be included in one cluster.
For our application, the SaTScan LLR compared the number of cases with the outbreak genotype inside the circle with the number outside the circle, searching for areas with high rates, under the Poisson probability model. We aggregated cases for each outbreak genotype by zip code as the geographic unit of analysis and de-fined all genotyped TB cases as the population at risk for having a specific outbreak genotype, also aggregated by zip code. Zip code centroid coordinates were obtained from Esri (Redlands, CA).
We ran each outbreak genotype multiple times using a maximum circle radius of 20, 50, and 100 km; we also examined both 2- and 3-year moving time windows with the same procedure used for the county-based LLR Table 1 Three statistical methods for detection of tuberculosis outbreaks, 2008-2009
Method Description Geographic unit Time period Parameters for alert threshold
County-based LLR(current TB GIMS method)
Measures difference between the observed and expected geospatial concentration of cases
County 2-year window and
3-year window
Currently designated in TB GIMS as a county-based LLR of≥5
CUSUM Calculates a monthly cumulative sum of variations between the observed and expected case counts; indicates an aberrant event above a threshold
County Cumulative by month;
2-year moving window used to determine background rate
Threshold determined by background rate (based on 6thlowest case count among all
2 year windows), alternative rate (background rate + 3), null average run length (expect, on average, one false alarm every 100 months)
SaTScan Applies spatial scan statistic to determine areas with significantly higher geospatial concentration of cases
None assumed; a circular area is flexibly determined by algorithm; cases aggregated by zip code
2-year window and 3-year window
Pvalue to determine location of clusters (< 0.05) using maximum search radius of 20, 50, and 100 km for the circular scanning
method. An alert was identified if and when the SaTScan cluster first became significant (P< 0.05).
Application of aberration detection results
We determined whether and when each method detected the outbreak and compared it to the date that local public health authorities first reported becoming aware of the potential outbreak. To estimate the true im-pact for each outbreak, we included all cases during 2005–2009 that were confirmed by field investigations to be part of the outbreak, regardless of whether a geno-type was available (e.g., culture-negative pediatric cases that were epidemiologically linked to a confirmed case) [7]. To estimate the number of potentially avertable cases in each outbreak, we calculated the number of out-break cases occurring after the earliest date of detection by any method, had the retrospectively applied statistical alert methods been in place at that time.
Ethical review
Data used in this study were collected as part of routine disease surveillance and control activities and were not considered to constitute human subjects research requir-ing institutional review board approval.
Results
Effectiveness and timeliness of statistical methods
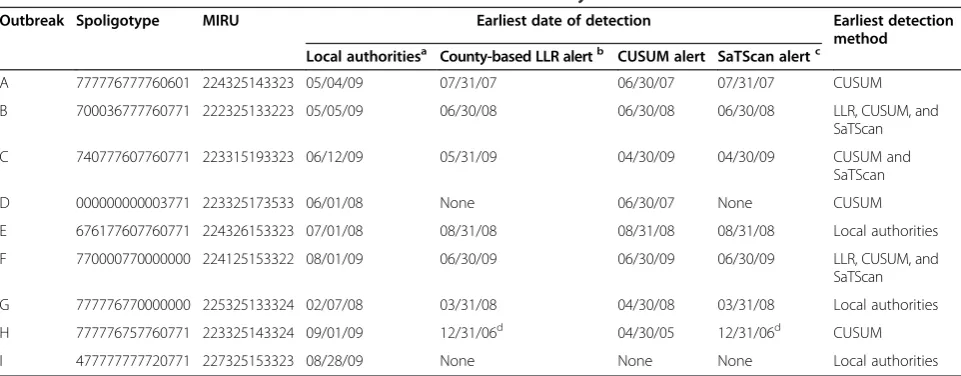
The retrospectively applied methods would have suc-cessfully identified six of the nine outbreaks before they were locally identified as a problem by the local public health authorities (Table 2). These statistical methods,
when taken together, would have issued an alert 1–52
months (median = 10 months) before the local public health authorities identified a problem.
Outbreak“D,”identified by local public health author-ities 11 months after the time it was detected by CUSUM, was confirmed to be a true outbreak but was not detected by either county-based LLR or SaTScan;
this outbreak’s genotype is the most commonly found
genotype in the United States. Outbreaks “E” and “G” were detected by local authorities approximately 2 months before being detected by an aberration detection
method. Outbreak “I” was not detected by any of our
methods, and is an example of a widely distributed out-break, involving 4 cases spread over 3 states and 4 differ-ent counties.
Time period
Of seven outbreaks detected using the county-based LLR method, one alerted 1 month earlier when using a 2-year time period versus a 3-year period for calculating the county-based LLR, four alerted at the same time, and two were not comparable due to data not being available before 2005 (data not shown). The time win-dow used for the SaTScan method had no effect on the timing of alerts; of seven outbreaks alerted by SaTScan with a 3-year window, five alerted at the same time when using a 2-year window, and the remaining two outbreaks were not comparable due to data not being available prior to 2005. Based on these results, we present subsequent data using a 2-year window.
Time period was not an issue for CUSUM as it detects temporal changes continuously using all cumulated data.
Table 2 Timeliness in detection of nine known tuberculosis outbreaks by local authorities and statistical method
Outbreak Spoligotype MIRU Earliest date of detection Earliest detection method Local authoritiesa County-based LLR alertb CUSUM alert SaTScan alertc
A 777776777760601 224325143323 05/04/09 07/31/07 06/30/07 07/31/07 CUSUM
B 700036777760771 222325133223 05/05/09 06/30/08 06/30/08 06/30/08 LLR, CUSUM, and
SaTScan
C 740777607760771 223315193323 06/12/09 05/31/09 04/30/09 04/30/09 CUSUM and
SaTScan
D 000000000003771 223325173533 06/01/08 None 06/30/07 None CUSUM
E 676177607760771 224326153323 07/01/08 08/31/08 08/31/08 08/31/08 Local authorities
F 770000770000000 224125153322 08/01/09 06/30/09 06/30/09 06/30/09 LLR, CUSUM, and
SaTScan
G 777776770000000 225325133324 02/07/08 03/31/08 04/30/08 03/31/08 Local authorities
H 777776757760771 223325143324 09/01/09 12/31/06d 04/30/05 12/31/06d CUSUM
I 477777777720771 227325153323 08/28/09 None None None Local authorities
Definition of abbreviations:CUSUM= cumulative sums;LLR= log-likelihood ratio;MIRU= Mycobacterial Interspersed Repetitive Units;TB GIMS= Tuberculosis Genotyping Information Management System.
a
Date that local public health authorities first noticed a problem.
b
Using a 2-year time window.
c
Using a 2-year time window and a 50 km maximum search radius.
d
SaTScan radius
When compared to a 50 km radius, running SaTScan with a maximum search radius of 20 km and 100 km had no substantial effect on the radius of the circle that defined the cluster, the LLR, or the number of outbreak cases included in the cluster for four of six alerted out-breaks examined (data not shown). One outbreak was split into two separate SaTScan clusters when a 20 km maximum search radius was used and one of the out-break cases was excluded; for this outout-break the SaTScan analyses with the 50 km and 100 km max-imum radius correctly grouped all the outbreak cases into one SaTScan cluster with the same circle radius and LLR. One outbreak had the same results for the 50 km and 100 km runs; however the 20 km analysis had a smaller radius defining the cluster (18.9 km vs. 36.2 km) and a slightly lower LLR, but all outbreak cases were still captured. Based on these results, we present subsequent SaTScan analyses using a 50 km maximum search radius.
Performance of the three statistical methods
Method 1: county-based LLR
Seven of the nine outbreaks would have alerted using the county-based LLR method and a 2-year time
win-dow. Four would have alerted 1–32 months before the
local public health authorities recognized the outbreak (median = 16 months earlier). Of the three remaining outbreaks, the county-based LLR would have alerted 2 months afterward for two and at approximately the same time for another.
Method 2: county-based CUSUM
Eight of the nine outbreaks would have been
detected by CUSUM. For six, CUSUM would have
alerted 1–52 months before local recognition of the
outbreak (median = 10 months earlier). For the two remaining outbreaks CUSUM would have alerted
ap-proximately 2–3 months afterward.
Compared with the timing of the county-based LLR, CUSUM would have alerted 1 month earlier for out-breaks“A” and“C,”and 1 month later for outbreak“G”; three outbreaks would have alerted at the same time. For the remaining outbreak (i.e., outbreak “H”), results were not comparable because the earliest date of alert for the county-based LLR method was limited by incom-plete TB GIMS data before 2005. For the outbreak not
detected by county-based LLR (i.e., outbreak “D”),
CUSUM would have alerted 11 months before the local public health authorities detected the problem.
Method 3: SaTScan
Seven of the nine outbreaks would have raised an alert using the SaTScan method with a maximum 50 km
search radius and a 2-year time window. For five, SaTScan would have alerted from 1 to 32 months before the local health department recognized the outbreak (median = 10 months earlier). SaTScan would have alerted about 2 months after the local health department for the other two outbreaks.
SaTScan raised alerts for the same seven outbreaks that would have been alerted using the county-based LLR method. Compared to the timing of alerts using county-based LLR, SaTScan would have alerted 1 month earlier for outbreak“C,” and the remaining six were the
same, although results for outbreak “H” were not
com-parable because the earliest detection date was limited by incomplete TB GIMS data before 2005.
Timeliness of the alerts
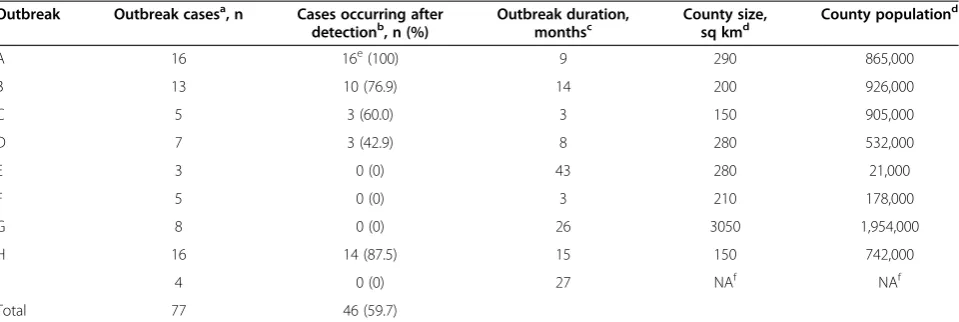
When our retrospectively applied alert methods were combined, 46 (59.7%) of the 77 outbreak patients (in-cluding both culture-positive and culture-negative cases) in the nine outbreaks occurred after the detection method would have signaled an alert but before the local public health authorities noticed the problem (Table 3). These results are based on an assumption of real-time data availability; this issue is addressed in detail in the discussion section.
Table 3 also includes the duration of each outbreak as well as a comparison of the geographical size and popu-lation of the counties where outbreaks occurred.
Discussion
Our results demonstrate that the three statistical methods, when applied retrospectively to routinely col-lected TB data, can successfully detect known TB out-breaks, potentially months before local public health authorities became aware of the problem. Early detec-tion of outbreaks allows more prompt intervendetec-tion po-tentially averting additional cases.
The three statistical methods we compared (county-based LLR, CUSUM, and SaTScan) showed similar re-sults and no single method was clearly superior. The methods were all, to some degree, based on geospatial concentration, and predictably did not identify outbreak
“I” where the TB diagnoses occurred in three different states, even thoughM. tuberculosistransmission had oc-curred in a single workplace [15]. County-based LLR
and SaTScan did not identify outbreak “D,” which was
associated with the most common genotype in the United States, accounting for 1,077 (4.1%) of the 25,973
TB cases with a genotype result during 2008–2009.
While county-based LLR and SaTScan have success-fully identified other outbreaks associated with com-mon genotypes (unpublished data), we do not yet have
consistently performs better than county-based LLR and SaTScan with common genotypes. Recent provements in our genotyping methods may also
im-prove our ability to detect outbreaks involving
common genotypes. In 2009, CDC expanded the rou-tine panel for Mycobacterial Interspersed Repetitive Units genotyping from 12 to 24 loci. This additional discriminatory power should increase the specificity of our detection methods, particularly for common TB strains such as the one associated with outbreak“D.”
For other diseases with shorter incubation periods, studies that have evaluated methods to detect outbreaks or aberrant clusters of disease have generally been tem-porally focused, often using syndromic surveillance data [1,16-18]. Some researchers have applied quality control schemes, such as CUSUM charts or variations on the CUSUM method, to detect shifts in reported counts of health events [2,19-23]. Others have used time series methods such as the autoregressive integrated moving average (ARIMA) model when cases of a disease are cyc-lical in nature and have seasonal trends [2,24-29]. Both methodologies use baseline data to establish expected counts in a given time interval, where the baseline period is typically defined using historical data that are repre-sentative of usual patterns in disease counts and do not reflect outbreaks or unusual events. Given the low inci-dence of TB in the United States and even lower counts of cases with a specific genotype, in addition to the often years-long incubation period for TB disease, our applica-tion of CUSUM involved sparse data. The lack of
genotyping data before 2005 limited our ability to use an historical period to define the baseline, which led to our use of multiple 2-year time windows to establish the CUSUM background rate; we plan on revisiting our de-termination of baselines when a longer period of geno-typing data is available.
Our examination of geospatial statistical methods was based on the assumption that TB transmission is mostly local [30-32]. Both the county-based LLR and SaTScan look for an elevated concentration of cases with a geno-type in a geographic area compared with the concentra-tion of that genotype outside the area. SaTScan addresses the bias introduced by the county-based LLR when cases are aggregated using a predefined geographic area [33]. Sensitivity analyses using different values of the SaTScan maximum search radius suggested that a scanning radius of 50 km was sufficient to detect the geographically concentrated outbreaks in this study.
Our analysis has several important limitations. First, the success of aberration detection methods fundamentally re-lies on the completeness, quality, and timeliness of the underlying data. Regarding the issue of missing data, sev-eral investigations in the United States have concluded that TB case detection and reporting are excellent [34-36]. All three methods use genotype data and genotyping is only possible on culture-positive TB cases, or approximately three quarters of TB cases reported to CDC [3]; 89% of culture-positive TB cases in 2009 had isolates submitted for genotyping. The omission of TB patients with culture-positive TB who do not have a genotyped isolate as well as Table 3 Tuberculosis cases occurring after outbreak detection by retrospectively applied statistical methods, 2008–2009
Outbreak Outbreak casesa, n Cases occurring after
detectionb, n (%) Outbreak duration,monthsc County size,sq kmd County population d
A 16 16e(100) 9 290 865,000
B 13 10 (76.9) 14 200 926,000
C 5 3 (60.0) 3 150 905,000
D 7 3 (42.9) 8 280 532,000
E 3 0 (0) 43 280 21,000
F 5 0 (0) 3 210 178,000
G 8 0 (0) 26 3050 1,954,000
H 16 14 (87.5) 15 150 742,000
I 4 0 (0) 27 NAf NAf
Total 77 46 (59.7)
a
Culture-positive and culture-negative cases reported in 2005–2009, and confirmed to be part of the outbreak at the end of the Centers for Disease Control and Prevention investigation.
b
Confirmed outbreak cases that occurred after the earliest date of detection among the three retrospectively applied statistical methods, and before the local public health authorities first noticed the outbreak.
c
Computed using culture-positive and culture-negative cases reported in 2005–2009, and confirmed to be part of the outbreak at the end of the Centers for Disease Control and Prevention investigation.
d
From 2010 U.S. Census, county size rounded to the nearest 10 sq km, county population rounded to nearest thousand persons.
e
Outbreak A included earlier cases that were not contained in the outbreak cases list developed during the investigation.
f
culture negative cases may affect the performance of our methods in terms of detecting outbreaks and timeliness of the alerts. Of note, we captured 78% of the cases confirmed to be part of the nine outbreaks (data not shown).
With respect to timeliness our retrospective analysis assumed no delays in reporting; however, delays in data availability are inevitable, and real-life performance of our outbreak detection methods will be less robust. The median time between specimen collection and availabil-ity of both genotyping and surveillance data for a pa-tient was 142 days when TB GIMS debuted in 2010 [37]. Factoring in a delay of 142 days (a delay antici-pated to decrease as TB GIMS use increases), our stat-istical methods would have issued an alert before local public health workers noticed the problem for four of the nine outbreaks.
Second, as demonstrated by outbreak“I,”our methods were only designed to detect outbreaks in geographic-ally limited areas. CUSUM or a purely temporal scan statistic could potentially detect geographically dis-persed outbreaks if applied on a national or regional level. Third, we examined outbreaks that were investi-gated by CDC, and our results may not be generalizable to all U.S. TB outbreaks.
Fourth, our analysis used known outbreaks to examine the sensitivity and timeliness, but not specificity, of the statistical methods studied. During the 2-year period 2009–2010 only 282 county-based clusters met the alert
threshold (LLR≥5) used in this paper and 590 SaTScan
clusters met the threshold of p<.05, but the proportion of these clusters that represent false-positive alerts is un-known. Our focus in this study was the sensitivity of our methods in retrospectively detecting outbreaks and is an important first step in the assessment of the value of statistical outbreak detection; the next step is an examination of specificity. In a recent study local health authorities investigated 24 TB clusters of 6 cases or more to determine which ones were out-breaks; an algorithm using the SaTscan method had a specificity of 83.3% (5 of 6 clusters determined not to be outbreaks were not alerted using the algorithm) [38].
Finally, the number of cases that occurred after the alerts and before detection by local authorities that could have been prevented is indeterminate.
In conclusion, the best future application of these stat-istical methods to outbreak detection might be to use all three approaches, while gaining experience about the relative uncertainty associated with each method’s per-formance and applying this experience to improve model accuracy. Determining how to interpret discrepant re-sults and exploring how to optimally set model input pa-rameters will be important steps as well. We are now prospectively examining the performance of these me-thods in detecting TB outbreaks.
Abbreviations
CDC:Centers for Disease Control and Prevention; CUSUM: Cumulative sums; LLR: Log-likelihood ratio; TB: Tuberculosis; TB GIMS: Tuberculosis Genotyping Information Management System.
Competing interests
The authors declare that they have no competing interests.
Authors’contributions
JG, TRN, and JSK provided the conception and design for the study. JSK, SA, MBH extracted and collected the data. NS, SA, JSK, MBH conducted the analyses and interpretation of results. JSK wrote the manuscript. JG and TRN provided overall study supervision. All authors participated in the review and approval of the manuscript.
Acknowledgements
The authors thank the staff from the National TB Genotyping Service Contract Laboratories, local and state public health laboratories, and local and state health departments who collected data included in these analyses. The authors also are grateful to Smita Ghosh, Dr. Patrick Moonan, and Dr. Michael Iademarco for their contributions to the manuscript. This work was supported by the Centers for Disease Control and Prevention.
Disclaimer
The opinions expressed by authors contributing to this journal do not necessarily reflect the opinions of the Centers for Disease Control and Prevention.
Received: 14 December 2012 Accepted: 11 March 2013 Published: 16 March 2013
References
1. Hutwagner LC, Thompson WW, Seeman GM, Treadwell T:A simulation model for assessing aberration detection methods used in public health surveillance for systems with limited baselines.Stat Med2005,24(4):543–550. 2. Hutwagner L, Thompson W, Seeman GM, Treadwell T:The bioterrorism
preparedness and response Early Aberration Reporting System (EARS).
J Urban Health2003,80(2 Suppl 1):i89–96.
3. CDC:Reported Tuberculosis in the United States.Atlanta, GA: U.S. Department of Health and Human Services, CDC; 2012.
4. CDC:New CDC program for rapid genotyping ofMycobacterium tuberculosisisolates.MMWR Morb Mortal Wkly Rep2005,54(2):47. 5. Ghosh S, Moonan PK, Cowan L, Grant J, Kammerer S, Navin TR:Tuberculosis
Genotyping Information Management System: enhancing tuberculosis surveillance in the United States.Infect Genet Evol2011,12(4):782–788. 6. Kulldorff M:A spatial scan statistic.Commun Statistics—Theory Meth1997,
26(6):1481–1496.
7. Mitruka K, Oeltmann JE, Ijaz K, Haddad MB:Tuberculosis outbreak investigations in the United States, 2002–2008.Emerg Infect Dis2011,
17(3):425–431.
8. Cowan LS, Diem L, Monson T, Wand P, Temporado D, Oemig TV, Crawford JT:
Evaluation of a two-step approach for large-scale, prospective genotyping of Mycobacterium tuberculosisisolates in the United States.J Clin Microbiol2005,
43(2):688–695.
9. Lucas JM:Counted data CUSUM's.Technometrics1985,27(2):129–144. 10. Sugumaran R, Larson SR, DeGroote JP:Spatio-temporal cluster analysis of
county-based human West Nile virus incidence in the continental United States.Int J Health Geogr2009,8:43.
11. Kulldorff M:Prospective time periodic geographical disease surveillance using a scan statistic.J R Statist S2001,164:61–72.
12. Kulldorff M, Athas WF, Feurer EJ, Miller BA, Key CR:Evaluating cluster alarms: a space-time scan statistic and brain cancer in Los Alamos, New Mexico.Am J Public Health1998,88(9):1377–1380.
13. Kulldorff M, Heffernan R, Hartman J, Assuncao R, Mostashari F:A space-time permutation scan statistic for disease outbreak detection.PLoS Med2005,
2(3):e59.
14. Robertson C, Nelson TA:Review of software for space-time disease surveillance.Int J Health Geogr2010,9:16.
15. Barry PM, Gardner TJ, Funk E, Oren E, Field K, Shaw T, Langer AJ:Multistate outbreak of MDR TB identified by genotype cluster investigation.
16. Heffernan R, Mostashari F, Das D, Karpati A, Kulldorff M, Weiss D:Syndromic surveillance in public health practice, New York City.Emerg Infect Dis 2004,10(5):858–864.
17. Siswoyo H, Permana M, Larasati RP, Farid J, Suryadi A, Sedyaningsih ER:
EWORS: using a syndromic-based surveillance tool for disease outbreak detection in Indonesia.BMC Proc2008,2(3):S3.
18. Wagner MM, Espino J, Tsui FC, Gesteland P, Chapman W, Ivanov O, Moore A, Wong W, Dowling J, Hutman J:Syndrome and outbreak detection using chief-complaint data: experience of the Real-Time Outbreak and Disease Surveillance project.MMWR Morb Mortal Wkly Rep2004,
53(Suppl):28–31.
19. Woodall WH:The use of control charts in health-care and public-health surveillance.J Qual Tech2006,38(2):89–104.
20. Hutwagner L, Browne T, Seeman GM, Fleischauer AT:Comparing aberration detection methods with simulated data.Emerg Infect Dis2005,
11(2):314–316.
21. Rogerson PA, Yamada I:Approaches to syndromic surveillance when data consist of small regional counts.MMWR Morb Mortal Wkly Rep2004,
53(Suppl):79–85.
22. Watkins RE, Eagleson S, Veenendaal B, Wright G, Plant AJ:Applying cusum-based methods for the detection of outbreaks of Ross River virus disease in Western Australia.BMC Med Inform Decis Mak2008,8:37. 23. Bradley CA, Rolka H, Walker D, Loonsk J:BioSense: implementation of a
National Early Event Detection and Situational Awareness System.
MMWR Morb Mortal Wkly Rep2005,54(Suppl):11–19.
24. Liu QY, Liu XD, Jiang BF, Yang WZ:Forecasting incidence of hemorrhagic fever with renal syndrome in China using ARIMA model.BMC Infect Dis 2011,11:218.
25. Permanasari AE, Rambli DRA, Dominic PDD:Performance of univariate forecasting on seasonal diseases: the case of tuberculosis.InSoftware Tools and Algorithms for Biological Systems Edited by Arabnia HR, Tran QN. New York: Springer; 2011:171–179.
26. Wangdi K, Singhasivanon P, Silawan T, Lawpoolsri S, White NJ,
Kaewkungwal J:Development of temporal modelling for forecasting and prediction of malaria infections using time-series and ARIMAX analyses: a case study in endemic districts of Bhutan.Malaria J2010,9:89. 27. Allard R:Use of time-series analysis in infectious disease surveillance.
Bull World Health Organ1998,76(4):327–333.
28. Rios M, Garcia JM, Cubedo M, Perez D:Analysis of temporary series in the epidemiology of typhoid fever in Spain.Medicina Clinica1996,106(18):686–689. 29. Reis BY, Mandl KD:Time series modeling for syndromic surveillance.
BMC Med Inform Decis Mak2003,3:2.
30. Perri BR, Proops D, Moonan PK, Munsiff SS, Kreiswirth BN, Kurepina N, Goranson C, Ahuja SD:Mycobacterium tuberculosiscluster with developing drug resistance, New York, New York, USA, 2003–2009.
Emerg Infect Dis2011,17(3):372–378.
31. Barnes PF, Cave MD:Molecular epidemiology of tuberculosis.N Engl J Med 2003,349(12):1149–1156.
32. Barnes PF, Yang Z, Pogoda JM, Preston-Martin S, Jones BE, Otaya M, Knowles L, Harvey S, Eisenach KD, Cave MD:Foci of tuberculosis transmission in central Los Angeles.Am J Respir Crit Care Med1999,159(4 Pt 1):1081–1086. 33. Dark SJ, Bram D:The modifiable areal unit problem (MAUP) in physical
geography.Prog Phys Geog2007,31(5):471–479.
34. Curtis AB, McCray E, McKenna M, Onorato IM:Completeness and timeliness of tuberculosis case reporting: a multistate study.Am J Prev Med2001,20(2):108–112.
35. Decrease in reported tuberculosis cases—United States, 2009.MMWR Morb Mortal Wkly Rep2010,59(10):289–294.
36. Assessment of declines in reported tuberculosis cases—Georgia and Pennsylvania, 2009.MMWR Morb Mortal Wkly Rep2011,60(11):338–342. 37. Baker B:The TB Genotyping Information Management System—an
Assessment of Timeliness 6 Months after Launch.TB Notes2011,2:22–23. 38. Althomsons SP, Kammerer JS, Shang N, Navin TR:Using routinely reported
tuberculosis genotyping and surveillance data to predict tuberculosis outbreaks.PLoS One2012,7(11):e48754.
doi:10.1186/1476-072X-12-15
Cite this article as:Kammereret al.:Using statistical methods and genotyping to detect tuberculosis outbreaks.International Journal of Health Geographics201312:15.
Submit your next manuscript to BioMed Central and take full advantage of:
• Convenient online submission
• Thorough peer review
• No space constraints or color figure charges
• Immediate publication on acceptance
• Inclusion in PubMed, CAS, Scopus and Google Scholar
• Research which is freely available for redistribution