R E S E A R C H
Open Access
Chronic physical conditions, multimorbidity
and physical activity across 46 low- and
middle-income countries
Davy Vancampfort
1,2*, Ai Koyanagi
3,4, Philip B. Ward
5,6, Simon Rosenbaum
7, Felipe B. Schuch
8,9, James Mugisha
10,11,
Justin Richards
12, Joseph Firth
13and Brendon Stubbs
14,15Abstract
Background:There are no nationally representative population-based studies investigating the relationship between physical activity, chronic conditions and multimorbidity (i.e., two or more chronic conditions) in low- and middle-income countries (LMICs), and studies on a multi-national level are lacking. This is an important research gap, given the rapid increase in the prevalence of chronic diseases associated with lifestyle changes in these countries. This cross-sectional study aimed to assess the association between chronic conditions, multimorbidity and low physical activity (PA) among community-dwelling adults in 46 LMICs, and explore the mediators of these relationships.
Methods:World Health Survey data included 228,024 adults aged≥18 years from 46 LMICs. PA was assessed by the International Physical Activity Questionnaire (IPAQ). Nine chronic physical conditions (chronic back pain, angina, arthritis, asthma, diabetes, hearing problems, tuberculosis, visual impairment and edentulism) were assessed. Multivariable logistic regression and mediation analyses were used to assess the association between chronic conditions or multimorbidity and low PA.
Results:Overall, in the multivariable analysis, arthritis (OR = 1.12), asthma (1.19), diabetes (OR = 1.33), edentulism (OR = 1.46), hearing problems (OR = 1.90), tuberculosis (OR = 1.24), visual impairment (OR = 2.29), multimorbidity (OR = 1.31; 95% CI = 1.21–1.42) were significantly associated with low PA. More significant associations were observed in individuals aged≥50 years. In older adults, depression mediated between 5.1% (visual impairment) to 23.5% (angina) of the association between a chronic condition and low PA. Mobility difficulties explained more than 25% of the association for seven of the eight chronic conditions. Pain was a strong mediator for angina (65.9%) and arthritis (64.9%), while sleep problems mediated up to 43.7% (angina) of the association.
Conclusions:In LMICs, those with chronic conditions and multimorbidity are significantly less physically active (especially older adults). Research on the efficacy and effectiveness of PA in the management of chronic diseases in LMICs is urgently needed. Targeted promotion of physical activity to populations in LMICs experiencing chronic conditions may ameliorate associated depression, mobility difficulties and pain that are themselves important barriers for initiating or adopting an active lifestyle.
Keywords:Multimorbidity, Pain, Mobility limitation, Depression, Sleep, Physical activity, Arthritis, Angina pectoris, Diabetes mellitus
* Correspondence:davy.vancampfort@uc-kortenberg.be 1
Department of Rehabilitation Sciences, KU Leuven, Tervuursevest 101, Leuven 3001, Belgium
2KU Leuven, University Psychiatric Center KU Leuven, Leuvensesteenweg 517, Kortenberg 3070, Belgium
Full list of author information is available at the end of the article
Background
While the average life expectancy is increasing world-wide, the number of years lived with disability with vari-ous chronic conditions is also rising [1, 2]. Of particular concern is the increasing global burden of angina [3], arthritis [4], asthma [5], chronic back pain [6], diabetes [7], oral diseases, such as edentulism [8], hearing prob-lems [9], tuberculosis [10], and visual impairments [11], mainly due to population growth and aging of the worldwide population. There is also an increasing recog-nition that in the years to come, this disease burden and the loss of economic output associated with chronic dis-eases will be greatest in low- and middle-income coun-tries (LMICs) [12].
Recently, more research has noted the burden of mul-timorbidity (i.e., two or more chronic conditions) [13]. In a meta-analysis [14] of 70,057,611 primary care pa-tients in 12 countries, the prevalence of multimorbidity ranged from 12.9 to 95.1%. The prevalence of multimor-bidity is increasing, mainly due to the growing incidence of chronic conditions and increasing life-expectancy [15], and it is undoubtedly one of the most significant challenges faced by global health care providers [16]. Multimorbidity is associated with a lower quality of life [17], increased health-care utilization and costs [18], and ultimately, higher risk for premature mortality [19]. The worldwide evolving disease burden [1], along with a growing understanding of multimorbidity and its risk factors [20], necessitates a continuum of care.
Within the multifaceted care of individuals with chronic disease and multimorbidity, the promotion of physical ac-tivity is extensively supported in the published literature [21]. Regular physical activity contributes to the primary and secondary prevention of a wide range of chronic dis-eases [21], improves quality of life [22] and is associated with reduced risk of premature death [23]. However, to date, most of the research investigating associations be-tween physical activity, chronic diseases and multimorbid-ity has focused on high-income countries. For example, in a Spanish study [24] involving 22,190 adults, an inverse association was found between multimorbidity and levels of physical activity participation in the youngest and oldest age groups. In addition, both low self-rated health status and functional limitations were related to lower physical activity in most of the examined population groups. In an English nationally representative cohort of people aged≥50 years (n= 15,688) [25], compared to the phys-ically inactive group, the odds ratio (OR) for multimor-bidity was 0.84 (95% confidence interval (CI) = 0.78– 0.91) in the mild, 0.61 (95% CI = 0.56–0.66) in the mod-erate, and 0.45 (95% CI = 0.41–0.49) in the vigorous physical activity groups.
However, to the best of our knowledge, there are no nationally representative population-based studies
investigating the associations between physical activity be-havior, chronic conditions and multimorbidity in LMICs. Moreover, to the best of our knowledge there are no stud-ies investigating physical activity and multimorbidity on a multi-national level. This is an important research gap given the rapid increase in chronic diseases in these coun-tries, mainly due to changes in lifestyle [1]. Furthermore, the association between chronic conditions or multimor-bidity on physical activity behavior may differ in LMICs due to different disease profiles [26], suboptimal treatment of chronic conditions [27, 28], differences in knowledge regarding the benefits of physical activity [29], or other en-vironmental factors such as work conditions [30]. In addition, at the population level, there is a paucity of infor-mation on factors that might influence the relationship between physical activity, chronic diseases and multimor-bidity. Such information could guide the design and deliv-ery of targeted interventions.
Given the aforementioned gaps within the literature, we aimed to assess the association between chronic conditions or multimorbidity and low physical activity (i.e., not achiev-ing international physical activity recommendations) among community-dwelling adults in 46 LMICs, and to assess the factors that might influence this relationship. We hypothesize that low physical activity is associated with the presence of chronic conditions and multimorbidity.
Methods
Settings and protocol
The World Health Survey (WHS) was a cross-sectional study undertaken in 2002–2004 in 70 countries world-wide. Single-stage random sampling and stratified multi-stage random cluster sampling were conducted in 10 and 60 countries respectively. The details of the survey have been provided elsewhere (http://www.who.int/healthinfo/ survey/en/). Briefly, all those aged ≥18 years with a valid home address were eligible to participate. Each member of the household had equal probability of being selected with the use of Kish tables. The data were collected in all countries using the same set of questionnaires with some countries however using a shorter version. The individual response rate ranged from 63% (Israel) to 99% (Philippines) [31]. Ethical approval was obtained from ethical boards at each study site. Sampling weights were generated to adjust for non-response and the popu-lation distribution reported by the United Nations Statis-tical Division. Informed consent was obtained from all participants.
Physical activity
Specifically, participants were asked how much over the past week on average they engaged in moderate and vigor-ous physical activity. Those scoring≥150 min were classi-fied as meeting the recommended guidelines and those scoring <150 min (low physical activity) were classified as not meeting the recommended guidelines.
Physical health conditions
A total of nine physical conditions were assessed, repre-senting all physical conditions available in the WHS. Arthritis, asthma and diabetes were based on self-reported lifetime diagnosis. For angina, in addition to a self-reported diagnosis, a symptom-based diagnosis based on the Rose questionnaire was also used [33]. Chronic back pain was defined as having had back pain (including disc problems) every day during the last 30 days. Visual impairment was defined as having extreme difficulty in seeing and recognizing a person that the participant knows across the road (i.e., from a distance about 20 m) [34]. A validity study showed that this response generally corre-sponds to World Health Organization definitions of visual impairment [34]. The participant was considered to have hearing problems if the interviewer observed this condition at the end of the survey. Edentulism was assessed by the question“Have you lost all your natural teeth?”Those who responded affirmatively were considered to have edentu-lism. Finally, a tuberculosis diagnosis was based on past 12-month symptoms and was defined as: 1) having had a cough that lasted for three weeks or longer; and 2) having had blood in phlegm or coughed up blood [35]. In line with a previous publication using the same dataset [36], we calculated the total number of these conditions while allowing for one missing variable in order to retain a larger sample size. Multimorbidity was defined as having at least two of the assessed chronic conditions.
Health status and depression
Participants’health status was evaluated with six health-related questions pertaining to three health domains in-cluding (a) mobility; (b) pain and discomfort; (c) sleep and energy (Additional file 1). These domains have been used as indicators of functional health status in prior studies utilizing the WHS dataset [37–39]. Each domain consists of two questions that assessed health function in the past 30 days. Each item was scored on a five-point scale ranging from‘none’to‘extreme/cannot do’. For each separate domain, we used a factor analysis to obtain a fac-tor score which was later converted to scores ranging from 0 to 100 [37, 39] with higher values representing worse health function. In order to determine the presence of depression, the DSM-IV algorithm was used, based on the duration and persistence of depressive symptoms in the previous 12 months [40].
Control variables
The control variables included sex, age, highest educa-tional level achieved (no formal education, primary edu-cation, secondary or high school completed, or tertiary education completed) and wealth. Principal component analysis based on 15–20 assets was performed to estab-lish country-wise wealth quintiles.
Statistical analysis
Data from 69 countries were publically available. Of these countries, 10 countries (Austria, Belgium, Denmark, Germany, Greece, Guatemala, Italy, Netherlands, Slovenia, UK) were deleted as sampling information was missing. Furthermore, 10 high-income countries (Finland, France, Ireland, Israel, Luxembourg, Norway, Portugal, Sweden, Spain, United Arab Emirates) were omitted as the focus of the study was on LMICs. Of the remaining LMICs, Morocco and Latvia were not included as they lacked information on physical activity, and Turkey was also excluded due to lack of several variables pertaining to the analysis. Thus, a total of 46 countries, which were all LMICs according to the World Bank classification in 2003, were included in the analysis [41] (see Table 1). We stratified the analyses by age (18–34, 35–49, 50– 64, ≥65 years) as chronic conditions are known to be much more prevalent in the older population. Differ-ences in sample characteristics by age group were eval-uated by Chi-squared tests. Across all countries, we conducted multivariable logistic regression analysis to as-sess the association between chronic conditions (angina, arthritis, asthma, chronic back pain, diabetes, edentulism, hearing problem, tuberculosis, visual impairment) or mul-timorbidity (exposure variables) and low physical activity (outcome variable) while adjusting for age, sex, wealth, education and country. Each chronic condition and multimorbidity were included separately in the models. Furthermore, based on the results of these analyses, we conducted mediational analysis to evaluate underlying factors that may explain the link between chronic con-ditions or multimorbidity and low physical activities among those aged ≥50 years. We only included the older age group for this analysis as most of the signifi-cant association between chronic conditions (or multi-morbidity) and low physical activity were only observed in the older age groups. We did not conduct this ana-lysis for chronic back pain as this condition was not significantly associated with low physical activity in ei-ther of the older age groups.
Table 1Prevalence of low physical activity by country and age groups
Country N Overall Age 18–34 years Age 35–49 years Age 50–64 years Age≥65 years
Bangladesh 5552 22.3 [20.0,24.7] 18.9 [16.2,21.9] 16.6 [13.9,19.8] 31.5 [27.7,35.6] 61.3 [54.3,67.9] Bosnia Herzegovina 1028 25.7 [22.0,29.9] 17.2 [12.2,23.7] 13.2 [8.3,20.4] 38.1 [27.6,49.9] 58.9 [48.2,68.8] Brazil 5000 33.6 [31.5,35.7] 28.4 [25.9,31.1] 30.2 [27.3,33.4] 39.5 [35.4,43.7] 61.2 [56.7,65.6] Burkina Faso 4824 14.4 [12.6,16.4] 9.2 [7.6,11.2] 12.1 [9.5,15.2] 25.8 [21.0,31.4] 56.4 [48.5,64.1]
Chad 4644 39.0 [31.6,46.9] 35.5 [28.3,43.6] 40.8 [32.3,49.8] 45.1 [36.2,54.2] 51.5 [40.7,62.2]
China 3993 39.3 [31.6,47.6] 36.9 [26.7,48.5] 30.8 [23.0,39.9] 37.2 [30.3,44.7] 69.4 [60.9,76.7]
Comoros 1759 9.6 [7.5,12.2] 6.4 [4.3,9.5] 4.5 [2.4,8.4] 10.5 [7.1,15.4] 28.2 [20.9,36.7]
Croatia 990 26.4 [23.3,29.7] 17.0 [11.7,24.1] 17.5 [12.7,23.5] 28.8 [22.8,35.7] 45.0 [37.6,52.5] Czech Republic 935 35.6 [30.6,41.0] 23.3 [18.1,29.5] 29.7 [20.8,40.3] 35.9 [27.0,45.8] 66.8 [55.4,76.5] Dominican Republic 4534 58.9 [56.1,61.6] 55.8 [51.8,59.7] 58.3 [53.9,62.7] 59.6 [53.9,65.0] 78.6 [72.4,83.7] Ecuador 4654 39.2 [33.5,45.2] 38.0 [31.3,45.1] 37.9 [30.8,45.6] 37.0 [27.2,48.0] 60.9 [46.5,73.6] Estonia 1011 20.0 [16.7,23.7] 13.2 [9.7,17.7] 16.9 [12.6,22.2] 17.7 [13.2,23.2] 36.9 [29.0,45.5]
Ethiopia 4937 5.4 [4.2,7.0] 4.5 [3.1,6.4] 3.7 [2.6,5.4] 7.0 [4.5,10.6] 24.7 [15.4,37.2]
Georgia 2755 32.1 [26.5,38.2] 29.5 [22.7,37.3] 28.1 [21.4,35.9] 24.6 [19.5,30.5] 51.3 [44.3,58.2]
Ghana 3935 29.5 [27.2,32.0] 27.7 [24.5,31.2] 26.9 [23.7,30.3] 31.6 [27.1,36.5] 51.8 [45.5,58.1]
Hungary 1419 18.6 [15.9,21.6] 14.6 [11.1,19.0] 14.3 [10.2,19.7] 14.6 [10.8,19.4] 35.8 [29.2,42.9]
India 9988 18.9 [15.5,22.9] 14.6 [10.9,19.3] 15.7 [13.0,18.7] 22.3 [18.0,27.4] 45.6 [36.2,55.4]
Ivory Coast 3184 36.4 [32.7,40.2] 36.6 [32.3,41.0] 30.8 [25.8,36.3] 37.4 [30.6,44.8] 61.0 [49.8,71.2] Kazakhstan 4496 38.6 [31.0,46.8] 33.8 [27.6,40.7] 32.7 [25.6,40.8] 46.0 [35.2,57.2] 64.0 [48.9,76.8]
Kenya 4412 12.4 [9.8,15.5] 11.4 [8.5,15.1] 13.1 [9.5,17.8] 12.7 [7.9,19.9] 22.4 [15.7,30.9]
Laos 4888 26.3 [24.3,28.4] 21.6 [19.1,24.2] 22.3 [19.9,24.9] 34.8 [31.0,38.9] 62.3 [55.6,68.6]
Malawi 5289 16.5 [14.8,18.4] 16.2 [14.1,18.5] 14.2 [12.4,16.2] 15.8 [11.4,21.4] 27.9 [20.9,36.1] Malaysia 6040 31.8 [30.1,33.5] 29.7 [27.4,32.2] 26.1 [23.6,28.8] 37.7 [34.2,41.4] 56.6 [51.1,61.9]
Mali 3856 18.4 [15.6,21.5] 14.8 [11.5,18.9] 16.8 [12.7,21.9] 23.3 [17.1,30.9] 56.3 [44.0,67.9]
Mauritania 3795 81.8 [78.2,85.0] 79.7 [75.0,83.7] 79.6 [74.8,83.7] 88.5 [84.4,91.7] 93.7 [88.0,96.8] Mauritius 3888 29.5 [26.0,33.3] 25.5 [21.4,29.9] 23.1 [19.2,27.4] 35.2 [30.1,40.7] 60.7 [53.6,67.4] Mexico 38,745 31.5 [30.1,32.9] 28.8 [27.3,30.4] 29.1 [27.4,30.9] 34.5 [32.5,36.6] 49.9 [47.4,52.3] Myanmar 5886 24.1 [20.7,27.8] 19.5 [16.1,23.5] 19.3 [15.8,23.3] 29.9 [25.2,35.0] 58.4 [52.3,64.2] Namibia 4246 48.7 [46.3,51.0] 43.3 [40.2,46.5] 50.6 [46.3,54.8] 56.5 [50.7,62.2] 63.8 [56.8,70.3]
Nepal 8686 14.7 [13.7,15.8] 11.6 [10.3,13.1] 11.7 [10.3,13.3] 17.6 [15.2,20.3] 45.5 [41.4,49.6]
can be applied to logistic regression models and decom-poses the total effect into direct and indirect effects. Using this method, the mediated percentage (percentage of the main association explained by the mediator) can also be calculated. Each potential mediator was included in the models separately, and the models were adjusted for age, sex, education, wealth and country. For all analyses, ad-justment for country was done by including dummy vari-ables for each country as in previous WHS publications [37, 44]. The percentage of missing values for all the vari-ables used in this study were <10% with the exception of the number of chronic conditions (10.9%), edentulism (12.2%), and tuberculosis (15.0%). Complete-case analysis was done. The sample weighting and the complex study design were taken into account in all analyses. Results from the logistic regression models are presented as odds ratios (ORs) with 95% confidence intervals (CIs). The level of statistical significance was set atP< 0.05. The statistical analysis was performed with Stata 14.1 (Stata Corp LP, College station, Texas).
Results
The final sample consisted of 228,024 individuals aged ≥18 years. Of these individuals, 97,841 (47.9%), 68,657 (27.5%), 37,688 (16.0%), and 23,838 (8.6%) were aged 18–34, 35–49, 50–64 and≥65 years respectively. The prevalence of low physical activity in the overall sample was 29.2% (95% CI = 28.3–30.0%). The corresponding fig-ures by age group were: 18–34 years [25.1% (24.2–26.1%)]; 35–49 years [25.5% (24.6–26.5%)]; 50–64 years [34.9% (33.5–36.3%)]; and ≥65 years [53.3% (51.4–55.2%)]. The overall prevalence of low physical activity ranged from 5.4% (Ethiopia) to 81.8% (Mauritania) (Table 1).
More than half of the population also engaged in low physical activities in South Africa (66.6%), Uruguay (63.9%), the Dominican Republic (58.9%), and Pakistan (51.1%). Older individuals were significantly more likely to be fe-males, have lower education and wealth, chronic conditions and a higher number of chronic conditions (Table 2).
For most chronic conditions, the prevalence of low physical activity increased in a linear fashion with in-creasing age. There was a particularly high prevalence of low physical activity among those with visual impair-ment and diabetes especially among the older popula-tion (Fig. 1).
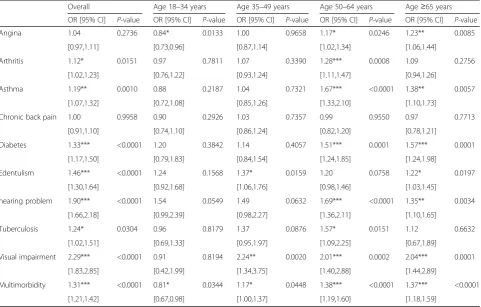
The results of the multivariable logistic regression ana-lysis assessing the association between chronic conditions or multimorbidity and low physical activity are presented in Table 3. In the overall sample, arthritis, asthma, dia-betes, edentulism, hearing problems, tuberculosis, visual impairment and multimorbidity were significantly associ-ated with low physical activity. When the analysis was stratified by age groups, most significant associations only existed in the older age groups (i.e., ≥50 years). For ex-ample, the ORs (95% CIs) for the following conditions among those aged 50–64 years were: angina 1.17 (1.02– 1.34); arthritis 1.28 (1.11–1.47); asthma 1.67 (1.33–2.10); diabetes 1.51 (1.24–1.85); hearing problem 1.69 (1.36– 2.11); tuberculosis 1.57 (1.09–2.25); visual impairment 2.01 (1.40–2.88); and multimorbidity 1.38 (1.19–1.60).
The results of the mediation analysis among those aged≥50 years are shown in Table 4. The indirect effect was significant in all analyses. For the individual chronic conditions, depression mediated 5.1% (visual impairment) to 23.5% (angina) of the association between the chronic condition and low physical activity. Mobility difficulties explained more than 25% of the association for seven out of the eight chronic conditions with particularly high mediated percentages observed for angina (95.3%) and arthritis (67.8%). Pain was a major mediator for angina (65.9%) and arthritis (64.9%), and sleep problems medi-ated between 5.9% (edentulism) to 43.7% (angina) of the association. In terms of multimorbidity, depression, mobility difficulties, pain and sleep mediated 12.5, 56.4, 38.7 and 21.6% of the association respectively.
Discussion
General findings
To the best of our knowledge, the current study is the first large-scale (n= 228,024), multinational (46 LMICs) analysis investigating chronic conditions, multimorbidity and low levels of physical activity. We found that most chronic conditions were associated with low physical ac-tivity in the overall sample, although this relationship was most notable among the older population. Our me-diational analysis for the older age group showed that mobility difficulties was an important factor for most of the chronic conditions studied, while pain was a central factor for angina and arthritis. Depression and sleep prob-lems also explained a large proportion of these associations, particularly for angina. As for multimorbidity, mobility
Table 1Prevalence of low physical activity by country and age groups(Continued)
Vietnam 3492 17.9 [14.0,22.5] 11.6 [8.5,15.6] 13.9 [10.2,18.7] 26.0 [19.0,34.4] 50.6 [41.0,60.2] Zambia 3808 25.6 [22.9,28.5] 23.6 [20.4,27.0] 24.7 [20.8,29.1] 26.8 [21.5,33.0] 45.5 [36.5,54.7] Zimbabwe 4092 20.3 [18.5,22.3] 17.4 [15.2,19.8] 19.9 [15.9,24.6] 22.7 [18.5,27.5] 43.9 [35.4,52.7] Data are unweighted N and % [95% confidence interval]
difficulties and pain were important factors mediating low physical activity. The identification of mediators offers po-tential targets for future public health interventions and our study provides important information. For example, in the overall sample, those with arthritis were less likely to achieve the physical activity recommendations (OR = 1.12). This significant association was mediated by depressive feelings, pain, mobility and sleep problems. Arthritis is as-sociated with pain which might cause mobility and sleep problems and ultimately feelings of depression, which in turn will be a barrier for physical activity participation [45]. The current data indicate that similar vicious cycles may also exist for other chronic conditions and multimorbidity.
Although there is no rigorous evidence that physical activity has a direct effect on the pathogenesis of arth-ritis [21], there is evidence that physical activity reduces pain [46] and depression [47] and improves sleep [48] and functionality [49] in people with arthritis. In terms of the training effect on mobility impairments, the im-mediate mechanism of action may be through improved
balance, muscle strength and endurance [21]. If there is any sign of acute joint inflammation and/or a worsening of symptoms, the affected joint should rest until a drug treatment has taken effect [21]. Also the nature of the training can be varied to include, for example, aquatic exercises [50], although this will not always be possible in most low resourced settings. A similar line of action can be proposed for people with tuberculosis. Low phys-ical activity in people with tuberculosis is mainly medi-ated through infection-relmedi-ated anemia and is associmedi-ated with elevated acute phase response [51]. In the acute stages, pharmacotherapy is primordial [52]. To the best of our knowledge, there is no evidence for the beneficial effects of physical activity on the management of tuber-culosis, and tuberculosis should rather be considered a barrier for physical activity participation. However, it could be hypothesized that physical activity might im-prove conditions associated with tuberculosis such as pain, depression and functional limitations, although re-search to confirm this is needed. In contrast, there is Table 2Sample characteristics (overall and by age group)
Characteristic Total Age 18–34 years Age 35–49 years Age 50–64 years Age≥65 years P-value
Age (years) Mean (SD) 38.4 (16.1) 25.0 (4.5) 41.1 (4.4) 55.7 (4.4) 72.2 (7.0)
Sex Female 50.8 49.5 50.3 52.6 56.2 <0.0001
Education No formal 26.1 19.3 27.5 36.5 40.1 <0.0001
≤Primary 31.0 31.7 31.0 29.5 30.7
Secondary completed 33.7 39.8 31.6 24.8 22.9
Tertiary completed 9.2 9.3 10.0 9.3 6.3
Wealth Poorest 20.1 19.3 19.6 19.8 27.3 <0.0001
Poorer 20.0 19.3 19.9 20.6 22.5
Middle 19.9 20.3 19.6 19.5 19.5
Richer 20.0 20.6 20.2 19.8 16.1
Richest 20.0 20.5 20.7 20.4 14.6
Chronic conditions Angina 14.6 8.9 14.3 22.2 32.5 <0.0001
Arthritis 13.0 6.0 12.6 24.1 33.3 <0.0001
Asthma 5.2 3.9 4.8 7.0 9.6 <0.0001
Chronic back pain 6.6 3.2 6.8 10.9 16.6 <0.0001
Diabetes 3.0 0.7 2.6 7.3 9.0 <0.0001
Edentulism 5.9 1.5 3.5 10.9 28.9 <0.0001
Hearing problem 3.4 1.0 1.8 4.5 20.0 <0.0001
Tuberculosis 1.7 1.3 1.5 2.5 2.6 <0.0001
Visual impairment 1.3 0.4 0.9 2.2 6.4 <0.0001
Number of chronic conditions 0 65.3 78.8 65.7 45.7 25.1 <0.0001
1 21.7 16.8 23.5 29.8 28.2
2 8.5 3.6 8.2 15.6 23.5
3 3.1 0.7 2.1 6.4 14.0
≥4 1.4 0.1 0.5 2.5 9.2
Data are weighted column % unless otherwise stated
rigorous evidence for the beneficial effects of physical activity in chronic conditions such as diabetes, angina and low chronic back pain [21]. Health care profes-sionals need to consider barriers, such as pain, sleep and mobility problems, in addition to condition-specific contra-indications.
In people with diabetes, physical activity interventions should be delayed until acute high blood sugar levels have been corrected [21]. Low-cost methods to assess blood sugar levels in low resourced settings need to be developed. In the case of active proliferative retinopathy, it is recommended that high-intensity training or training involving Valsalva maneuvers be avoided [21]. Strength training should be done with light weights and at low con-traction velocity. In the case of neuropathy and the risk of foot ulcers, body-bearing activities should be avoided as repeated strain on neuropathic feet can lead to ulcers and fracture. Non-body-bearing exercise is recommendable such as cycling and swimming [21], but other strategies
for resource-limited settings should be explored. Physical activity is not a contra-indication for stable (at least 5 days) angina [53] nor for chronic back pain [21] or asthma [21]. Effectiveness studies are needed to explore how inter-national guidelines for these chronic conditions such as 12 weeks supervised training with individually organized training programs after an initial exercise test: two to five sessions a week of 30–60-min at an intensity of 50–80% of the maximum exercise capacity and/or daily low-intensity training walking over 30 min, increasing over time under the supervision of the rehabilitation team [21], can be im-plemented in resource-limited settings.
participation in these populations. In the same way, negative self-perceptions associated with edentulism might, particularly in younger patients, be a barrier for participation in physical activity [56].
Practical implications and future research
The key to management of chronic conditions and multi-morbidity is to strengthen a multidisciplinary approach simultaneously targeting both lifestyle factors and physical health outcomes (e.g., risk for chronic diseases, multimor-bidity). In LMICs, in addition to economic restraints, other challenges may also undermine the development of effective and sustainable primary and secondary interven-tions. For example, implementing non-pharmacological interventions may be difficult in LMICs, due to the pre-dominant biomedical model of practice within existing healthcare systems [57]. Results from a qualitative study that explored treatment adherence among patients with diabetes, hypertension or both, in a South-African com-munity, suggest that factors that may influence adherence to behavior change interventions may be multifactorial,
including the attribution of the origin of the illness, negative experiences with the public healthcare system, financial problems, transport problems and lack of social support [58]. Our analyses show that strategies to deal with lifestyle factors, such as physical inactivity, are ur-gently needed in LMICs, particularly targeting the earlier stages of disease.
First of all, there is a clear need to increase awareness of the importance of considering physical activity partici-pation among care providers in LMICs. Continued med-ical education should be used to inform care providers on the importance of assessing physical activity levels and how cognitive behavioral principles (e.g., goal setting, problem-solving etc.) can be employed to assist patients to increase physical activity levels. We propose a dual strategy of developing both a smaller group of master trainers/supervisors (e.g., exercise physiologists and physiotherapists) and researchers and a larger group of practitioners (e.g., nurses) trained in the basics of cognitive behavioral physical activity strategies. This method has been successfully employed for cognitive behavioral Table 3Associations between chronic conditions or multimorbidity and low physical activity (outcome) estimated by multivariable logistic regression
Overall Age 18–34 years Age 35–49 years Age 50–64 years Age≥65 years
OR [95% CI] P-value OR [95% CI] P-value OR [95% CI] P-value OR [95% CI] P-value OR [95% CI] P-value
Angina 1.04 0.2736 0.84* 0.0133 1.00 0.9658 1.17* 0.0246 1.23** 0.0085
[0.97,1.11] [0.73,0.96] [0.87,1.14] [1.02,1.34] [1.06,1.44]
Arthritis 1.12* 0.0151 0.97 0.7811 1.07 0.3390 1.28*** 0.0008 1.09 0.2756
[1.02,1.23] [0.76,1.22] [0.93,1.24] [1.11,1.47] [0.94,1.26]
Asthma 1.19** 0.0010 0.88 0.2187 1.04 0.7321 1.67*** <0.0001 1.38** 0.0057
[1.07,1.32] [0.72,1.08] [0.85,1.26] [1.33,2.10] [1.10,1.73]
Chronic back pain 1.00 0.9958 0.90 0.2926 1.03 0.7357 0.99 0.9550 0.97 0.7713
[0.91,1.10] [0.74,1.10] [0.86,1.24] [0.82,1.20] [0.78,1.21]
Diabetes 1.33*** <0.0001 1.20 0.3842 1.14 0.4057 1.51*** 0.0001 1.57*** 0.0001
[1.17,1.50] [0.79,1.83] [0.84,1.54] [1.24,1.85] [1.24,1.98]
Edentulism 1.46*** <0.0001 1.24 0.1568 1.37* 0.0159 1.20 0.0758 1.22* 0.0197
[1.30,1.64] [0.92,1.68] [1.06,1.76] [0.98,1.46] [1.03,1.45]
hearing problem 1.90*** <0.0001 1.54 0.0549 1.49 0.0632 1.69*** <0.0001 1.35** 0.0034
[1.66,2.18] [0.99,2.39] [0.98,2.27] [1.36,2.11] [1.10,1.65]
Tuberculosis 1.24* 0.0304 0.96 0.8179 1.37 0.0876 1.57* 0.0151 1.12 0.6632
[1.02,1.51] [0.69,1.33] [0.95,1.97] [1.09,2.25] [0.67,1.89]
Visual impairment 2.29*** <0.0001 0.91 0.8194 2.24** 0.0020 2.01*** 0.0002 2.04*** 0.0001
[1.83,2.85] [0.42,1.99] [1.34,3.75] [1.40,2.88] [1.44,2.89]
Multimorbidity 1.31*** <0.0001 0.81* 0.0344 1.17* 0.0448 1.38*** <0.0001 1.37*** <0.0001
[1.21,1.42] [0.67,0.98] [1.00,1.37] [1.19,1.60] [1.18,1.59]
All models are adjusted for age, sex, wealth, education and country
The total amount of moderate to vigorous physical activity over the last week was calculated and those scoring <150 min were considered to have low physical activity
Table 4Depression and other health status as mediators in the association between chronic conditions and low physical activity among older adults (aged≥50 years)
Total effect Direct effect Indirect effect
Exposure Mediator OR [95% CI] P-value OR [95% CI] P-value OR [95% CI] P-value % Mediated
Angina Depression 1.17 [1.05–1.29] 0.0040 1.12 [1.01–1.25] 0.0283 1.04 [1.02–1.05] <0.0001 23.5 Mobility 1.16 [1.05–1.28] 0.0050 1.01 [0.91–1.12] 0.8970 1.15 [1.12–1.18] <0.0001 95.3 Pain/discomfort 1.18 [1.06–1.30] 0.0015 1.06 [0.96–1.17] 0.2790 1.11 [1.08–1.15] <0.0001 65.9 Sleep/energy 1.17 [1.06–1.30] 0.0021 1.09 [0.99–1.21] 0.0868 1.07 [1.05–1.10] <0.0001 43.7 Arthritis Depression 1.19 [1.07–1.33] 0.0018 1.16 [1.04–1.30] 0.0067 1.02 [1.01–1.04] <0.0001 13.7 Mobility 1.20 [1.07–1.34] 0.0016 1.06 [0.94–1.19] 0.3286 1.13 [1.10–1.16] <0.0001 67.8 Pain/discomfort 1.18 [1.06–1.32] 0.0027 1.06 [0.95–1.19] 0.3142 1.12 [1.08–1.15] <0.0001 64.9 Sleep/energy 1.18 [1.06–1.32] 0.0024 1.13 [1.01–1.26] 0.0377 1.05 [1.03–1.07] <0.0001 30.2 Asthma Depression 1.55 [1.29–1.85] <0.0001 1.50 [1.25–1.79] <0.0001 1.03 [1.02–1.05] 0.0002 7.6
Mobility 1.52 [1.29–1.78] <0.0001 1.34 [1.14–1.57] 0.0004 1.13 [1.10–1.17] <0.0001 30.3 Pain/discomfort 1.55 [1.31–1.84] <0.0001 1.44 [1.22–1.70] <0.0001 1.08 [1.05–1.11] <0.0001 17.3 Sleep/energy 1.56 [1.31–1.86] <0.0001 1.48 [1.24–1.76] <0.0001 1.05 [1.03–1.08] <0.0001 11.8 Diabetes Depression 1.48 [1.27–1.74] <0.0001 1.45 [1.24–1.69] <0.0001 1.03 [1.01–1.04] 0.0004 6.8
Mobility 1.54 [1.32–1.80] <0.0001 1.35 [1.15–1.57] 0.0002 1.14 [1.11–1.18] <0.0001 31.2 Pain/discomfort 1.51 [1.29–1.76] <0.0001 1.40 [1.20–1.64] <0.0001 1.08 [1.05–1.10] <0.0001 17.6 Sleep/energy 1.51 [1.29–1.76] <0.0001 1.44 [1.24–1.68] <0.0001 1.05 [1.03–1.07] <0.0001 11.2 Edentulism Depression 1.20 [1.04–1.40] 0.0143 1.19 [1.03–1.38] 0.0217 1.01 [1.00–1.02] 0.0110 6.7
Mobility 1.25 [1.07–1.46] 0.0041 1.23 [1.05–1.43] 0.0090 1.02 [1.00–1.04] 0.0281 8.7 Pain/discomfort 1.20 [1.04–1.39] 0.0142 1.18 [1.02–1.37] 0.0264 1.02 [1.01–1.03] 0.0051 9.2 Sleep/energy 1.20 [1.04–1.39] 0.0137 1.19 [1.03–1.38] 0.0204 1.01 [1.00–1.02] 0.0141 5.9 Hearing problem Depression 1.43 [1.22–1.67] <0.0001 1.39 [1.19–1.64] <0.0001 1.02 [1.01–1.04] 0.0005 6.3 Mobility 1.52 [1.30–1.78] <0.0001 1.37 [1.17–1.60] 0.0001 1.11 [1.08–1.14] <0.0001 25.6 Pain/discomfort 1.52 [1.31–1.76] <0.0001 1.42 [1.23–1.65] <0.0001 1.07 [1.04–1.09] <0.0001 15.5 Sleep/energy 1.47 [1.26–1.73] <0.0001 1.42 [1.21–1.66] <0.0001 1.04 [1.02–1.06] <0.0001 10.0 Tuberculosis Depression 1.35 [0.98–1.86] 0.0689 1.27 [0.92–1.76] 0.1480 1.06 [1.03–1.10] 0.0008 20.2 Mobility 1.37 [0.99–1.88] 0.0553 1.21 [0.88–1.66] 0.2472 1.13 [1.07–1.20] <0.0001 39.7 Pain/discomfort 1.39 [1.01–1.90] 0.0412 1.28 [0.93–1.75] 0.1283 1.09 [1.05–1.13] <0.0001 25.4 Sleep/energy 1.40 [1.01–1.92] 0.0409 1.32 [0.96–1.81] 0.0929 1.06 [1.03–1.09] 0.0001 17.6 Visual impairment Depression 2.12 [1.61–2.77] <0.0001 2.04 [1.55–2.67] <0.0001 1.04 [1.02–1.06] 0.0006 5.1
Mobility 2.10 [1.60–2.77] <0.0001 1.67 [1.27–2.20] 0.0002 1.26 [1.20–1.32] <0.0001 30.9 Pain/discomfort 2.10 [1.61–2.75] <0.0001 1.84 [1.41–2.40] <0.0001 1.14 [1.10–1.19] <0.0001 17.9 Sleep/energy 2.12 [1.62–2.77] <0.0001 1.92 [1.47–2.50] <0.0001 1.11 [1.07–1.15] <0.0001 13.4 Multimorbidity Depression 1.37 [1.23–1.54] <0.0001 1.32 [1.18–1.48] <0.0001 1.04 [1.02–1.06] <0.0001 12.5 Mobility 1.36 [1.22–1.52] <0.0001 1.14 [1.02–1.29] 0.0236 1.19 [1.15–1.23] <0.0001 56.4 Pain/discomfort 1.38 [1.24–1.54] <0.0001 1.22 [1.09–1.36] 0.0006 1.13 [1.09–1.18] <0.0001 38.7 Sleep/energy 1.37 [1.23–1.53] <0.0001 1.28 [1.15–1.43] <0.0001 1.07 [1.04–1.10] <0.0001 21.6 Models are adjusted for age, sex, education, wealth and country
The total amount of moderate to vigorous physical activity over the last week was calculated and those scoring <150 min were considered to have low physical activity
Multimorbidity refers to two or more chronic conditions. Depression = presence in the past 12 months (DSM-IV). Mobility problems, pain/discomfort and sleep/ energy problems = presence in the past 30 days; each item was scored on a five-point scale ranging from‘none’to‘extreme/cannot do’. For each separate domain, we used a factor analysis to obtain a factor score which was later converted to scores ranging from 0 to 100
therapy in trials in LMICs [59, 60]. A stepped-care ap-proach, where patients start with self-management, may be a feasible strategy in LMIC settings. Then, if patients do not achieve guideline- specific levels of physical activ-ity, they could continue with a manualized approach under the supervision of a non-specialist worker (e.g., nurses, occupational therapists). Patients would only be referred to a specialist supervisor (e.g., exercise physiolo-gists and physiotherapists) if no significant increase in physical activity levels occurs, for example due to pain, sleep problems or mobility problems. It is known that in-clusion of exercise physiologists or physiotherapists re-duces drop out rates from physical activity interventions and consequently improves outcomes [61]. Careful con-sideration of what physical activity implementation strat-egies would be most efficacious, and evaluation of this stepped-care approach, is essential for chronic conditions. The current available evidence is, however, solely based on evidence from high-income countries. Efficacy trials of physical activity interventions among people with chronic conditions in different cultural settings across LMICs are urgently needed. In addition, effectiveness trials in diverse cultural settings could explore whether assisting people in fulfilling the following three universal and psychological needs will increase the likelihood that they adopt or main-tain the prescribed recommendations/interventions of physical activity: (a) the need for autonomy (i.e., experien-cing a sense of psychological freedom when engaging in physical activity), (b) the need for competence (i.e., ability to attain desired outcomes following the physical activity program), and (c) the need for relatedness (i.e., being so-cially connected when being physically active). If the effi-cacy and effectiveness of physical activity interventions are well established in better equipped scientific settings with research staff trained in physical activity prescription, the final step will be to fund interventions and initiatives to translate research findings into “real-world” settings while exploring its cost-effectiveness. In order to justify the inclusion of physical activity programs as a routine component in the treatment of chronic diseases and multimorbidity in LMICs, cost-benefit analyses should be conducted in order to quantify the financial implica-tions of diverting resources or investing funds into such initiatives. Therefore, next to intervention studies explor-ing the efficacy of physical activity programs, effectiveness research capable of driving practice change, along with policy-level research, is urgently required. Ministries of health and education will play a critical role in this governance and policy development step.
If research shows that physical activity is efficacious and effective in the prevention and management of chronic diseases in LMICs, physical activity should be mainstreamed in existing health systems at all levels of care. Governments of LMICs will need to provide
appropriate environments for physical activity including, space, infrastructure and tools. Such affirmative action is already required. Governmental and non-governmental agencies need to increase public health awareness of the importance of physical activity in people with chronic conditions. For example, physical activity should be inte-grated into the existing Information, Education and Communication public health awareness programs of the World Health Organization. Targeted messages should be developed in order to make these campaigns affordable. The benefits of engaging in physical activity should be properly outlined; any fears and wrongly held beliefs within various cultural contexts dispelled and, ap-propriate initiations steps (e.g., starting at a low inten-sity) and methods to maintain an active lifestyle should be included in community awareness programs.
Limitations and strengths
calculating the total number of chronic conditions. This was done to retain a larger sample size but some level of misclassification may exist. Nonetheless, the strengths of the study include the multi-national scope focused on LMICs, countries which are under-represented in the prior research literature. Additionally, we clarified numer-ous important mediators that can be targeted for future physical activity interventions.
Conclusions
The current study demonstrates that individuals with chronic conditions and multimorbidity are significantly more likely to engage in low levels of physical activity. Research on the efficacy and effectiveness of physical ac-tivity in management of chronic diseases and multimor-bidity in LMICs should be a priority for funding bodies. When an evidence base is built, physical activity needs to be mainstreamed in existing health policies and strat-egies at all levels of care. To this end, policy makers and budget holders will need to invest in physical activity as part of a multidisciplinary treatment package for a wide range of chronic conditions, while health professionals will need to improve their physical activity assessment and prescriptions skills. Physiotherapists and exercise physiologists might assist in complex cases where pain, mobility difficulties, sleep problems and depression are important barriers for initiating or adopting an active lifestyle. Finally, (inter) national agencies will do well to increase public health awareness of the importance of physical activity in people with chronic diseases and multimorbidity in LMICs.
Additional file
Additional file 1: Table S1.Questions used to assess health status. (DOCX 11 kb)
Abbreviations
CI:Confidence interval; LMICs: Low- and middle-income countries; OR: Odds ratio; WHS: World Health Survey
Acknowledgements None.
Funding
Brendon Stubbs receives funding from the National Institute for Health Research Collaboration for Leadership in Applied Health Research & Care Funding scheme. Ai Koyanagi’s work is supported by the Miguel Servet contract financed by the CP13/00150 and PI15/00862 projects, integrated into the National R + D + I and funded by the ISCIII - General Branch Evaluation and Promotion of Health Research - and the European Regional Development Fund (ERDF-FEDER). Davy Vancampfort is funded by the Research Foundation–Flanders (FWO–Vlaanderen). The views expressed in this publication are those of the authors and not necessarily those of the any funding agencies.
Availability of data and materials
The datasets generated during and/or analyzed during the current study are available in the World Health Survey repository, available at http:// www.who.int/healthinfo/survey/en/.
Authors’contributions
Access to the World Health Survey data collection was obtained by Dr. Brendon Stubbs. Analyses were performed by Dr. Ai Koyanagi and Dr. Brendon Stubbs. Dr. Davy Vancampfort wrote a first draft which was reviewed and revised in several rounds by the other co-authors. All authors approved the final version and all authors certify that they have participated sufficiently in the work to believe in its overall validity and to take public responsibility for appropriate portions of its content.
Competing interests
The authors declare that they have no competing interests.
Consent for publication Not applicable.
Ethics approval and consent to participate
Ethical approval was obtained from ethical boards at each study site. Participants give written informed consent. Details are available at http://www.who.int/healthinfo/survey/en/.
Author details
1Department of Rehabilitation Sciences, KU Leuven, Tervuursevest 101, Leuven 3001, Belgium.2KU Leuven, University Psychiatric Center KU Leuven, Leuvensesteenweg 517, Kortenberg 3070, Belgium.3Research and Development Unit, Parc Sanitari Sant Joan de Déu, Universitat de Barcelona, Fundació Sant Joan de Déu, Dr. Antoni Pujadas, 42, Sant Boi de Llobregat, Barcelona 0883, Spain.4Instituto de Salud Carlos III, Centro de Investigación Biomédica en Red de Salud Mental, CIBERSAM, Monforte de Lemos 3-5 Pabellón 11, Madrid 28029, Spain.5School of Psychiatry, UNSW, Sydney, Australia.6Schizophrenia Research Institute, Ingham Institute of Applied Medical Research, Liverpool, NSW, Australia.7Exercise Physiology Department, School of Medical Sciences, UNSW Australia, Sydney, Australia. 8
Hospital de Clínicas de Porto Alegre, Porto Alegre, Brazil.9Programa de Pós Graduação em Ciências Médicas: Psiquiatria, Universidade Federal do Rio Grande do Sul, Porto Alegre, Brazil.10Kyambogo University, Kampala, Uganda. 11Butabika National Referral and Mental Health Hospital, Kampala, Uganda. 12
School of Public Health & Charles Perkins Centre, University of Sydney, Sydney, Australia.13School of Health Sciences, Division of Psychology & Mental Health, University of Manchester, Manchester, UK.14Physiotherapy Department, South London and Maudsley NHS Foundation Trust, Denmark Hill, London SE5 8AZ, UK.15Health Service and Population Research Department, Institute of Psychiatry, Psychology and Neuroscience, King’s College London, Box SE5 8AF, De Crespigny Park, London, UK.
Received: 11 August 2016 Accepted: 5 January 2017
References
1. Murray CJ, Barber RM, Foreman KJ, Abbasoglu Ozgoren A, Abd-Allah F, Abera SF, Aboyans V, Abraham JP, Abubakar I, Abu-Raddad LJ, et al. Global, regional, and national disability-adjusted life years (DALYs) for 306 diseases and injuries and healthy life expectancy (HALE) for 188 countries, 1990–2013: quantifying the epidemiological transition. Lancet. 2015;386:2145–91. 2. Vos T, Flaxman AD, Naghavi M, Lozano R, Michaud C, Ezzati M, Shibuya K,
Salomon JA, Abdalla S, Aboyans V, et al. Years lived with disability (YLDs) for 1160 sequelae of 289 diseases and injuries 1990–2010: A systematic analysis for the Global Burden of Disease Study 2010. Lancet. 2012;380:2163–96. 3. Moran AE, Forouzanfar MH, Roth G, Mensah GA, Ezzati M, Flaxman A,
Murray CJ, Naghavi M. The global burden of ischemic heart disease in 1990 and 2010: the Global Burden of Disease 2010 study. Circulation. 2014;129(14):1493–501.
prevalence, and years lived with disability for 301 acute and chronic diseases and injuries in 188 countries, 1990–2013: a systematic analysis for the Global Burden of Disease Study 2013. Lancet. 2015;386:743–800. 6. Hoy D, March L, Brooks P, Blyth F, Woolf A, Bain C, Williams G, Smith E, Vos T,
Barendregt J. The global burden of low back pain: estimates from the Global Burden of Disease 2010 study. Ann Rheum Dis. 2014;73(6):968–74. 7. Beulens JW, Grobbee DE, Nealb B. The global burden of diabetes and its
complications: an emerging pandemic. Eur J Cardiovasc Prev Rehabil. 2010;17:s3–8.
8. Jin L, Lamster I, Greenspan J, Pitts N, Scully C, Warnakulasuriya S. Global burden of oral diseases: emerging concepts, management and interplay with systemic health. Oral Dis. 2016;22(7):609–19.
9. Stevens G, Flaxman S, Brunskill E, Mascarenhas M, Mathers CD, Finucane M. Global and regional hearing impairment prevalence: an analysis of 42 studies in 29 countries. Eur J Publ Health. 2013;23:146–52.
10. Raviglione M, Sulis G. Tuberculosis 2015: burden, challenges and strategy for control and elimination. Infect Dis Rep. 2016;8(2):6570.
11. Stevens GA, White RA, Flaxman SR, Price H, Jonas JB, Keeffe J, Leasher J, Naidoo K, Pesudovs K, Resnikoff S. Global prevalence of vision impairment and blindness: magnitude and temporal trends, 1990–2010. Ophthalmology. 2013;120:2377–84.
12. Abegunde DO, Mathers CD, Adam T, Ortegon M, Strong K. The burden and costs of chronic diseases in low-income and middle-income countries. Lancet. 2007;370:1929–38.
13. Fortin M, Stewart M, Poitras M-E, Almirall J, Maddocks H. A systematic review of prevalence studies on multimorbidity: toward a more uniform methodology. Ann Fam Med. 2012;10:142–51.
14. Violan C, Foguet-Boreu Q, Flores-Mateo G, Salisbury C, Blom J, Freitag M, Glynn L, Muth C, Valderas JM. Prevalence, determinants and patterns of multimorbidity in primary care: a systematic review of observational studies. PLoS One. 2014;9:e102149.
15. Uijen AA, van de Lisdonk EH. Multimorbidity in primary care: prevalence and trend over the last 20 years. Eur J Gen Pract. 2008;14:28–32. 16. Salisbury C. Multimorbidity: redesigning health care for people who use it.
Lancet. 2012;380:7–9.
17. Fortin M, Lapointe L, Hudon C, Vanasse A, Ntetu AL, Maltais D. Multimorbidity and quality of life in primary care: a systematic review. Health Qual Life Outcomes. 2004;2:1.
18. Lehnert T, Heider D, Leicht H, Heinrich S, Corrieri S, Luppa M, Riedel-Heller S, König H-H. Health care utilization and costs of elderly persons with multiple chronic conditions. Med Care Res Rev. 2011;68:387–420.
19. Gallo JJ, Hwang S, Joo JH, Bogner HR, Morales KH, Bruce ML, Reynolds III CF. Multimorbidity, depression, and mortality in primary care: randomized clinical trial of an evidence-based depression care management program on mortality risk. J Gen Int Med. 2016;31:380–6.
20. Barnett K, Mercer SW, Norbury M, Watt G, Wyke S, Guthrie B. Epidemiology of multimorbidity and implications for health care, research, and medical education: a cross-sectional study. Lancet. 2012;380:37–43.
21. Pedersen B, Saltin B. Exercise as medicine–evidence for prescribing exercise as therapy in 26 different chronic diseases. Scand J Med Sci Sports. 2015;25:1–72.
22. Bertheussen GF, Romundstad PR, Landmark T, Kaasa S, Dale O, Helbostad JL. Associations between physical activity and physical and mental health–a HUNT 3 study. Med Sci Sports Exerc. 2011;43:1220–8.
23. Hupin D, Roche F, Gremeaux V, Chatard J-C, Oriol M, Gaspoz J-M, Barthélémy J-C, Edouard P. Even a low-dose of moderate-to-vigorous physical activity reduces mortality by 22% in adults aged≥60 years: a systematic review and meta-analysis. Br J Sports Med. 2015;49:1262–7. 24. Cimarras-Otal C, Calderón-Larrañaga A, Poblador-Plou B, González-Rubio F,
Gimeno-Feliu LA, Arjol-Serrano JL, Prados-Torres A. Association between physical activity, multimorbidity, self-rated health and functional limitation in the Spanish population. BMC Publ Health. 2014;14:1.
25. Dhalwani NN, O’Donovan G, Zaccardi F, Hamer M, Yates T, Davies M, Khunti K. Long terms trends of multimorbidity and association with physical activity in older English population. Int J Behav Nutr Phys Act. 2016;13:8.
26. Forouzanfar MH, Alexander L, Anderson HR, Bachman VF, Biryukov S, Brauer M, Burnett R, Casey D, Coates MM, Cohen A. Global, regional, and national comparative risk assessment of 79 behavioural, environmental and occupational, and metabolic risks or clusters of risks in 188 countries, 1990–2013: a systematic analysis for the Global Burden of Disease Study 2013. Lancet. 2015;386:2287–323.
27. Chow CK, Teo KK, Rangarajan S, Islam S, Gupta R, Avezum A, Bahonar A, Chifamba J, Dagenais G, Diaz R. Prevalence, awareness, treatment, and control of hypertension in rural and urban communities in high-, middle-, and low-income countries. JAMA. 2013;310:959–68.
28. Patel V, Araya R, Chatterjee S, Chisholm D, Cohen A, De Silva M, Hosman C, McGuire H, Rojas G, van Ommeren M. Treatment and prevention of mental disorders in low-income and middle-income countries. Lancet. 2007;370:991–1005.
29. Pengpid S, Peltzer K, Kassean HK, Tsala JPT, Sychareun V, Müller-Riemenschneider F. Physical inactivity and associated factors among university students in 23 low-, middle-and high-income countries. Int J Publ Health. 2015;60:539–49. 30. Atkinson K, Lowe S, Moore S. Human development, occupational structure
and physical inactivity among 47 low and middle income countries. Prev Med Rep. 2016;3:40–5.
31. Moussavi S, Chatterji S, Verdes E, Tandon A, Patel V, Ustun B. Depression, chronic diseases, and decrements in health: results from the World Health Surveys. Lancet. 2007;370:851–8.
32. Vancampfort D, De Hert M, Skjerven LH, Gyllensten AL, Parker A, Mulders N, Nyboe L, Spencer F, Probst M. International Organization of Physical Therapy in Mental Health consensus on physical activity within multidisciplinary rehabilitation programmes for minimising cardio-metabolic risk in patients with schizophrenia. Disabil Rehabil. 2012;34:1–12.
33. Rose GA. The diagnosis of ischaemic heart pain and intermittent claudication in field surveys. Bull World Health Organ. 1962;27:645–58. 34. Freeman EE, Roy-Gagnon MH, Samson E, Haddad S, Aubin MJ, Vela C,
Zunzunegui MV. The global burden of visual difficulty in low, middle, and high income countries. PLoS One. 2013;8:e63315.
35. Goldhaber-Fiebert JD, Jeon CY, Cohen T, Murray MB. Diabetes mellitus and tuberculosis in countries with high tuberculosis burdens: individual risks and social determinants. Int J Epidemiol. 2011;40:417–28.
36. Stubbs B, Koyanagi A, Veronese N, Vancampfort D, Solmi M, Gaughran F, Carvalho AF, Lally J, Mitchell AJ, Mugisha J. Physical multimorbidity and psychosis: comprehensive cross sectional analysis including 242,952 people across 48 low-and middle-income countries. BMC Med. 2016;14:189.
37. Nuevo R, Chatterji S, Verdes E, Naidoo N, Arango C, Ayuso-Mateos JL. The continuum of psychotic symptoms in the general population: a cross-national study. Schizophr Bull. 2012;38:475–85.
38. Nuevo R, Van Os J, Arango C, Chatterji S, Ayuso-Mateos JL. Evidence for the early clinical relevance of hallucinatory-delusional states in the general population. Acta Psychiatr Scand. 2013;127:482–93.
39. Koyanagi A, Oh H, Stickley A, Haro JM, DeVylder J. Risk and functional significance of psychotic experiences among individuals with depression in 44 low- and middle-income countries. Psychol Med. 2016;46(12):2655–65. 40. Cifuentes M, Sembajwe G, Tak S, Gore R, Kriebel D, Punnett L. The association
of major depressive episodes with income inequality and the human development index. Soc Sci Med. 2008;67:529–39.
41. Worldbank. Classification of economies. Washington DC; 2004. http:// siteresources.worldbank.org/INTRGEP2004/Resources/classification.pdf. Accessed 15 May 2016.
42. Koyanagi A, Garin N, Olaya B, Ayuso-Mateos JL, Chatterji S, Leonardi M, Koskinen S, Tobiasz-Adamczyk B, Haro JM. Chronic conditions and sleep problems among adults aged 50 years or over in nine countries: a multi-country study. PLoS One. 2014;9:e114742.
43. Breen R, Karlson KB, Holm A. Total, direct, and indirect effects in logit and probit models. Soc Method Res. 2013;42:164–91.
44. Koyanagi A, Stickley A. The association between sleep Problems and psychotic symptoms in the general population: a global perspective. Sleep. 2015;38:1875–85.
45. Stubbs B, Hurley M, Smith T. What are the factors that influence physical activity participation in adults with knee and hip osteoarthritis? A systematic review of physical activity correlates. Clin Rehabil. 2015;29:80–94.
46. Fransen M, McConnell S, Harmer AR, Van der Esch M, Simic M, Bennell KL. Exercise for osteoarthritis of the knee. Cochrane Database Syst Rev. 2015;49(24):1554–7.
47. Kelley GA, Kelley KS, Hootman JM. Effects of exercise on depression in adults with arthritis: a systematic review with meta-analysis of randomized controlled trials. Arthritis Res Ther. 2015;17:21.
49. Hernández-Hernández MV, Díaz-González F. Role of physical activity in the management and assessment of rheumatoid arthritis patients. Reumatol Clín. 2016. doi: 10.1016/j.reuma.2016.04.003
50. Bartels EM, Juhl CB, Christensen R, Hagen KB, Danneskiold‐Samsøe B, Dagfinrud H, Lund H. Aquatic exercise for the treatment of knee and hip osteoarthritis. Cochrane Database Syst Rev. 2016. doi: 10.1002/14651858. CD005523.pub3
51. Faurholt-Jepsen M, Faurholt-Jepsen D, Range N, Praygod G, Jeremiah K, Aabye M, Changalucha J, Krarup H, Christensen DL, Andersen Å. The use of combined heart rate response and accelerometry to assess the level and predictors of physical activity in tuberculosis patients in Tanzania. Epidemiol Infect. 2014;142:1334–42.
52. Wallis RS, Maeurer M, Mwaba P, Chakaya J, Rustomjee R, Migliori GB, Marais B, Schito M, Churchyard G, Swaminathan S. Tuberculosis—advances in development of new drugs, treatment regimens, host-directed therapies, and biomarkers. Lancet Infect Dis. 2016;16:e34–46.
53. Giannuzzi P, Mezzani A, Saner H, Bj√∂rnstad H, Fioretti P, Mendes M, Cohen-Solal A, Dugmore L, Hambrecht R, Hellemans I. Physical activity for primary and secondary prevention. Position paper of the Working Group on Cardiac Rehabilitation and Exercise Physiology of the European Society of Cardiology. Eur J Cardiovasc Prev Rehabil. 2003;10:319–27.
54. Gispen FE, Chen DS, Genther DJ, Lin FR. Association between hearing impairment and lower levels of physical activity in older adults. J Am Geriatr Soc. 2014;62:1427–33.
55. Marmeleira J, Laranjo L, Marques O, Pereira C. Physical activity patterns in adults who are blind as assessed by accelerometry. Adapt Phys Act Quart. 2014;31:283–96.
56. Mesas AE, De Andrade SM, Cabrera MAS. Factors associated with negative self‐perception of oral health among elderly people in a Brazilian community. Gerodontology. 2008;25:49–56.
57. Mugisha J, Ssebunnya J, Kigozi FN. Towards understanding governance issues in integration of mental health into primary health care in Uganda. Int J Ment Health Syst. 2016;10:1.
58. Kagee A, Le Roux M, Dick J. Treatment adherence among primary care patients in a historically disadvantaged community in South Africa a qualitative study. J Health Psychol. 2007;12:444–60.
59. Naeem F, Saeed S, Irfan M, Kiran T, Mehmood N, Gul M, Munshi T, Ahmad S, Kazmi A, Husain N. Brief culturally adapted CBT for psychosis (CaCBTp): a randomized controlled trial from a low income country. Schizophr Res. 2015;164:143–8.
60. Naeem F, Sarhandi I, Gul M, Khalid M, Aslam M, Anbrin A, Saeed S, Noor M, Fatima G, Minhas F. A multicentre randomised controlled trial of a carer supervised culturally adapted CBT (CaCBT) based self-help for depression in Pakistan. J Affect Disord. 2014;156:224–7.
61. Vancampfort DRS, Schuch FB, Ward PB, Probst M, Stubbs B. Prevalence and predictors of treatment dropout from physical activity interventions in schizophrenia: a meta-analysis. Gen Hosp Psychiatr. 2015;39:15–23. 62. Biswas A, Oh PI, Faulkner GE, Bajaj RR, Silver MA, Mitchell MS, Alter DA.
Sedentary time and its association with risk for disease incidence, mortality, and hospitalization in adults: a systematic review and meta-analysis. Ann Int Med. 2015;162:123–32.
63. Diederichs C, Berger K, Bartels DB. The measurement of multiple chronic diseases—a systematic review on existing multimorbidity indices. J Gerontol A Biol Sci Med Sci. 2011;66:301–11.
• We accept pre-submission inquiries
• Our selector tool helps you to find the most relevant journal
• We provide round the clock customer support
• Convenient online submission
• Thorough peer review
• Inclusion in PubMed and all major indexing services
• Maximum visibility for your research
Submit your manuscript at www.biomedcentral.com/submit