R E S E A R C H
Open Access
Post hoc evaluation of analytic rating scales
for improved functioning in the assessment
of interactive L2 speaking ability
Kurtis McDonald
1,2Correspondence:
1English Education Research Center, Kobe College, 4-1 Okadayama, Nishinomiya, Hyogo 662-8505, Japan
2Graduate College of Education, Temple University, Japan Campus, Osaka, Japan
Abstract
This study was designed to determine how well existing analytic rating scales functioned in the assessment of low- to mid-proficiency Japanese university students’interactive English speaking ability when engaged in small group
discussions. Many-facet Rasch measurement (MFRM) was employed to evaluate the quality of adapted rating scales forcomplexity,accuracy, andfluency(CAF),interaction, andcommunicative effectiveness. The video-recorded performances of 64 participants who completed 10-min group discussion tasks at the beginning and end of their first semester of university study were independently rated by four experienced raters using 9-point rating scales and the resulting scores were subjected to many-facet Rasch measurement (MFRM). Although the scores demonstrated acceptable fit to the Rasch model, closer inspection of the data using Linacre’s (J Appl Meas 3:85–
106,2002a) guidelines for post hoc evaluation of rating scale category quality
revealed multiple problems with the 9-point scales and suggested four major revisions were likely to improve the scales for use in this context. The resulting five 5-point rating scales developed through these revisions were then used by the same raters to reassess the same task performances. The 5-point rating scale data was then subjected to the same manner of MFRM analyses and found to demonstrate notably improved functioning and quality.
Keywords:Analytic rating scales, Interactive L2 speaking ability, Many-facet Rasch measurement (MFRM), Rating scale categorization, Rating scale functioning
In many educational contexts, the assessment of second language (L2) speaking and writing performances relies on the use of rating scales to award scores to language learners based upon criteria deemed most appropriate to the purposes of the assess-ment. Composed of a specified range of hierarchical descriptors intended to represent distinct levels of ability within a domain, rating scales can be holistic, awarding one score based on an overall impression, oranalytic, awarding scores across a number of criteria. Analytic rating scales, perhaps more commonly known as scoring rubrics, are particularly appealing in many L2 performance assessment situations because they can provide a great deal of information about learners’language abilities across a number of different dimensions with relatively little investment of time or specialized know-ledge required. Furthermore, the use of analytic rating scales can help keep assessment efforts closely aligned with teaching and learning objectives and provide meaningful feedback to not only instructors and administrators, but to the learners themselves.
Although analytic rating scales are widely used in L2 performance assessments, their many benefits cannot be merely assumed from their use alone, especially when employed in high-stakes testing situations or fine-grained research studies. Whether created through experts’intuitive judgments or the adaptation of existing rating scales from one assessment context to another, it is essential to investigate the utility of rating scales empirically in order to make sure that the data they provide is of the highest quality (Bond and Fox2015; Linacre2002a). Fortunately, concomitant with the growing use of rater-mediated L2 performance assessments has come increased recognition of the need for post hoc evaluation of rating scales through statistical analyses such as many-facet Rasch measurement (MFRM). First formally outlined by Linacre (1989,
1994) based on Rasch’s (1960, 1980) earlier dichotomous models, MFRM is a polyto-mous model that allows for simultaneous analysis of multiple variables, or facets, to be calibrated on a single equal-interval scale within a shared frame of reference for more meaningful interpretation of the results (Bond and Fox 2015). Applied to the analysis of rater-mediated data, MFRM allows for all central facets under investigation, typically examinee ability, task difficulty, rater severity, and rating scale criteria, to be taken into account in the calculation of adjusted fair scores based on the interactions identified between the elements. MFRM also provides fit indices showing the degree to which the ratings collected match the ratings expected by the probabilistic mathematical model (Eckes 2015). Moreover, MFRM can be employed to inform determinations of rating scale quality as well as in identifying aspects of the rating scales that warrant revision (Bond and Fox2015; Linacre2002a).
While not yet typically included in most reporting of MFRM analyses in the related scholarly literature, a number of recent L2 performance assessment studies have fo-cused explicitly on the post hoc evaluation of rating scale quality using Linacre’s (2002a) guidelines for“optimizing the manner in which rating scales categories cooper-ate in order to improve the utility of the resultant measures” (p. 85). Indeed, the im-portance of post hoc evaluation of rating scale quality has also been highlighted in longer texts without the word limit restrictions common to journal publications, such as Eckes’ (2015) introduction to MFRM for rater-mediated L2 assessments as well as research reports (e.g., Knoch 2007; Weaver 2006) and doctoral dissertations (e.g., Ber-ger2015; Rowles2015).
A few recent studies have even employed post hoc rating scale quality determinations to inform high-stakes test validation efforts and identify areas where revisions to the scales may be advised. In one such study, Weaver (2011) applied Linacre’s (2002a) guidelines to investigate the functioning of a series of 3-, 4-, and 5-point rating scales used to assess the six different moves expected within the written responses to a short-essay prompt included in the English section of a university entrance examination taken by Japanese high school students. Despite finding that the scales failed to meet many of Linacre’s guidelines, Weaver concluded that they were still able to“successfully define a meaningful continuum of productive L2 competence” while noting that
participants at a Chinese university. Although the MFRM analysis revealed good fit to the Rasch model and adherence to all but one of Linacre’s guidelines on rating scale structure, it also suggested that the category 1 scoring level was so underused that it should be removed completely or collapsed with category 2 in future iterations of the test in order to provide stronger support for the scale’s construct validity.
In another recent study which utilized rating scale quality determinations to specific-ally inform rating scale revision, Chen and Liu (2016) employed Linacre’s (2002a) guidelines to aid in the development of a scale to assess speech act performance in written discourse completion and e-mail tasks completed by intermediate-level Chinese learners of English. In that study, the authors found that the original 10-point scale they proposed failed to meet a number of Linacre’s criteria for optimal functioning while a revised 5-point scale exhibited much higher statistical quality. Taking things even further to include the inspection of the functioning of revised rating scales, Jans-sen et al. (2015) drew from the results of MFRM analyses of both the original version and a subsequent revision of a well-known analytic rubric used to assess L2 writing as part of a placement exam for L1 Spanish students in an English doctoral program in order to empirically determine the optimal rating scale structure. After first establishing the poor statistical functioning of the original rubric composed of five rating scales each with a different number of scoring categories ranging from 9 to 21 points with a sample of essays, five revised 6-point scales were proposed using both data-driven (to deter-mine the potentially optimal number of scoring categories in each scale) and intuitive processes (to adapt the descriptors to the fewer scoring levels) before being evaluated with a subsample of the same essays. Ultimately, the authors found that the revised 6-point rating scales functioned much more productively than the original rubric when evaluated by MFRM analyses and Linacre’s accompanying guidelines.
Following in this vein, as a precursor to a larger study aimed at investigating the lon-gitudinal development of interactive L2 speaking ability of lower-proficiency Japanese EFL learners, the current study was designed to first examine the quality of a set of established rating scales for the widely recognized dimensions of complexity, accuracy, and fluency (CAF), interaction, and communicative effectiveness through MFRM ana-lysis. Based on revisions suggested by those initial results, a subsequent goal was to de-termine whether the revisions actually led to statistical improvements in the quality of the revised rating scales for use in this context.
Operationalizing interactive L2 speaking ability
Discourse analytic measures
Despite general agreement among cognitively oriented researchers that the central di-mensions of L2 speaking proficiency can be productively captured by the notions of complexity (the relative elaborateness and variety exhibited in the grammar and vo-cabulary used), accuracy(correctness or degree of deviancy from the norm), and flu-ency (ease or smoothness of speech), collectively referred to as CAF (Housen et al.
degree to which various CAF subcomponents are influenced by various task conditions at differing levels of proficiency.
With more attention being paid to dialogic speaking tasks conducted in pairs or groups in recent years, researchers such as Nitta and Nakatsuhara (2014) have pro-posed adding measures of interactional competenceor interaction, such as turn length, to their discourse analytic measures in an attempt to better represent the co-constructed nature of dialogic speech. Put another way, Ockey and Li (2015) charac-terized interactional competence as“an individual’s underlying ability to actively struc-ture appropriate speech in response to incoming stimuli, such as information from another speaker, in real time” (p. 5). As such, interactional competence encompasses more than merely the ability to take turns, it also involves the ability to appropriately engage with others and develop topics in a given context. Beyond interaction, others, like Pallotti (2009), have expressed a concern that although most analytic CAF mea-sures are typically used to measure the output produced within communicative tasks, such measures generally ignore “how the communication unfolded and whether it was successful in achieving its goals” (p. 596). Pallotti argued that some measure of ad-equacy or communicative effectiveness could help provide a more robust, realistic pic-ture of L2 speakers’abilities.
Analytic rating scales
Aside from discourse analytic measures, L2 performance assessment research offers a parallel, if not complementary, avenue for measuring the central dimensions of L2 speaking abilities through the use of analytic rating scales. Assessing L2 learners’ spoken production with analytic rating scales can provide rich information about their language abilities across any number of different dimensions deemed relevant to the context. Furthermore, when employed using appropriate methods of analysis, data col-lected from analytic rating scales can provide information regarding the relative ease or difficulty of tasks, task conditions, and performance criteria as well as the influence of factors such as personal characteristics, group size, and group composition. Finally, the use of analytic rating scales by human raters assessing L2 speaking output in real time can more realistically approximate how learners’abilities may be perceived by others outside of the testing situation.
short of discussing all of the post hoc validity evidence available, more and more stud-ies in this area have used MFRM to some degree in reporting their results in recent years.
Purposes
The current study was conceived as a post hoc evaluation of five adapted rating scales in order to determine how well they functioned in assessing the interactive L2 English speaking development of low- to mid-proficiency EFL first-year Japanese university stu-dents engaging in 10-min discussions in groups comprised of three or four members at the beginning and end of the first semester. For theCAFrating scales, Nitta and Nakat-suhara’s (2014) recent 9-point modifications of Iwashita et al.’s (2001) original 5-point scales were used with only minor rewording to keep grammatical consistency across the descriptors of each scale. These scales were selected not only for their longevity in the field, but also due to the comparable performances expected among Japanese uni-versity learners of roughly similar proficiency levels as the participants of Nitta and Nakatsuhara’s study.
In an attempt to better address recent calls for including measures of both inter-actional competence and adequacy, additional rating scales of these dimensions were sought from the interactive L2 speaking assessment literature. A 9-point rating scale for interaction was adapted from Ockey et al. (2013), reworded somewhat to better align with the phrasing used in the CAF descriptors, and a 9-point scale for overall communicative effectiveness was employed following that introduced by McNamara (1990). As in McNamara’s original study, only the two end-point categories were min-imally described with the intention of allowing the raters to decide how to best differ-entiate between the levels of overall communicative effectiveness holistically. This study seeks to answer the following research questions:
1. How well do the five 9-pointCAF,interaction,communicative effectivenessrating scale criteria function for the output produced by the learners in this context en-gaging in 10-min group discussions?
2. What revisions to the rating scales are suggested by the initial MFRM results? 3. How well do the revisedCAF,interaction, andcommunicative effectivenessrating
scales function for the same output previously assessed?
Method
Participants
participants who came from two mid-level sections was 328.10 (SD= 50.42). Based on these TOEIC (IP) listening and reading subsection scores, the English proficiency levels of most of these first-year students were considered to be around the A2 (Basic User) level of the CEFR at the start of the academic year, though some upper-level students could be considered B1 (Threshold; Educational Testing Service 2015). Students who missed any part of the data collection procedure were excluded from analysis in this study and are not reported here. In total, 14 students were excluded.
Tasks
As part of a larger study on the development of interactive L2 speaking abilities, the participants took part in a series of 10-min discussion tasks in randomly assigned groups consisting of three or four members at four times in the school year: first se-mester—weeks 2 and 15 and second semester—weeks 2 and 15. Two open-ended ques-tions comparable to the types of discussion topics often practiced in class served as the prompts in the free discussion tasks:
Q1. What was the best thing you did after graduating from high school? Q2. What are your plans for the next break?
The 10-min discussion tasks were introduced with minimal written and oral instruc-tions directing the learners to engage in active discussion on the topics for the full 10 min. The questions were presented in a counterbalanced fashion across four sessions spanning the entire academic year, allowing each topic to be discussed twice by each student. However, only the two first semester tasks from week 2 and week 15 are dis-cussed in this preliminary study. The group discussion tasks were video-recorded using Kodak Zi8 video cameras connected to Audio Technica AT9921 omnidirectional mi-crophones. In total, 39 10-min videos were collected, resulting in 6.5 h of recorded discussions.
Initial 9-point scale ratings
The video-recorded performances of the 64 participants from the first two discussion tasks were rated using modified 9-point versions of theCAF,interaction, and communi-cative effectiveness rating scales outlined previously. The five 9-point scales were com-bined into one rubric shown inAppendix 1. Four experienced raters, one of which was the author, carried out the initial ratings. In the 2 h of rater training provided, the rat-ing scales and descriptors were outlined and four sample video-recorded discussions were independently rated before being discussed. For the actual ratings, all 39 videos were renumbered randomly and each video was assigned to three of the four raters fol-lowing a linked rating plan to ensure sufficient connectedness between the facets of interest. Rater 1 rated all 39 discussions while Raters 2, 3, and 4 each rated 24 discussions.
Initial 9-point scale analysis
2010) was used based on measures of the participants’abilities, rater severity, and the five 9-point rating scale criteria. The PCM was employed because the relative difficulty among the five scales was expected to vary and this model allows for more rigorous in-spection of the structure of each rating scale separately (Eckes 2015). With distinct measures of each participant’s abilities at the beginning and end of the first semester, each participant’s Week 2 and Week 15 ratings were entered into the analysis separ-ately under two different participant codes. For the Week 2 data, all participants were coded numerically from 1 to 64 based on the ranking of their incoming total TOEIC (IP) scores, with participant #1 representing the learner with the highest score (720) and participant #64 representing the learner with the lowest score (260). For the end-of-term Week 15 data, the same numbering system was used for the learners but adjusted by adding 100 to each participant’s initial code (101–164). As a result of this coding procedure, a total of 128 distinct participant codes were considered for the MFRM analysis using Linacre’s FACETS computer software (version 3.68.1). Both the rater and rating criteria facets were centered and the participant facet was uncon-strained. The convergence criteria were left at their default values and the estimation process ceased automatically after 129 iterations.
Initial 9-point scale results and discussion
Two fundamental requirements of the Rasch model were assessed first: unidimension-ality and overall model fit. Unidimensionunidimension-ality was assessed via a Rasch principal com-ponents analysis (PCA) of the standardized residuals using Linacre’s WINSTEPS computer software (version 3.73). The Rasch PCA results indicated that 77.8% of the total raw variance was explained by the measures, well above Reckase’s (1979) criterion that at least 20% of the variance be explained by the Rasch measures for data to fit the model unidimensionality requirements. The largest secondary dimension was found to have an eigenvalue of 2.2, just over the 2.0 level that can be attributed to random noise but less than the practical guideline of 3.0 stipulated by Linacre (2017b). Overall model fit was then assessed by examining the percentage of responses flagged as unexpected according to the assumptions of the model via the PCM analysis. Through an inspec-tion of the absolute values for the standardized residuals (i.e., the standardized differ-ences between observed and expected ratings), the data from the initial 9-point ratings were found to meet Linacre’s (2017a) model-fit stipulations that less than about 5% be greater than or equal to 2.0 and about 1% or less be greater than or equal to 3.0. Of the 1920 valid responses modeled, 87 responses (4.5%) were found to be associated with standardized residuals greater than or equal to 2.0 and 11 responses (0.6%) were found to be associated with standardized residuals greater than or equal to 3.0. Viewed to-gether, these findings provided initial evidence that the data fit the Rasch model productively.
of measures of the participants, raters, and criteria expressed in logits. As the partici-pant facet was oriented positively, more able speakers are located toward the top of the figure and less able speakers are located toward the bottom of the figure. Oriented negatively, the rater and rating scale facets are interpreted differently: both the raters and rating criteria determined to be more lenient are located below the centered mean of zero and those determined to be more harsh are located above it. At the far right, the calibrated rating scales for each criterion are displayed in columns with the cat-egory thresholds represented with the horizontal dashed lines. The uneven locations of these dashed lines across the nine categorical scoring levels that comprise the five rat-ing scales supported the use of the PCM as they suggest that the relative difficulty of the levels varied.
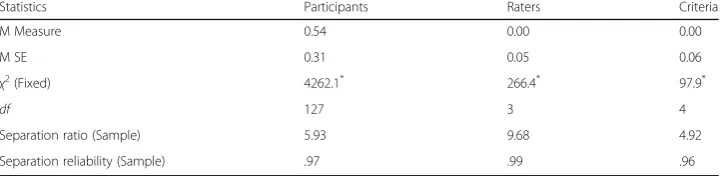
The summary statistics from the FACETS analysis were subsequently reviewed. As shown in Table 1, the significant Chi-square tests indicated that statistical differences were found between at least two elements within each facet.
Examining the participant facet more closely, Fig.1indicates that there was a moder-ate spread of participants’ability ranging from the participant with the lowest perceived measure of overall ability, #51, located at −3.68 logits to the participant with the high-est measure overall ability, #107, located at + 5.49 logits, a span of 9.17 logits. The mean ability of the participants was 0.54 logits, 95% CI [0.22, 0.87], with a standard error of 0.31 logits. Figure1also reveals that the participants were relatively evenly dis-tributed across the variable map with no evidence of floor or ceiling effects at the high-est or lowhigh-est ends of the scales. As shown in Table1, the participant separation ratio at
5.93 suggests that the participants could be separated into roughly six distinct levels of performance and the separation reliability at .97 was high, suggesting reproducibility of the measures from this sample of participants (Linacre 2017a). An inspection of the participant’s infit and outfit mean squares found that 10 (7.8%) of the 128 coded partic-ipants were identified as misfitting with infit mean squares above 2.0. However, as noted by Bonk and Ockey (2003), participant misfit on a performance test such as this may be unavoidable when participants with uneven L2 profiles rightly receive scores that deviate from the degree of relative difficulty across the rating scales modeled to-gether. For the purposes of this study and its explicit focus on the rating scales rather than the learners, the 10 misfitting participants were retained in all analyses.
Turning to the rater facet, both the high rater separation reliability at .99 and the high separation ratio at 9.68 logits indicated that the four raters acted as independent experts with highly varied degrees of severity (Eckes2015; Linacre2017a). These differ-ences were found despite the fact that the number of exact agreements between the rat-ing scores given (708 responses; 36.9%) was slightly greater than that predicted by the model (624.7 responses; 32.5%). The differences in rater severity can be seen in their placement in the third column of Fig.1 where Rater 2 (+ 0.71 logits) was shown to be stricter than Rater 3 (+ 0.04 logits), Rater 1 (−0.19 logits), and Rater 4 (−0.56 logits) re-spectively. Note, however, that the magnitude of difference between the strictest and most lenient raters, a span of 1.27 logits, is much smaller than the 9.17 logit spread found for participant ability. It is also important to point out that under the MFRM ap-proach, differences in severity are acceptable as long as raters remain internally consist-ent across all of their ratings and are not overly restrictive in their use of all rating scale categories, rater behavior which can be examined in the rater fit statistics. The in-terpretation of rater fit statistics, however, must take into account both the assessment context and the intended purposes of the test results (Myford and Wolfe2004). So, al-though tight quality control limits for raters’infit mean squares of 0.70 to 1.30 might be appropriate in high-stakes tests (Bond and Fox 2015), lower stakes or exploratory settings might call for looser control limits, from 0.50 to 1.50, which have been demon-strated to be productive for measurement (Linacre 2002b). For the 9-point scale rat-ings, the infit mean squares of the raters were all found to be within the tighter control range of 0.70 to 1.30: Rater 3 (.88), Rater 1 (.92), Rater 4 (1.05), and Rater 2 (1.26). Given the relatively small scale, low-stakes classroom setting in which the current study was conducted, these infit mean squares indicate that the raters demonstrated no note-worthy misfit or overfit rating patterns.
Concerning the rating scale facet, the five 9-point rating scales were also found to ex-hibit high separation reliability at .96, indicating that the scales were able to encompass
Table 1Summary statistics for the MFRM analysis of the initial 9-point rating scales
Statistics Participants Raters Criteria
M Measure 0.54 0.00 0.00
M SE 0.31 0.05 0.06
χ2
(Fixed) 4262.1*
266.4*
97.9*
df 127 3 4
Separation ratio (Sample) 5.93 9.68 4.92
Separation reliability (Sample) .97 .99 .96
*p
a wide range of performance features at varying degrees of difficulty. However, the sep-aration ratio at 4.92 was found to be much less than the spread of the 9-point scales, thereby providing the first bit of evidence to suggest that the spread of nine rating scale categories may have overreached the actual levels of performance abilities that were able to be distinguished. In terms of fit, the five rating scales were found to cover a wide range of infit mean square values, as might be expected given the distinct subdo-mains they were intended to measure and the often uneven language profiles exhibited by the participants (Bonk and Ockey 2003). Communicative effectiveness (.65) was found to slightly overfit the model, demonstrating a somewhat overly predictable pat-tern of ratings, while fluency (.75), complexity (1.08), accuracy(1.25), and interaction (1.30) were all found to fit the modest control range of .70 to 1.30 (Bond and Fox
2015). Finally, high point-measure correlations (.76 to .88) indicated that the five 9-point rating scales were aligned relatively well in the combined measurement of the latent variable: interactive L2 speaking ability (Eckes2015).
The MFRM findings presented so far are not only quite thorough when viewed in comparison with the degree to which such results are typically reported in scholarly SLA research articles, they also paint a relatively positive picture of the functioning of the analytic ratings for the purposes at hand. However, of particular interest to this current study is the quality of the category structure of the five 9-point rating scales; since even if the data fit productively to the Rasch model, it could have been gathered using less than optimal criteria. To investigate the functioning of each response cat-egory, Linacre’s (2002a) guidelines for evaluating rating scale category effectiveness were applied to the data. For any rating scale to be considered of high quality, Linacre advocated for six basic conditions to be met: (1) a minimum of 10 observations for each category, (2) average category measures that increase monotonically with categor-ies, (3) outfit mean square statistics less than 2.0, (4) Rasch-Andrich category thresh-olds that increase monotonically, (5) Rasch-Andrich category threshthresh-olds should be 1.4– 5.0 logits apart, and (6) the shape of the probability curves should peak for each cat-egory. Although Linacre’s six guidelines were applied to all five rating scales, due to word length limits, only theinteractionscale’s evaluation with these criteria will be pre-sented in detail, followed by a summary of all five scales’adherence to the guidelines.
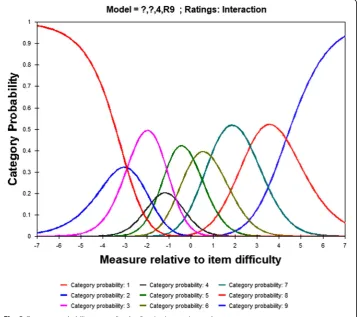
logits separating the category 2 and 3 thresholds. Finally, the category probability curves for the interactionscale shown in Fig.2 further confirmed the lack of clear dis-tinction between many categories of the 9-point scale. Notice that the curves for cat-egories 2 and 4 are completely subsumed by other category probability curves and do not exhibit well-defined peaks clearly separated from the other curves.
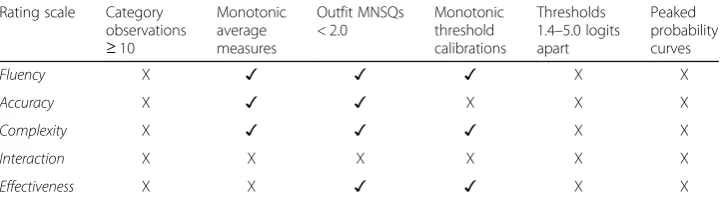
With the detailed results above presented as an illustrative example of post hoc evaluation for the interaction scale, Table 3 provides a summary of adherence to Linacre’s (2002a) guidelines for all five 9-point rating scales. Regarding the first guide-line, category 1 was underused across all five scales while category 2 was underused in all but one instance: interaction category 2 had exactly 10 observations. Category underuse suggests that these categories should be removed or collapsed with an adja-cent category (Bond and Fox2015), since there is a lack of stability in the threshold es-timates that such a thin data set can provide (Linacre 2002a). In terms of average measures advancing with the categories, Table 3 reveals that average measures in-creased monotonically for three of the five rating scales, with interaction category 3 and communicative effectivenesscategory 4 misordered with decreases of −0.35 logits and −0.02 logits respectively. Misordered average measures are problematic because they suggest that observations in higher categories are not necessarily tied to higher performance levels in the minds of the raters (Bond and Fox2015). There was one in-stance in which the outfit mean square value exceeded 2.0 logits:interactioncategory 2 at 3.40. This aberration aside, the general adherence to the outfit mean square guideline suggests that the calibrated ratings did not introduce substantial noise into the meas-urement process. An inspection of the threshold distances between the adjacent cat-egories for each rating scale revealed multiple instances within the scales where the required range of 1.4–5.0 logits was not met:fluency (four instances),accuracy(three instances), complexity (one instance),interaction (three instances), andcommunicative effectiveness (three instances). In fact, two threshold differences showed slightly nega-tive changes from a lower category to an adjacent higher category: accuracy (one in-stance) and interaction (one instance). Similarly, all five 9-point rating scales were unable to produce category probability curves that peaked separately for all categories. The failure of the rating scales to meet the last two of Linacre’s (2002a) guidelines sug-gests that the 9-point scales were unable to consistently define clear distinctions
Table 2Summary of the category structure for the 9-point interaction rating scale
Category Observed count Average measure Outfit MNSQ Threshold calibration Threshold change
1 5a −2.49 0.90 − −
2 10 −0.99 3.40a −2.92 −
3 38 −1.34a 1.20 −2.90 + 0.02a
4 27 −0.68 1.10 −0.67 + 2.23
5 77 −0.16 1.50 −1.54 −0.87a
6 77 0.52 1.10 0.10 + 1.64
7 76 1.14 1.30 0.91 + 0.81a
8 47 2.98 0.90 2.69 + 1.78
9 27 4.63 0.80 4.33 + 1.64
a
between many of the scoring categories of these L2 interactive speaking subdomains in the minds of the raters.
To more explicitly situate the results reported so far in relation to the first research question: although the fit and functioning of the participant and rater facets were found to be productive for measurement, close inspection of the rating scale facet revealed six problems with the functioning of the 9-point rating scales. Employing Linacre’s (2002a) guidelines, the following problems were revealed: (1) multiple categories did not meet the requirement of 10 observations, (2) one average category measure forinteractiondid not increase monotonically, (3) one scoring category for interaction was above the 2.0 max-imum recommend for outfit mean square statistics, (4) two category thresholds did not increase monotonically, (5) multiple category thresholds were found to be less than 1.4 logits apart, and (6) the shape of the probability curves did not peak for each category. Given these results, it must be concluded that all five 9-point rating scales actually func-tioned rather poorly when used to assess the interactive L2 speaking of the participants in this context despite the data demonstrating adequate fit to the Rasch model.
Rating scale revisions
In accordance with the second research question, the results of the initial MRFM ana-lysis suggested several revisions were likely to improve the quality of the CAF, inter-action, andcommunicative effectivenessrating scales for use in this context. As it could
be readily determined that reducing the number of categories within each scale would be prudent, several attempts were made to collapse adjacent categories of the initial 9-point rating data in a principled manner in order determine the number of categories most likely to provide the highest rating scale quality (Bond and Fox2015), in the same manner as Janssen et al.’s (2015) data-driven development process mentioned above. Beyond the indications suggested by the evaluation of the 9-point rating scale data along Linacre’s (2002a) guidelines, reducing the number of categories is also supported by previous research that has suggested that human raters tend to have difficulty pro-cessing more than roughly seven levels of ability due to short-term memory limitations (Miller1956), with even fewer levels likely to contribute to improved decision power in most contexts (North 2003; Smith et al. 2003; Stone 1998). Based on analyses of the data from the collapsed 6-point, 5-point, and 4-point scales, the prospective 5-point rating scales were determined to exhibit the most optimal functioning according to Linacre’s criteria and were closely aligned with the rating scale separation index at 4.92. It is also worth noting here that Iwashita et al.’s (2001)CAFscales were originally pre-sented as 5-point scales before being adapted to 9-point rating scales by Nitta and Nakatsuhara (2014), who added an unspecified between-descriptor category between each of the five described categories. Viewed together, the results presented thus far suggested four major revisions were likely to improve the category functioning of the scales for use in this context. These revisions included (1) reducing the number of scor-ing levels from nine to five, (2) removscor-ing all unspecified between-descriptor categories, (3) eliminating the lowest level categories from all scales, and (4) refining the scoring descriptors at the highest level within each scale to make them more attuned to the ac-tual speaking abilities of learners in this context.
In addition to the data-driven changes suggested above, several other revisions were made to the category descriptors of the resulting 5-point scales through a more intuitive process like that also outlined by Janssen et al. (2015). After the first round of ratings was completed, informal follow-up interviews were conducted individually with the raters to reveal what each considered to be the most and least useful aspects of the pre-vious 9-point scales. Based on the commonalities revealed, several changes were sug-gested for the revised 5-point descriptors. In order to better target the most proficient abilities of the participants in this context, the descriptors for the highest categories of the CAFscales, category 5, were replaced with adaptations much more closely aligned with those originally specified by Iwashita et al. (2001), while the remaining four de-scriptors from the 9-point CAF scales were all moved down one step to describe the re-vised categories 4 through 1 respectively. Three key revisions were also made to the category descriptors of the 5-point interaction scale. First, “Attempts clarification,”
Table 3Summary of adherence to Linacre’s (2002a) guidelines for the 9-point rating scales
Rating scale Category observations ≥10
Monotonic average measures
Outfit MNSQs < 2.0
Monotonic threshold calibrations
Thresholds 1.4–5.0 logits apart
Peaked probability curves
Fluency X ✓ ✓ ✓ X X
Accuracy X ✓ ✓ X X X
Complexity X ✓ ✓ ✓ X X
Interaction X X X X X X
previously included in the description of the highest category, category 9, was changed to“May attempt paraphrase or clarification,”since all raters expressed persistent confu-sion as to whether the previous wording required attempted clarification for a partici-pant to receive that score or if it was a possible attribute demonstrated at that level. Second, the term “regularly” was added as a qualifier to the category 4 description in order to more closely align it with the same term used in the parallel complexity de-scriptor. Third, as was also done for the complexitydescriptors, each sentence within a single category descriptor was separated by a line break for ease of rater use. The 5-point communicative effectiveness scale was specified at each category level using ability qualifiers ranging from “very ineffectively” to “very effectively” among the de-scriptors. Finally, the three references to“native”speaking ability included in the previ-ouscommunicative effectivenessandfluencyscales were completely removed due to the raters’noted difficulty and reluctance in drawing such a comparison with the learners in this context. The resulting revised 5-point CAF, interaction, and communicative ef-fectivenessrating scales are shown combined into one rubric inAppendix 2.
Revised 5-point scale ratings
In order to confirm that the revised 5-point rating scales did indeed demonstrate im-proved functioning in the assessment of interactive L2 speaking abilities of the partici-pants and tasks used in this study, the video-recorded performances of the 64 participants from the first two discussion tasks were reassessed using the revised 5-point CAF, interaction, and communicative effectivenessrating scales. The same four raters who completed the initial ratings were asked to rerate the same sets of video-recorded discussions that they had initially rated, this time using the revised 5-point scales. As in the previous round of ratings, Rater 1 rated all 39 discussions while Raters 2, 3, and 4 each rated 24 discussions following a linked rating plan. One hour of rater retraining was provided at the outset in which the revised rating scales and descriptors were outlined and two sample discussions were independently rated and discussed.
Revised 5-point scale analysis
In order to answer the third research question, an MFRM analysis of the revised rating scores was performed. Again, a three-facet PCM (Masters 1982,2010) was used based on measures of the participants’abilities, rater severity, and the revised five 5-point rat-ing scale criteria. All participants retained the same number codes introduced previ-ously, resulting in 128 numbered participants entered into the FACETS analysis. As with the initial analysis, both the rater and rating criteria facets were centered and the participant facet was unconstrained. The convergence criteria were left at their default values and the estimation process ceased automatically after 98 iterations.
Revised 5-point scale results and discussion
measures. The largest secondary dimension had an eigenvalue of 2.1, again, just over the 2.0 level that can be attributed to random noise and less than the practical guide-line of 3.0 stipulated by Linacre (2017b). Overall model fit was then assessed by exam-ining of the percentage of responses flagged as unexpected according to the assumptions of the model via the PCM analysis. Through an inspection of the absolute values for the standardized residuals, the data from the revised 5-point ratings were found to meet Linacre’s (2017a) model-fit stipulations that less than about 5% be greater than or equal to 2.0 and about 1% or less be greater than or equal to 3.0. Of the 1920 valid responses modeled, 91 responses (4.7%) were found to be associated with standardized residuals greater than or equal to 2.0 and 13 responses (0.7%) were found to be associated with standardized residuals greater than or equal to 3.0. Together, these findings provide initial evidence that the 5-point rating scale data could be fit productively to the Rasch model.
Figure3displays the variable map for the estimations of the participants, raters, rating scales, and the five revised 5-point rating criteria used by the raters all aligned on the shared logit scale shown on the left side of the figure. Note that the variable map for the 5-point scale data reveals a more symmetrical distribution of the participants than that of the 9-point scale data presented in Fig. 2, from those determined to be most proficient overall at the top of the figure to those found to be least proficient overall at the bottom. The raters and rating scales are shown to be quite similar in severity as they are closely grouped around the centered mean of zero logits. Finally, at the far right, the calibrated rating scales for each criterion reveal category thresholds that are much more closely aligned across the five 5-point rating scale categories than they were for the 9-point rating scales shown in Fig.1. The improved threshold alignment suggests that the relative diffi-culty of the scoring levels was more uniform across the five scales.
Summary statistics for the three facets modeled are presented in Table4. The signifi-cant Chi-square tests indicated that statistical differences were found between at least two elements within each facet.
Looking more closely at the participant facet, Fig.3indicates that there was an even lar-ger spread of participants’ability than found in the analysis of the 5-point scales ranging from the participant with the lowest perceived measure of overall ability, #51, located at −8.71 logits to the participant with the highest measure overall ability, #107, located at + 6.36 logits, a span of 15.07 logits. The mean ability of the participants was−0.65 logits, 95% CI [−1.10,−0.20], with a standard error of 0.47 logits (see Table4). Figure3also re-veals that the participants were again relatively evenly distributed across the variable map with no evidence of a ceiling effect, but the lowest ends of the scales did show a floor ef-fect for the participant with the lowest overall measure. The participant separation ratio at 5.17 suggests that the participants could be separated into five distinct levels of per-formance and the separation reliability at .96 was high, suggesting reproducibility of the measures from this sample of participants (Linacre2017a). An inspection of the partici-pant’s infit and outfit mean squares found that 10 (7.8%) of the 128 coded participants were identified as misfitting with infit mean squares above 2.0, which, again, could be due to uneven language profiles. For the purposes of this study and its explicit focus on the rating scales, the 10 misfitting participants were retained in all analyses.
separation ration at 7.56 logits. Appropriate rater independence was also reiterated by the fact that the number of exact agreements between the rating scores given (943 responses; 49.5%) was relatively close to that predicted by the model (899.7 responses; 47.2%). The relative differences in severity could also be seen in their placement in the third column of Fig. 3 where Rater 2 (+.88 logits) was again shown to be much stricter than Rater 3 (−.03 logits), Rater 4 (−.36 logits), and Rater 1 (−.49 logits) respectively. Note that the spread in severity measures be-tween the most strict and most lenient rater, a span of 1.37 logits, is much smaller than the 15.07 logit spread found for participant ability. Finally, the infit mean squares of the raters were all found to be within the tighter control range of 0.7 to 1.3: Rater 4 (.80), Rater 1 (.92), Rater 3 (1.15), and Rater 2 (1.18). Given the pur-poses and context of this study, these infit mean squares indicated no misfit or overfit rating patterns among the raters.
Turning to the rating scale facet, the five 5-point rating scales were also found to exhibit high separation reliability at .95, indicating that the 5-point scales were also able to encompass a wide range of performance features at varying degrees of difficulty. The separation ratio at 4.55 was found to be very close to the 5-point scales used. In terms of fit, the five rating scales were again found to ex-hibit different infit mean square values in the general dispersal pattern; however, this time they were all within the .70 to 1.30 quality control range: communica-tive effeccommunica-tiveness (.70), fluency (.83), complexity (1.01), accuracy (1.21), and inter-action (1.28). Finally, high point-measure correlations (.76 to .88) indicated that the 5-point rating scales aligned relatively well in the measurement of the latent variable (i.e., interactive L2 speaking ability) (Eckes 2015).
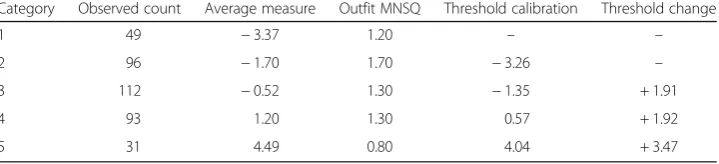
As for the main area of inquiry in this study, the functioning of the five 5-point rating scales was investigated along Linacre’s (2002a) six guidelines outlined previously. Again, due to space considerations, only the functioning of the interaction scale will be presented in detail with a summary of all five scales provided afterward. The cat-egory structure of the 5-point interaction rating scale was found to meet all of Linacre’s guidelines, as is demonstrated by the results presented in Table 5 and Fig. 4. There were more than 10 observations in all of the categories, the average measures increased monotonically, the outfit mean square values were all under the 2.0 logit maximum, the category thresholds increased monotonically with dis-tances between the thresholds all within the suggested range of 1.4–5.0 logits, and the probability curves clearly peaked for all categories.
An overview of how well all five 5-point rating scales adhered to Linacre’s (2002a) guidelines is presented in Table 6. Regarding the first guideline, all rating scale categories had more than 10 observations except for complexity category 5 which only had five observations. The second guideline was met as the average measures increased monotonically for all five rating scales. There were also no in-stances in which the outfit mean square value was greater than the 2.0-logit bench-mark. Inspection of the threshold distances between the adjacent categories for each rating scale revealed only one instance that fell outside of the range of 1.4– 5.0 logits: the complexity category 5 threshold was + 5.18 higher than the category 4 threshold. However, with only 5 observations of the upper category found in this analysis, the estimation for the uppermost level cannot be considered stable. The statistically distinct levels of the 5-point scales were also shown in the category probability curves, where the categories of all five rating scales emerged with well-defined peaks.
Summarizing the results of the FACETS analysis of the five revised 5-point rating scales in relation to the third research question, the functioning of both the participant
Table 4Summary statistics for the MFRM analysis of the revised 5-point rating scales
Statistics Participants Raters Criteria
M Measure −0.65 0.00 0.00
M SE 0.47 0.08 0.09
χ2
(Fixed) 2923.0* 176.9* 84.6*
df 127 3 4
Separation ratio (Sample) 5.17 7.56 4.55
Separation reliability (Sample) .96 .98 .95
*p
< .01
Table 5Summary of the category structure for the 5-point interaction rating scale
Category Observed count Average measure Outfit MNSQ Threshold calibration Threshold change
1 49 −3.37 1.20 – –
2 96 −1.70 1.70 −3.26 –
3 112 −0.52 1.30 −1.35 + 1.91
4 93 1.20 1.30 0.57 + 1.92
5 31 4.49 0.80 4.04 + 3.47
and rater facets were again found to be within the acceptable guidelines. Most import-antly for the purposes of the current study, the category structures of the revised 5-point rating scales were also found to function much more optimally. In fact, Linacre’s (2002a) guidelines were met by 24 out of 25 possible rating scale categor-ies. Only one category, score 5 for complexity, failed to meet two of the criteria because it had less than 10 observations and marked a threshold increase greater than 5.0 logits. Although this aberration could suggest further revision of the de-scriptor for this category would be beneficial and/or the need for better training of the raters in awarding scores for L2 speaking complexity, it could also reflect limi-tations in the size and proficiencies of this particular sample with the tasks they were given at the beginning and end of the first semester of university study.
Fig. 4Category probability curves for the 5-point interaction scale
Table 6Summary of adherence to Linacre’s (2002a) guidelines for the 5-point rating scales
Rating scale Category observations ≥10
Monotonic average measures
Outfit MNSQs < 2.0
Monotonic threshold calibrations
Thresholds 1.4–5.0 logits apart
Peaked probability curves
Fluency ✓ ✓ ✓ ✓ ✓ ✓
Accuracy ✓ ✓ ✓ ✓ ✓ ✓
Complexity X ✓ ✓ ✓ X ✓
Interaction ✓ ✓ ✓ ✓ ✓ ✓
Returning to the impetus for this preliminary study, it is also worth pointing out again that the overarching purpose was to determine the rating scale category structure most likely to be able to identify changes in the longitudinal development of interactive L2 speaking ability across more frequently administered tasks over an entire academic year. As such, the rating scales employed in that more expansive study would not only need to allow for more scores per individual learner across more times, but also accommodate for further development projected to occur for most learners throughout the second semester of study. This dilemma high-lights an important point regarding the tension inherent to carrying out empiric-ally informed rating scale revisions: while a fully optimized scale might demonstrate the best fit and functioning for a post hoc evaluation of rating scale quality, that particular category structure may not remain optimal when the con-ditions of subsequent uses change even within the same educational context. Nonetheless, when viewed in comparison to the results of the initial analysis of the 9-point rating scales, the revised 5-point rating scales unequivocally demon-strated improved functioning when used to assess the interactive L2 speaking abilities of the participants in the context in which the tasks were administered. As a result, the data collected using the revised scales in any subsequent research to be conducted in this context is likely to be of much better quality than would have been possible otherwise, a point that may be particularly important when considered in relation to the potentially subtle growth that is hypothesized to occur along the CAF, interaction, and communicative effectiveness dimensions among many learners over the course of the thirty 90-min class meetings that comprise the learners’ first year of university study.
Conclusion
Appendix 1
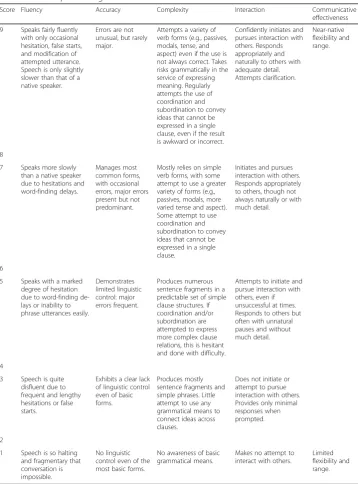
Table 7Initial 9-point rating scales
Score Fluency Accuracy Complexity Interaction Communicative
effectiveness
9 Speaks fairly fluently with only occasional hesitation, false starts, and modification of attempted utterance. Speech is only slightly slower than that of a native speaker.
Errors are not unusual, but rarely major.
Attempts a variety of verb forms (e.g., passives, modals, tense, and aspect) even if the use is not always correct. Takes risks grammatically in the service of expressing meaning. Regularly attempts the use of coordination and subordination to convey ideas that cannot be expressed in a single clause, even if the result is awkward or incorrect.
Confidently initiates and pursues interaction with others. Responds appropriately and naturally to others with adequate detail. Attempts clarification. Near-native flexibility and range. 8
7 Speaks more slowly than a native speaker due to hesitations and word-finding delays.
Manages most common forms, with occasional errors, major errors present but not predominant.
Mostly relies on simple verb forms, with some attempt to use a greater variety of forms (e.g., passives, modals, more varied tense and aspect). Some attempt to use coordination and subordination to convey ideas that cannot be expressed in a single clause.
Initiates and pursues interaction with others. Responds appropriately to others, though not always naturally or with much detail.
6
5 Speaks with a marked degree of hesitation due to word-finding de-lays or inability to phrase utterances easily.
Demonstrates limited linguistic control: major errors frequent.
Produces numerous sentence fragments in a predictable set of simple clause structures. If coordination and/or subordination are attempted to express more complex clause relations, this is hesitant and done with difficulty.
Attempts to initiate and pursue interaction with others, even if unsuccessful at times. Responds to others but often with unnatural pauses and without much detail.
4
3 Speech is quite disfluent due to frequent and lengthy hesitations or false starts.
Exhibits a clear lack of linguistic control even of basic forms.
Produces mostly sentence fragments and simple phrases. Little attempt to use any grammatical means to connect ideas across clauses.
Does not initiate or attempt to pursue interaction with others. Provides only minimal responses when prompted.
2
1 Speech is so halting and fragmentary that conversation is impossible.
No linguistic control even of the most basic forms.
No awareness of basic grammatical means.
Makes no attempt to interact with others.
Limited flexibility and range.
The between-score categories indicate ratings that fall somewhere between the two adjacent rating categories following Nitta and Nakatsuhara (2014). TheFluency,Accuracy, andComplexityscales were modified from Nitta and Nakatsuhara (2014) and Iwashita et al. (2001). TheInteractionscale was adapted from Ockey et al. (2013). TheCommunicative
Abbreviations
CA:Conversation analysis; CAF: Complexity, accuracy, and fluency; CEFR: Common European Framework of Reference for Languages; CI: Confidence interval; EFL: English as a foreign language; ESL: English as a second language; L2: Second language; MFRM: Many-facet Rasch measurement; PCA: Principal component analysis; PCM: Partial credit model; SEM: Structural equation modeling; TOEIC (IP): Test of English for International Communication (Institutional Program)
Acknowledgements
I would like to thank David Beglar for his insightful comments on an earlier draft of this paper. Appendix 2
Table 8Revised 5-point rating scales
Score Fluency Accuracy Complexity Interaction Communicative
Effectiveness
5 Speaks very fluently with almost no hesitations, false starts, or modifications of attempted utterances.
Errors are barely noticeable.
Confidently attempts a variety of verb forms (e.g., passives, modals, tense, and aspect) even if the use is not always correct. Routinely attempts the use of coordination and subordination to convey ideas that cannot be expressed in a single clause, even if the result is awkward or incorrect.
Confidently initiates and pursues interaction with others. Responds appropriately and naturally to others with adequate detail. May attempt paraphrase or clarification. Communicates very effectively overall.
4 Speaks fairly fluently with only occasional hesitations, false starts, or modifications of attempted utterances.
Errors are not unusual, but rarely major.
Attempts a variety of verb forms (e.g., passives, modals, tense, and aspect) even if the use is not always correct.
Regularly attempts the use of coordination and subordination to convey ideas that cannot be expressed in a single clause, even if the result is awkward or incorrect.
Regularly attempts to initiate and pursue interaction with others. Responds appropriately and naturally to others, though not always with adequate detail. Communicates relatively effectively overall.
3 Speaks somewhat fluently though hesitations and word-finding delays are not uncommon.
Manages most common forms, with occasional errors, major errors present but not predominant.
Mostly relies on simple verb forms, with some attempt to use a greater variety of forms (e.g., passives, modals, more varied tense and aspect). Makes some attempt to use coordination and subordination to convey ideas that cannot be expressed in a single clause.
Makes some attempt to initiate and pursue interaction with others. Responds appropriately to others, though not always naturally or with much detail.
Communicates somewhat effectively overall.
2 Speaks with a marked degree of hesitation due to word-finding de-lays or inability to phrase utterances easily.
Demonstrates limited linguistic control: major errors frequent.
Produces numerous sentence fragments in a predictable set of simple clause structures. If coordination and/or subordination are attempted to express more complex clause relations, this is hesitant and done with difficulty.
Makes an effort to initiate and pursue interaction with others, even if unsuccessful at times.
Responds to others but often with unnatural pauses and without much detail.
Communicates relatively ineffectively overall.
1 Speech is quite disfluent due to frequent and lengthy hesitations or false starts.
Exhibits a clear lack of linguistic control even of basic forms.
Produces mostly sentence fragments and simple phrases.
Little attempt to use any grammatical means to connect ideas across clauses.
Does not initiate or attempt to pursue interaction with others. Provides only minimal responses when prompted. Communicates very ineffectively overall.
Funding
This study was supported by a grant from the Kobe College Research Institute.
Availability of data and materials
The datasets analyzed during the current study are not publicly available because they may be used in future publications but are available from the author on reasonable request.
Author’s contributions
Kurtis McDonald is the sole contributor to this research paper. The author read and approved the final manuscript.
Author’s information
Kurtis McDonald is an Associate Professor in the English Education Research Center at Kobe College, in Nishinomiya, Japan, and a Ph.D. Candidate at Temple University, Japan Campus.
Competing interests
The author declares that he has no competing interests.
Publisher’s Note
Springer Nature remains neutral with regard to jurisdictional claims in published maps and institutional affiliations.
Received: 12 September 2018 Accepted: 23 November 2018
References
Berger, A. (2015).Validating analytic rating scales: A multi-method approach to scaling descriptors for assessing academic speaking. New York: Peter Lang.
Bond, T. G., & Fox, C. M. (2015).Applying the Rasch model: Fundamental measurement in the human sciences(3rd ed.). New York: Routledge.
Bonk, W. J., & Ockey, G. J. (2003). A many-facet Rasch analysis of the second language group oral discussion task.Language Testing, 20, 89–110.https://doi.org/10.1191/0265532203lt245oa.
Chen, Y., & Liu, J. (2016). Constructing a scale to assess L2 written speech act performance: WDCT and e-mail tasks.Language Assessment Quarterly, 13, 231–250.https://doi.org/10.1080/15434303.2016.1213844.
Council of Europe. (2001).Common European Framework of Reference for Languages: Learning, teaching, assessment. Cambridge: Cambridge University Press.
Eckes, T. (2015).Introduction to many-facet Rasch measurement: Analyzing and evaluating rater-mediated assessments(2nd ed.). New York: Peter Lang.
Educational Testing Service. (2015). Mapping the TOEIC® tests on the CEFR. Retrieved fromhttps://www.ets.org/s/toeic/pdf/ toeic_cef_mapping_flyer.pdf.
Fan, J., & Bond, T. (2016). Using MFRM and SEM in the validation of analytic rating scales of an English speaking assessment. In Q. Zhang (Ed.),Pacific Rim Objective Measurement Symposium (PROMS) 2015 conference proceedings(pp. 29–50). Singapore: Springer Science+Business Mediahttps://doi.org/10.1007/978-981-10-1687-5_3.
Housen, A., Kuiken, F., & Vedder, I. (2012). Complexity, accuracy, and fluency: Definitions, measurement and research. In A. Housen, F. Kuiken, & I. Vedder (Eds.),Dimensions of L2 performance and proficiency: Complexity, accuracy, and fluency in SLA(pp. 1–20). Amsterdam: Benjamins.https://doi.org/10.1075/lllt.32.01hou.
Iwashita, N., Elder, C., & McNamara, T. (2001). Can we predict task difficulty in an oral proficiency test? Exploring the potential of an information processing approach to task design.Language Learning, 21, 401–436. https://doi.org/10.1111/0023-8333.00160.
Janssen, G., Meier, V., & Trace, J. (2015). Building a better rubric: Mixed methods rubric revision.Assessing Writing, 26, 51–66 https://doi.org/10.1016/j.asw.2015.07.002.
Knoch, U. (2007). Do empirically developed rating scales function differently to conventional rating scales for academic writing?Spaan Fellow Working Papers in Second or Foreign Language Assessment, 5, 1–36.
Linacre, J. M. (1994).Many-facet Rasch measurement(2nd ed.). Chicago: MESA Press (Original work published 1989). Linacre, J. M. (2002a). Optimal rating scale category effectiveness.Journal of Applied Measurement, 3, 85–106.
Linacre, J. M. (2002b). What do infit and outfit, mean-square and standardized mean?Rasch Measurement Transactions, 16, 878.
Linacre, J. M. (2017a).A user’s guide to FACETS: Rasch-model computer programs (3.80.0) [computer software manual]. Beaverton: Winsteps.com.
Linacre, J. M. (2017b). In ). A user’s guide to WINSTEPS (Ed.),Rasch-model computer programs (4.0.0) [computer software manual]. Beaverton: Winsteps.com.
Masters, G. M. (1982). A Rasch model for partial credit scoring.Psychometrika, 47, 149–174https://doi.org/10.1007/BF02296272. Masters, G. M. (2010). The partial credit model. In M. L. Nering & R. Ostini (Eds.),Handbook of polytomous item response theory
models(pp. 109–122). New York: Routledge.
McNamara, T. F. (1990). Item response theory and the validation of an ESP test for health professionals.Language Testing, 7, 52–76https://doi.org/10.1177/026553229000700105.
Miller, G. A. (1956). The magical number seven, plus or minus two: Some limits on our capacity for processing information.
Psychological Review, 63, 81–97https://doi.org/10.1037/h0043158.
Myford, C. M., & Wolfe, E. W. (2004). Detecting and measuring rater effects using many-facet Rasch measurement: Part I. In E. V. Smith Jr. & R. M. Smith (Eds.),Introduction to Rasch measurement(pp. 460–517). Maple Grove: JAM Press.
North, B. (2003).Scales for rating language performance: Descriptive models, formulation styles, and presentation formats. TOEFL Monograph No. MS-24, 24.
Ockey, G. J., Koyama, D., & Setoguchi, E. (2013). Stakeholder input and test design: A case study on changing the interlocutor familiarity facet of the group oral discussion test.Language Assessment Quarterly, 10, 292–308.https://doi.org/10.1080/ 15434303.2013.769547.
Ockey, G. J., & Li, Z. (2015). New and not so new methods for assessing oral communication.Language Value, 7(1), 1–21 https://doi.org/10.6035/LanguageV.2015.7.2.
Pallotti, G. (2009). CAF: Defining, refining and differentiating constructs.Applied Linguistics, 30, 590–601.https://doi.org/10. 1093/applin/amp045.
Rasch, G. (1980).Probabilistic models for some intelligence and attainment tests. Chicago: MESA Press (Original work published 1960).
Reckase, M. D. (1979). Unifactor latent trait models applied to multifactor tests: Results and implications.Journal of Educational Statistics, 4, 207–230https://doi.org/10.2307/1164671.
Rowles, P. B. (2015).Constructing a polysemous academic vocabulary extent test via polytomous Rasch model measurement analyses (unpublished doctoral dissertation). Tokyo: Temple University Japan.
Smith, E. V., Wakely, M. B., De Kruif, R. E. L., & Swartz, C. W. (2003). Optimizing rating scales for self-efficacy (and other) research.Educational and Psychological Measurement, 63, 369–391https://doi.org/10.1177/0013164403063003002. Stone, M. (1998). Rating scale categories: Dichotomy, double dichotomy, and the number two.Popular Measurement,
1, 61–65.
Weaver, C. (2006). Evaluating the use of rating scales in a high-stakes Japanese university entrance examination.Spaan Fellow Working Papers in Second or Foreign Language Assessment, 4, 57–79.