International Doctorate School in Information and Communication Technologies
DISI - University of Trento
Trajectory Analysis for Event Detection in
Ambient Intelligence Applications
Nicola Piotto
Advisor:
Prof. Francesco G.B. De Natale
Universit`a degli Studi di Trento
Abstract
The automatic understanding of human activity is probably one of the most challenging problems for the scientific community. Several application domains would benefit of such an analysis, from context-aware computing, to area monitoring and surveillance, to assis-tive technologies for elderly or disabled, and more.
In a broad sense, we can define the activity analysis as the problem of finding an expla-nation coherent with a set of observations. These observations are typically influenced by several factors from different disciplines, such as sociology or psychology, but also math-ematics and physics, making the problem particularly hard. In the last years, also the computer vision community focused its attention on this area, producing the latest ad-vances in the acquisition and understanding of human motion data from image sequences. Despite the increasing effort spent in this field, there still exists a consistent gap between the numerical low-level pixel information that can be observed and measured, and the high abstraction level of the semantic that describes a given activity. In other words, there exist a conceptual ambiguity between the image sequence observations and their possible interpretations. Although several factors are involved, the activity modeling and the com-parison strategy play crucial roles. In this proposal, a correlation between activity and corresponding path has been assumed.
In light of this, the work carried out tackles two strictly related issues: (i) obtaining a proper representation of human activity; (ii) define an effective tool for reliably measuring the similarity between activity instances. In particular, the object activity is modeled with a signature obtained through a symbolic abstraction of its spatio-temporal trace, allow-ing the application of particular high-level reasonallow-ing for computallow-ing the activity similarity. This representation is particularly effective since it provides a smart way to compensate the noise artifacts coming from low-level modules (i.e., tracking algorithms), allowing also the possibility of considering interesting properties, such as the invariance to shift, rotation, and scale factors. Since any complex task may be decomposed in a limited set of atomic units corresponding to elementary motion patterns, the key idea of this representation is to catch the object activities by suitably representing their trajectories through symbols. This syntactic activity description relies on the extraction and on the symbolic coding of meaningful samples of the path, while the similarity between trajectories is computed using the so-called approximate-matching, thus casting the trajectory comparison problem to a string matching one.
in ad-hoc Context-Free Grammars, and the matching problem is solved through the parsing of the incoming string according the defined rules.
Keywords:
Acknowledgements
There are lots of people I would like to thank for a huge variety of reasons.
Firstly, I would like to express my gratitude to my advisor, Prof. Francesco G.B. De Natale, for his excellent supervision on my research and his assistance in this past years in pointing me in the right direction. I would also like to deeply thank Dott. Nicola Conci, for the insightful discussions, the consistent support over these years and the contribution to my work.
A special thanks go to all the people that shared with me the Multimedia Signal Pro-cessing and Understanding Laboratory, from the students to all the academic members, for all those comments and suggestions helping enhancing the quality of my research. I’m particularly graceful to my friends (before than colleagues) Mattia, Valentina, and Silvia, who walked with me through this PhD trip, sharing many good and bad moments, making my PhD life easier. Thank you for the moments we spent together, your support and encouragements in critical situations, your friendship.
I’m thankful also to all the other colleagues and friends in the Department, not only for the technical help, but in particular for making these years more funny and interesting.
Finally, it is always not enough to express my deep gratitude to my family, especially my Mom and Dad, for their unconditional love: they never stopped believing and sup-porting in me. Without them I would not survive the long journey of my PhD study.
Contents
1 Introduction 1
1.1 The Context . . . 1
1.2 The Problem . . . 2
1.3 Proposed Solution and Innovation . . . 4
1.4 Structure of the Thesis . . . 6
2 State of the Art 7 2.1 Trajectory representation . . . 7
2.1.1 Polygonal approximation . . . 8
2.1.2 Spline approximation . . . 11
2.1.3 PCA coefficients . . . 12
2.1.4 String-based (symbolic) representation . . . 13
2.2 Trajectory matching . . . 14
2.2.1 Dynamic matching . . . 14
2.2.2 Statistical matching . . . 18
2.2.3 Vector matching . . . 21
3 Syntactic Matching of Trajectories for Ambient Intelligence Applica-tions 29 3.1 Introduction . . . 29
3.2 Overview of the system . . . 30
3.3 The proposed approach . . . 32
3.3.1 Trajectory segmentation and characterization . . . 32
3.3.2 Key points symbolic mapping . . . 34
3.3.3 Trajectory alignment and matching . . . 36
3.4 Experimental results . . . 39
3.5 Conclusions . . . 46
4 Hierarchical Matching of 3D Trajectories for Surveillance Applications 47 4.1 Introduction . . . 47
4.2 3D trajectory representation and reconstruction . . . 48
4.5 Conclusions . . . 54
5 Context-Free Grammars for Activity Modeling and Matching 55 5.1 Introduction . . . 55
5.2 Overview on Context-Free Grammars . . . 57
5.3 Proposed Framework . . . 58
5.3.1 Activity representation . . . 60
5.3.2 CFG Rules Discovery . . . 60
5.3.3 CFG-based parsing for activity recognition . . . 61
5.3.4 CFG rule update . . . 63
5.4 Results . . . 64
5.5 Conclusions . . . 67
6 Optimal Quantization for Robust Trajectory Analysis 69 6.1 Introduction . . . 69
6.2 Optimal Quantization . . . 71
6.3 Trajectory Analysis . . . 75
6.4 Conclusions . . . 78
7 Conclusions and Future Work 81
Bibliography 83
Chapter 1
Introduction
In this chapter an introduction to this dissertation will be given. In particular, we provide an overview of the visual technology for activity analysis, focusing on the main issues related to visual information extraction for the automatic analysis of activities. The main objectives and the novel contributions of this thesis are also presented. Finally, we describe the organization of this document.
1.1
The Context
Automatic activity understanding in dynamic scenes is a very complex and ambitious goal. In particular, the reasoning task becomes even more complicated when it has to deal with human-populated scenarios, making it particularly appealing. The emulation of such a perfect system as the Natural Vision System represents, without any doubt, a real challenge both from a scientific and technological point of view. In spite of several
difficulties involved, or because of them, the automatic human activity analysis has gained
significant attention from the computer vision community, becoming a very active research field. However, despite the strong interest and the substantial advances achieved in the last years, it still constitutes an ambitious open problem that is far from being solved.
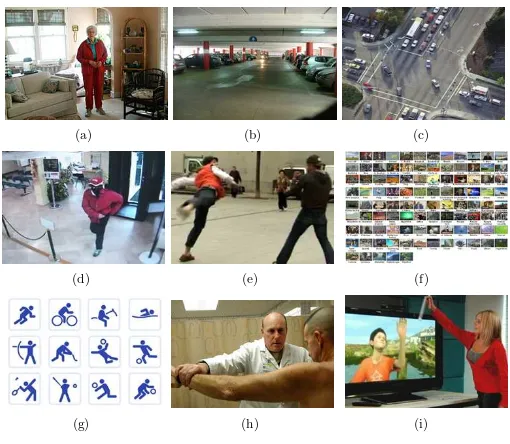
The interest about this area is pushed forward by two main factors. On the one hand, the number of potential applications is continuously increasing, including not only smart video safety (Fig. 1.1-(a)) and video surveillance (Fig. 1.1-(b)), but also automatic
traffic/road monitoring (Fig. 1.1-(c)), crime and dangerous situations alert (Fig. 1.1-(d),
(e)), semantic-based video classification, indexing and retrieval engines (Fig. 1.1-(f)), automatic sport statistics computation (Fig. 1.1-(g), athlete training and orthopedic therapy, machine content annotation (Fig. 1.1-(h)), smart human-computer interfaces (Fig. 1.1-(i)).
(a) (b) (c)
(d) (e) (f)
(g) (h) (i)
Figure 1.1: Sample of significant applications for video analysis.
about a typical surveillance scenario, the volume of video feed is so large that it quickly overwhelms the ability of security personnel to analyze and respond to the data in a time-critical fashion. In fact, most of the commercial solutions focus on the recording
process, while it would be highly desirable having effective techniques for event analysis,
in order to identify the occurrence of specific situations, and issue warnings automatically. In other words, the video data is used ”after-the-fact” as a forensic tool, losing its primary benefit of an active, real-time medium. On the contrary, a continuous 24/7 analysis is
required, to alert security officers about burglary in progress, or suspicious loitering in a
parking, while there is still time to react to the on going situation.
1.2
The Problem
One of the main difficulties in designing such an automatic system lies in discriminating
Semantic
Gap
Sensor
Gap
Activity 1...
Activity n
Activity 2
Figure 1.2: Sensor andsemantic gapsconfiguration in an activity analysis framework.
in the wide spectrum of low-level video data is a very complex and challenging task that goes far beyond the simple provision of sensors over wider areas. The task of interpreting the activity captured in an image sequence involves subjectivity, and is strongly related to an explanation based on human-defined concepts. However, the input data available to accomplish this task come from vision-based techniques, which are basically quantitative. Therefore, an intermediate processing layer to convert quantitative data into higher-level concepts has to be put between the vision-based techniques and the activity interpretation reasoning.
When extracting/deriving qualitative information from image sequences, two main phases are usually carried out, and both of them contribute with some uncertainty to the final activity interpretation. In Fig. 1.2 the conceptual data flow is reported. Initially, a given amount of error is pulled out by the low-level computer vision device due to the
so-called sensory gap, which refers to the lack of accuracy in the low-level information
extraction from the image. In this regard, several open issues can be found in the scientific literature, for example about the object features estimation/tracking in cluttered scenes.
In fact, when dealing with a poorly illuminated or crowd environment, many difficulties
arise when trying to distinguish the targets from the background, bringing to errors in the estimated motion, and thus to the final activity. Moreover, multiple moving targets increase the probability of occlusions, introducing additional problems in the object shape extraction.
On the other hand, the activity modeling has to consider the semantic gap, which in
1.3
Proposed Solution and Innovation
The effects of thesensory gapcan be somehow relaxed by considering the installation of
multiple cameras, or using a combination of different low-level sensors (e.g., infrared or
PTZ cameras, microphones, RFIDs), and relying on the concept ofdiversity. Instead, how
to bridge thesemantic gapis still an open issue. A common solution is to select a model
for the activity, and adopt a human-labeled set of samples for its training. The model selection is crucial, and usually is carried out on the basis of some heuristic assumptions. In general, a reasonable option can be to assume some kind of correlation between the
conceptual activity and the effective path followed by an object for carrying out that
activity. In this way it’s possible to associate to some particular activity a specific set of motion patterns, bringing the problem of activity recognition to a trajectory analysis problem.
In this proposal, this last direction has been followed, supposing a correlation between the activities samples and the correspondent spatio-temporal path evolution. Since the
Matching score Video Acquisition &
Object Tracking
Signature Extraction
Signature Symbolic Coding
Symbolic String Matching
Trajectory String Database
Figure 1.3: High-level flowchart of the proposed solution. The blocks considered in this work are highlighted in light blue and bold font.
sensory gap is somehow related and dependent to the particular device (or device con-figuration) employed, it can be not trivial to develop some general strategy to constraint the corresponding uncertainty; instead, we focused on the development of high-level
rep-resentation/matching techniques in order to bridge (or at least reduce) thesemantic gap.
In light of this, the final goal of this work is two-fold:
(i) overcome the actual constraints in trajectory representation and matching techniques
and develop an alternative solution capable of fully exploit the activity informational content of the object trajectories in real-time;
(ii) build a solution capable of discerning among different high-level activities by merging
Concerning the first goal, we propose to split complex trajectories into elementary segments and code them with an incremental symbolic-syntactic representation paradigm; in addition to interesting invariance properties, the proposed activity representation allows applying bio-inspired string-matching schemes [85][68] to evaluate the similarity among paths. In the same spirit of spell-check correctors, these algorithms rely on enhanced versions of the edit-distance, measuring the similarity among sequences as the number of elementary operations to bring on string into the other: elementary operations are the insertion, deletion, and substitution of a symbol, as well as the insertion of an empty gap. The key idea of this proposal is to extract and encode into high-level symbols the spatio-temporal signature of the activity, and employ a syntactical matching to reach a flexible comparison between activity patterns. The rules leading the matching procedure have to be designed and tuned according to the meaning of each symbol that for a tra-jectory represents a specific motion pattern. In Fig. 1.3, the flowchart of the proposed solution is sketched: after the stream acquisition and the object tracking phases (i.e., the light grey dashed block), the object trajectory signature extraction step and its sym-bolic coding are carried out. Finally, the matching phase provides for an approximate alignment between the considered sequences.
Such an approach introduce several advantages over the solutions proposed in the actual state of art:
• it allows an on-line symbols-based activity spatio-temporal representation and
com-parison;
• it includes the possibility of considering the invariance to shift, rotation, and scale;
• it offer a strong tool to effectively deal with the problems from the noise affecting
the sequences;
• it can be applied to sub-trajectory matching problems;
• it can be easily extended in multidimensional spaces.
In order to enhance the abstraction level in the activity representation, we also
ex-plored the use of a different representation paradigm, which encodes the activity through a
topological representation relying on some interesting areas (i.e.,hot spots). In this spirit,
thesignaturecorresponding to a given activity is represented with the concatenation of thehot spots the object has interacted with1. Intuitively, this second representation is in
general more robust to the noise, and it is capable of extracting a ’structural’ character-ization of the activity. In order to fully exploit this information, the patterns of a given activity are encoded according some automatically learned Context-Free Grammars rules: in this context, the activity detection/recognition is casted to a string-parsing problem. The adoption of CFG formalism significantly enhances the flexibility in the matching phase, allowing the activity reasoning module to handle particularly complex pattern
1
configurations. The main advantage introduced by this representation is its capability of catching the structural patterns characterizing a specific activity.
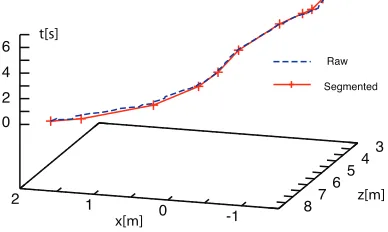
While working either in the symbolic or in the numerical domain, a fundamental
question arises about the optimal representation for trajectory comparison. The raw
representation is in general richer from an informative point of view, than any symbolic representation. However, given its sensibility to the noise, a quantization process is often
introduced. The noise power plays a crucial role: when it issmall, the application of a
quantizer would only deteriorate the representation (due to the quantization error), and thus the comparison results. Instead, when the noise power is large enough, the quantized data representation is intuitively more convenient. We formalized this idea in order to define a reasoning for obtaining the best representation for trajectory matching, under a set of assumptions for noise and trajectory data. The work is in a preliminary phase, however the results are promising. The paper has been submitted to a conference and it is under revision process.
1.4
Structure of the Thesis
The thesis is structured in 6 Chapters. The present section gave an introductory overview on the research context of the thesis, including the issues related to the automatic visual activity analysis, the contribution of this proposal, and the advances with respect to the state of art solutions.
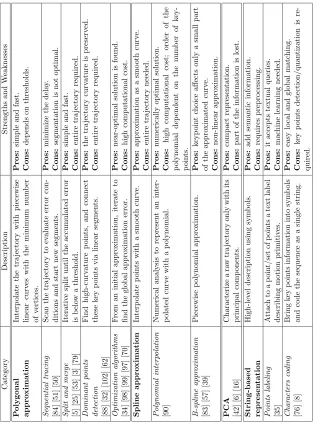
The initial section (Chapter 2) presents the literature about the techniques for trajec-tory representation and comparison. In this section several approaches are presented and compared, highlighting strengths and weakness of the selected solutions.
In Chapter 3 is presented a comprehensive description of the string-based represen-tation and matching strategy developed for activity detection in ambient intelligence applications. Here, the original two-dimensional formulation is given, while in Chapter 4 a three-dimensional extension of the algorithm is proposed together with an algorithm for the hierarchical trajectory classification.
Chapter 5 proposes an alternative solution for the trajectory-based event detection: here, a topological representation of the activity is considered, that is coded into a set of Context-Free Grammar rules. The sequence matching is carried out as a sophisticated string-parsing.
In Chapter 6 is reported a theoretical study on the effectiveness of symbolic and
nu-merical approaches for trajectory representation in presence of varying noise. This work aims at showing the advantages of a symbolic (i.e. quantized) signal representation with respect to a numerical (i.e., raw) representation in presence of significant noise. An opti-mization procedure is formulated in order to obtain the quantization scheme introducing the minimal signal distortion with respect to the noise-free signal versions.
Chapter 2
State of the Art
As underlined in the introduction section, the representation paradigm and the matching strategies play a crucial role in the process of automatically detect and/or recognize and activity pattern from video streams. Several alternatives have been proposed in the last years, in particular the focus of this chapter is to present a survey on the most recent advances in representation and analysis of video object trajectories for classification and recognition purposes. The main methodologies for the description of motion trajectories, as well as the matching techniques and similarity metrics will be reviewed. Strengths and weaknesses of the different solutions will be discussed through a comparative analysis, taking into account performance and implementation issues.
2.1
Trajectory representation
The problem of trajectory representation mainly consists of achieving an approximation of the raw path through some parametric curve. The simplest model consists in the use of chain codes [45], or piecewise linear approximations [72]. More accurate representations may use curvilinear approximations such as polynomials [90] or splines [61]. The above methods consider the trajectory as a 2D projection of the spatial displacement of the point in the scene, even though 3D representations are gaining considerable ground in the research community. In the following sections we will mainly focus on 2D representations, since they are more widespread. However, some of the methods introduced for 2D have a straightforward extension to 3D, also considering that in most cases the multidimensional
analysis can be carried out by combining different 2D views. Even though other features
such as velocity, motion direction, temporal offset, or view invariant tensor null-space
rep-resentations [17] [18] have been considered in the literature, for the sake of conciseness we will focus on spatial approximation, making it clear that the methods described hereafter could be extended to the other trajectory features.
Part of this Chapter appears in:
2.1.1 Polygonal approximation
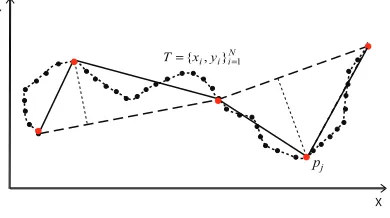
Polygonal approximation has been used in many pattern recognition problems, including shape and contour representation. The idea is to interpolate the raw trajectory with a piecewise linear curve with limited number of vertices. Since most of the information is connected to the points of maximum curvature, this representation turns out to be significant as well as compact. The resulting polygon should fulfill two requirements: (i) best fit of the original curve, and (ii) minimum number of segments. The two conditions
are conflicting, then a trade-offhas to be found by concurrently solving two optimization
problems:
• Error minimization problem: given a set ofN points representing a raw trajectory
T = {ti} ={xi, yi}Ni=1, find the polygonal curve P = {pj} = {xj, yj}Mj=1with a
number of line segmentsM, so that the approximation error!(T, P) is minimized.
• Number of dominant points minimization problem: given a set ofN points
repre-senting a raw trajectoryT, find the polygonal curveP with the minimum number
of segmentsMso that the approximation error!(T, P) does not exceed a maximum
tolerance!tol.
The most common criteria used for optimization are the compression ratioCR=N/M
and the integral square error [81] between vertices ofT and linear segments ofP. Fig.
2.1 shows a real trajectory and its approximation. The final number of segments varies according the reconstruction error threshold imposed. Many polygonal approximation
N i i
i y
x T={ , }=1
j
p Y
X
Figure 2.1: Polygonal approximation.
techniques have been proposed in the literature. Jointly optimal algorithms are quite
slow, with a complexity in the order ofO(N2) or evenO(N3). It is possible to reduce
the complexity toO(Nlog(N)) by focusing on one of the two minimization problems [14].
Heuristics are also widely used.
Approximation methods differ upon specific requirements, such as the application
most important approximation methods can be roughly classified into four categories: (1) sequential, (2) split & merge, (3) dominant point-detection, and (4) optimization algorithms approaches. In the next paragraphs we will provide a general overview of them.
2.1.1.1 Sequential tracing approaches
In sequential algorithms, the trajectory is progressively scanned and a mismatch condition evaluated, when the error exceeds a threshold a new segment is started. Algorithms are usually fast and can be applied in real-time, thus making them attractive in trajectory representation even though the accuracy of the approximation is quite limited. Among these methods, Sklansky and Gonzalez [84] proposed a scan-along procedure for digitized curves, which starts from a point chosen randomly and tries to find the longest line segments sequentially. Kurozumi and Davis [51] proposed instead a minimax method, which determines the segments by minimizing the maximum distance between a given set of points and the corresponding segment. Wall and Danielsson [92] proposed a sequential method, which scans the points and outputs a new segment when the area deviation per length unit of the current segment exceeds a pre-defined error. Ray and Ray [50] determine the longest possible line segments with the minimum possible error. All the aforementioned algorithms are designed to solve one of the minimization problems and
reach the solution inO(logN) orO(N) steps of binary search [14].
2.1.1.2 Split & merge methods
Split-based methods use a top-down approach where the coarsest approximation is the segment connecting the first and last point of the path. If the approximation is not satisfactory, it is refined by recursively splitting the segments until the accumulated error reaches a predefined threshold or the maximum number of segments is exceeded (see Fig. 2.2). Depending on the split procedure, the number of pieces at the end of the process may be higher than needed. In this case, a merging may occur to re-connect adjacent segments with similar direction. The depth of the split is driven by the application requirements and can be adjusted by varying the split criterion or the thresholds. The algorithm requires the availability of the whole path.
The most popular algorithm in this field is a heuristic method known as ”Douglas-Peucker” [24], adopted in both [5] and [25]. The iterative procedure splits the curve into smaller elements and, at each iteration, calculates the distance of each vertex from the original curve. The stop condition is fulfilled when the cumulative distance is smaller
than a given tolerance!. The complexity of the method isO(N2) in the worst case, and
O(NlogN) on average. Leu and Chen [53] presented a hierarchical merging method, which
Y
X
N i i
i y
x T={ , }=1
First approximation (I - E) Second approximation (I - A - E) Third approximation (I - B - A - E)
i
p
Init - I
A B
End - E
Figure 2.2: Polygonal approximation using iterative splitting.
& merge process is then applied to the obtained samples. Ray and Ray [79] proposed an orientation-invariant and scale-invariant method by introducing the use of ranks of points and normalized distances. In this case, the approximation returned by the split-and-merge may be far from the optimal one if the initial segmentation is not accurate.
2.1.1.3 Dominant point-detection methods
The core idea of this class of algorithms is that a shape is well represented by its high-curvature points [4]. Then, a contour can be described by using such points as the vertices of a piecewise linear interpolation. Several heuristics have been designed to this purpose. Teh and Chin [88] determine the curvature at each point based on a support region, and detect the dominant points through a non-maxima suppression process. Other approaches rely on the detection of salient points. Held et al. [32] first apply a coarse-to-fine smoothing to identify dominant points, and then decoarse-to-fine a hierarchical approximation based on perceptual significance. Zhu and Chirlian [102] determine the importance of each point by transforming the curve into polar coordinates and then calculating the relevant derivatives. In this class of algorithms it is also possible to identify methods that search for the most significant points using relaxation labeling [62]. The paper focuses on the contour extraction of shapes, but the extension of the work to trajectory analysis is straightforward. In this approach, the left and right slopes and the curvature are evaluated and associated with an attribute list to each point of the input curve. This information
determines the initial probability of the current point to be aside (a linear piece in the
case of a trajectory), or anangle(a point with strong curvature). The relaxation process
iteratively updates the probabilities until convergence. The obtainedangle points can
therefore be used as a meaningful representation of the whole trajectory.
evaluation of the curvature.
2.1.1.4 Optimization algorithms
The approximation problem is here considered as an optimization task where the global error is the cost to be minimized. The search of the solution that provides the minimum error can be performed by stochastic optimization methods (e.g., genetic algorithms [34], ant colony [98], particle swarm optimizations [99]), or by local optimization methods (e.g., tabu search [97] and vertex adjustment [70]). The initialization is obtained based on some heuristics, and the approximation is progressively improved towards the minimum of the global error. The final solution can be considered nearly optimal, although the global minimum is usually not guaranteed. In these algorithms, the trajectory points are typically examined in sequential order. The computational cost of these algorithms is pretty high, but the achievable results have a higher fidelity since they are specifically designed to climb local minima associated to suboptimal representations.
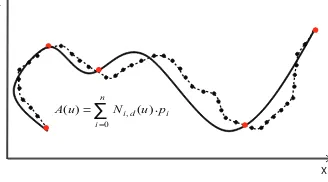
2.1.2 Spline approximation
A completely different approach consists in the use of splines [61]. Splines are smooth
curves (typically polynomials) that interpolate a set of points in a plane. Among the
many different spline types, B-Splines (a generalization of the B`ezier curves) are very
commonly adopted:
A(u) = n !
i=0
Ni,d(u)pi (2.1)
wherepi, i= 1,2, . . . , nare the control points andNi,d(u) are the B-spline basis functions
of orderd. Control points represent the points of the original trajectory. To create the
spline approximationA(u), a vector ofknotsU={u0, u1, . . . um−1}is needed. Given the
degree of the polynomialdandncontrol points, the number ofknotsmshould be equal
ton+d+ 1. U is a set of non-decreasing values in [u0, um−1] and all basis functions lie
in this interval. Thei-th basis functionNi,dis calculated using the Cox de Boor formula:
Ni,0(u) =
1 if ui≤u < ui+1
0 otherwise
Ni,d(u) =
u−ui
ui+d−ui·
Ni,d−1(u) +
ui+d+1−u ui+d+1−ui+1·
Ni+1,d−1(u). (2.2)
The spline approximation consists of determining the optimal coefficients of the
Spline approximation can be considered as a subset of the polynomial approximations used in many areas of computer graphics. In the specific case of video indexing and re-trieval it is mainly used to smooth the noisy path of a moving object in tracking. An
important property of the approximated curve is that it is invariant to affine
transfor-mations. Another advantage of the B-splines is that a local change in the raw trajectory
value does not affect the whole approximated curve, because each control vertex
influ-ences±k/2 segments of the polygon inu. A sample curve approximated using a spline
is shown in Fig. 2.3. Even though splines are usually computed directly on the raw
Y
X
∑
=
. =
n
i
i d
i u p
N u A
0 , ( )
) (
Figure 2.3: Spline approximation.
trajectory for computational reasons, it may be desirable to adopt a curvature detection algorithm to extract dominant points to be used as control points. The above problem can be formulated as a nonlinear optimization problem as follows. Given:
• a set of points of the raw trajectorytk, k= 1,2, . . . , Kin the plane
• a B-spline curveA(u) =%n
i=0Ni,d(u)piwith control pointspi
• the order and the knots of the B-spline curve (not subject to optimization)
find the control pointspi, i= 1,2, . . . , nsuch thatf, defined in (2.3), is minimized
f=1
2 K !
k=1
||A(u)−tk||2+λfs. (2.3)
wherefsis a regularization term to ensure a smooth curve, andλis a positive constant
that determines the weight offs.
2.1.3 PCA coefficients
trajectory only with its principal components, getting rid of all features that do not
convey significant information. Given a vector trajectoryT made by a set of random
variables and known correlation matrixC, thek−th principal component (PC) is given
by an orthonormal linear transformation:
P Ck=akT (2.4)
where ak is an eigenvector ofC corresponding to itsk−th largest eigenvalueλk.
Algo-rithms for the computation of the PCs are usually based on correlation or covariance [42]. Another approach that exploits PCA, is presented Bashir et al. in [6], where the authors first segment trajectories using a curvature zero-crossing approach, followed by a cluster-ing routine. The method applies then a two-level PCA analysis, in which the principal components are first extracted from the whole object trajectory, and successively ana-lyzed to determine the corresponding sub-trajectories. In other approaches the PCA is
applied to the null space representation [17], allowing achieving an affine invariant
repre-sentation used in retrieval and classification. In [18] [58] extensions of this reprerepre-sentation are proposed to allow the classification and retrieval of multiple interactive trajectories.
2.1.4 String-based (symbolic) representation
Syntax-based approaches convert the analytic representation of a trajectory into strings of symbols, to provide a description of the path with a higher-level of abstraction. String-based representation may be applied to raw trajectory samples, or to the approximated representation achieved by one of the methods described above. Once the key points of the trajectory are extracted, they are translated into symbols according to the associated spatio-temporal information, and aligned into strings. Once the information is in symbolic form, several approaches for matching can be considered, in particular it is possible to rely on some alignment strategies used in bioinformatics to match genomic sequences [68].
Different approaches can be used for bringing the numerical trajectory samples to a
symbolic domain. For example, a very naive approach is proposed in [20]: here, a static grid is built over the map of the environment, and a spatial sampling of the original path is operated followed by a merging procedure for removing the useless regions. In [40], the authors propose to use standard independent probabilistic event detectors over the incoming trajectory data (i.e., a bank of HMMs trained on each specific primitive they want to consider). Instead, the works in [35] and [76] consider some trajectory-related information (e.g., direction, local speed, and more).
String-based algorithms have been used in computer vision especially for shape clas-sification [29] and they have been introduced more recently in object trajectory represen-tation. For instance, in [95] the authors assume that each trajectory segment is labeled with a semantic symbol. Using the chain of successive symbols, a support vector machine
is trained to classify different events. In this case, the clustering scheme requires a lot of
can easily tackle the problem of partial matching, making it possible to detect sub-strings within the whole sequence of symbols. Furthermore, this representation allows to easily achieve the invariance to spatial shift and scaling. [76] provides a description of the trajec-tory using syntactical elements. Here, key trajectrajec-tory points are extracted and represented
by three characters, corresponding to angle, speed and temporal offset with respect to the
previous point, to achieve a full spatio-temporal representation.
The advantage of syntactical approaches is that the matching phase can be simply implemented as a matching of words, like in text processing tools, typically using similarity
metrics such as theedit distance[80]. As explored deeper in Section 2.2, other matching
approaches propose for this representation, relying for example on graphical probabilistic models (e.g., HMM, DBN, CFG).
Table 2.1 reports a comparative analysis of the representation methods cited above.
2.2
Trajectory matching
This section deals with matching strategies that can be adopted to measure the similarity among trajectories. In developing a matching algorithm several issues should be taken into account. In fact, the extraction of object trajectories from video streams is typically im-precise due to environmental noise, illumination variations, processing errors, occlusions,
and so on. The joint effect of these uncertainties typically leads to noisy trajectories that
contain gaps and outliers. Moreover, even trajectories referring to similar events may
present significant differences in several respects, such as initial direction and location,
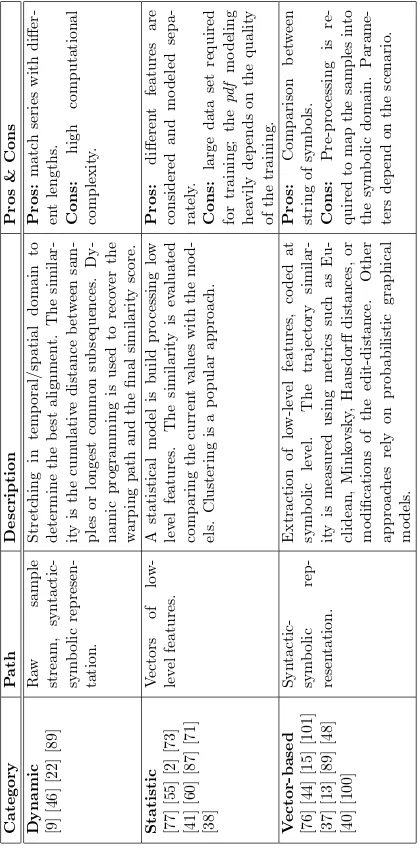
spatial length, temporal duration, and sampling rate, thus leading to mismatches. Accord-ing to the abstraction level adopted for trajectory representation, matchAccord-ing techniques can be roughly divided into three categories: dynamic, statistical, and vector-based. Dynamic
matching includes a set of simple yet effective comparison tools that can be applied to raw
or filtered samples, and are able to deal with limited trajectory misalignments. Statistical matching is more sophisticated and requires a pre-processing to extract a set of consistent low-level features, the similarity measure is then obtained by comparing the distribution of query and target samples in the feature space. Finally, vector matching algorithms rely on a high-level representation of the trajectories, where the feature vectors are mapped into symbols. This representation strongly simplifies the matching phase, which can be
achieved through simple metrics (e.g.,Lp-norm, Hausdorffor city block distances, string
alignment techniques) and weighted combinations of the features.
2.2.1 Dynamic matching
Methods referred to as dynamic matching are basic comparison tools, enabling the user
to process sequences of different lengths. This is a key feature, since in real applications
be operated either in the temporal or spatial domain, thus providing time warping and spatial warping, respectively.
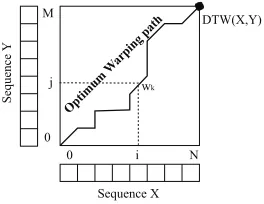
Concerning the temporal domain, dynamic time warping (DTW) is a distance measure used in 1-D time-series comparison [9]. Initially applied to speech signal analysis, it
has been recently extended with success to different application domains including sign
language recognition [46] and trajectory matching [36], because of its conceptual simplicity
and versatility. Basically, the method relies on a classic distance operator (e.g.,Lp-norm)
and on a particular matching procedure that finds the optimal alignment between the query and the target series, allowing temporally shifted matches between samples. The matching score is calculated as the cumulative distance among samples.
The distance between two generic seriesX={xn}Ni=0andY ={yn}Mj=0can be
mea-sured by constructing a warping path [46], as in Eq. (2.5):
W=w0, w1, . . . , wK max{N, M}< K <(N+M−1) (2.5)
where K is the length of the warp path and wk = (i, j) where i, j index X and Y,
respectively. The warping path involves all samples in the trajectory (i.e.,w0= (0,0) and
wK= (N, M)); moreover,iandjhave to be continuous (i.e., every index in all series has
to be used) and monotonically increasing. The distance betweenXandY is the optimum
warp path that minimizes the overall warping distance, satisfying Eq. (2.6):
DT W(X, Y) =min
& 1
K
'K !
k=1 wk
()
(2.6)
where,wkis the minimum distance between two samples indexes (one fromX, one fromY)
in thek−thelement of the warp path (see Fig. 2.4). DTW presents some major drawbacks
Sequence X
S
eque
nc
e
Y
DTW(X,Y)
Opti mu
m W arpi
ng p ath
i
0 N
j M
0
wk
Figure 2.4: DTW: optimum warping path construction.
in the sensitivity to noise and outliers. Furthermore, since the global similarity score is
evaluated on the basis of cumulative sample-to-sample distances, different sampling rates
very similar series. Finally, the computational complexity of the method is relatively high:
O((N+ 1)(M+ 1)) withN+ 1,M+ 1 length of the sequences. Dynamic programming
techniques are usually employed to effectively achieve the best alignment and to drastically
reduce the complexity. As an example, given the two sequencesX andY, the distance
DT W(X, Y) is calculated as:
DT W(Xi, Yj) =min
DT W(Xi, Yj−1) DT W(Xi−1, Yj)
DT W(Xi−1, Yj−1)
+d(xi, yi) (2.7)
where d(·,·) is a distance metric that strictly depends on the employed trajectory
rep-resentation, Xi = {x0, x1, . . . , xi−1} and Yj = {y0, y1, . . . , yj−1}. At each sample, the
warping distanceDT W(Xi, Yj) betweenXi andYj indicates the cumulative sum of the
local distanced(xi, yj) and the minimum of cumulative distances among adjacent samples.
In particular,DT W(Xi, Yj) is the optimum warping path between the firstisamples of
Xand the firstjofY. Regarding this measure, several advances have been carried out
al-lowing enhancing the robustness to noise [23] and reducing the computational complexity [47].
An improved approach is presented in [22], which nearly replicates the DTW matching scheme in the spatial domain with significant algorithmic enhancements. Given two se-quences, the Longest Common SubSequence (LCSS) is used to optimize the alignment by finding the longest subsequence between two trajectories. This concept provides a higher flexibility allowing non-consecutive samples and the insertion of gaps. This feature is
fun-damental, since it introduces the capability of (i) effectively processing paths of different
lengths, (ii) coping with different sampling rates, and (iii) partially handling problems
related to noise and outliers.
Fig. 2.5 sketches the difference between the alignments of the same two sequences,
obtained through temporal and spatial warping, respectively. LCSS leads to a more significant alignment, since it allows excluding some samples from the matching process; on the contrary, DTW requires to match every query sample, thus causing a one-to-many
0 10 20 30
(a)
0 10 20 30
(b) time [s]
time [s]
Module Module
association between query and target paths (Fig. 2.5-(a)). Similarly to DTW, LCSS relies
on standard distance metrics, although employed in a different way. While in DTW the
final score is evaluated by computing the sample-to-sample distance, in LCSS the distance is used to check whether two samples are correlated or not [89]. In particular, this strategy consists in checking if the samples in the target trajectory fall within a spatio-temporal region defined in the query. If the condition is verified, the match occurs. The matching
region is defined by two thresholds!andδ, in space and time, respectively.
Since the computational burden of the alignment process is quite high, also the LCSS scheme is usually implemented with dynamic programming techniques, with a
computa-tional complexity in the orderO((N+ 1)(M+ 1)). Given two 1D time seriesXandY, the
LCSS distance is evaluated by dynamically computing the matrix coefficients according
the following recursion:
LCSS!,δ(Xi, Yj) =
0 ifi= 0 orj= 0
1 +LCSS!,δ(Xi−1, Yj−1)) if|xi−yj|<!and|i−j|<δ
max .
LCSS!,δ(Xi−1, Yj),
LCSS!,δ(Xi, Yj−1) otherwise
(2.8) The LCSS algorithm outputs the length of the longest common subsequence between the series. A similarity score in the range [0-1] is then defined as follows:
S(X, Y,!,δ) = 1−LCSSmax!,δ(XM, YN)
{M, N} (2.9)
Although performing generally better than DTW, LCSS still presents some limits in dealing with significant noise or outliers, since the insertion of gaps is neither penalized nor taken into account in the aligned subsequence.
2.2.2 Statistical matching
In statistical matching, trajectory similarity is evaluated by analyzing the distribution of low-level features such as spatial location, local direction, or speed. In particular, these
methods aim at estimating the probability density functions (pdf) of relevant parameters
in order to build a statistical model of the target trajectory. Once the model has been defined, the similarity between query and target is calculated on the relevant distributions.
A statistical inference process associates the input sequenceT to the modelMnthat most
T Query path (input)
Path prototypes (output)
Mn Statistical
inference
(b) (a)
Path-prototype pairs (input)
Prototype statistics (output)
Prototypes (Mn) learning
Figure 2.6: Input/Output of statistic matching methods: (a) learning phase, (b) classification.
The methods belonging to this family are proved to be particularly robust against noise and outliers. Two major aspects have to be taken into account in statistical matching: (i) the definition of target models, and (ii) the definition of the matching strategy. As to the first point, models are usually obtained by processing a significant set of paths associated to a given activity and estimating the distribution of the relevant features: spatial location, moving direction, object speed, object acceleration. The second point requires the definition of suitable metrics to evaluate the similarity between the statistics of input and model.
Among statistical methods for trajectory analysis, clustering techniques are very pop-ular. In these techniques, similar paths are grouped together in clusters and compared against a query sample, to determine the class it belongs to, with a maximum similarity criterion. [77] proposes a strategy for trajectory distance measurement and clustering re-lying on Hidden Markov Models (HMM). The model of the path is build upon a mixture of HMMs and the similarity evaluation is performed by checking the statistical
distribu-tion of a given query over each model. More formally, considering two sequencesXand
Y, their distance is defined relying on their HMM parameterization as follows:
D(X, Y) =|L(X;λX) +L(Y;λY)−L(X;λY)−L(Y;λX)| (2.10)
whereλXandλY are the models forXandY, respectively, and the termsL(·;·) indicates
the likelihood of a path with respect to a model. It is worth noticing that when two sequences are similar, the cross terms are generally high. A major advantage of this approach is that the speed can be considered together with geometrical/spatial features of the trajectory. Moreover, the system can cope with the so-called uneven sampling instances (i.e., non-uniform trajectory sampling between consecutive points), which are typical of real-time tracking applications.
that considers the direction between consecutive track samples (i.e., it encodes the sta-tistical trend of the direction providing a rough path representation). Finally, a two step clustering is carried out: first, TDH information is exploited in a dominant-set clustering
algorithm to identify coarse clusters; second, the similarity between two pathsiandjis
calculated with the Bhattacharyya distance as follows:
BD(i, j) = [1−
N !
b=0
/
T DHibT DHjb]1/2 (2.11)
whereT DHibandT DHjbare thebthelements of the directional histogram for the paths
iandj, respectively. Once rough clusters have been identified, TRPS information is used
to refine them, and theLp-norm distance is used as metric.
More recently, [2] proposed an effective unsupervised clustering algorithm using
mean-shift to detect coarse clusters, and a merging procedure to group adjacent blobs and eliminate outliers. Even though this method outperforms the work in [55] in the presence of noise, both methods require a resampling phase, thus not ensuring the preservation of the original temporal information. Another interesting work for trajectory clustering in video surveillance can be found in [73], where a system is proposed, able to create and update the trajectory clusters as soon as the samples are acquired by the tracker. The
trajectory data are represented as concatenations of raw samplesT ={ti}={xi, yi}Ni=1,
while each clusterC is represented by a prototype, defined as a stream of raw
spatio-temporal locations in conjunction with an additional parameter (σ2
i) that indicates the
local variance of the cluster at timei:
C={ci}={xi, yi,σi}Mi=1 (2.12)
The metric to compare the incoming trajectoryT against each detected clusterCis
defined as the average normalized distance of every trajectory point (ti) from the nearest
point of the cluster, calculated within a variable-size temporal windowwicentered ini,
as follows:
D(T, C) = 1
n
N !
i=1
d(ti, C) ; d(ti, C) = min
j
0dist(t i, cj) √σj
1
j∈wi (2.13)
wheredist(., .) is the Euclidean distance.
proposed network topology, each output node represents one of the models and it is said to’win’ if the associated model is the nearest to the feature vector presented as query. Leaky neurons with short-term memory capabilities are employed, in order to model also the temporal nature of the paths. The major drawback of this technique is that it cannot handle sub-trajectories. Another critical issue lies in the vector quantization
phase, which provides apdf approximation relying on the point distribution of prototypes.
In particular, the number of the prototype vectors and their initial positioning within the feature space has to be manually defined. To cope with these problems, [60] proposes an improved method based on a completely autonomous system to detect anomalous motion. Such method extends [41], providing a learning module that ensures higher accuracy in the clustering phase and allows for an automatic setup of trajectory prototypes, i.e., the representative of the cluster. Each prototype is supposed to have a Gaussian distribution, and the anomaly detection is carried out by checking the fitness of the incoming path
over the available models, according to aMaximum-A-Posterioricriterion. To improve the
reliability of the system in detecting routes that range over wider time intervals a feedback to the neural network is introduced in [87], while Owens et al. in [71] employ a Kohonen self-organizing map [49]. The approach in [38] further improves [71] by introducing a new hierarchical network structure that allows faster learning.
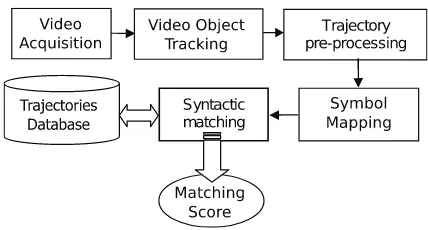
2.2.3 Vector matching
The general idea behind vector-based matching techniques is to extract a symbolic sig-nature of the path in the form of a feature vector, in order to evaluate the similarity between trajectory pairs on the basis of the distance of the relevant signatures [44]. The path signature is calculated in two phases: first, the features are extracted from the raw data; second, quantization and symbolic coding are performed. Since the information is
coded at the symbolic level, the vector distance can be effectively evaluated using simple
metrics (e.g., Euclidean, Minkovsky, or Hausdorff distances). In Fig. 2.7 the generic
flowchart of a vector-based matching is reported. The incoming path is pre-processed in order to bring its representation to a symbolic domain. The symbolic stream is then fed into the comparison routine to match the query with the signatures extracted from database entries.
Since the representation consists of a string of symbols, the comparison between tra-jectories can be casted to a string matching problem. The most popular metrics used in this context are based on the edit-distance [59], which defines the distance between two sequences as the minimum number of elementary operations required to convert one
string into the other. The allowed operations are: deletion,insertion and substitution.
Fig. 2.8-(a) reports an example of edit distance calculation between two textual strings,
wherenon-matchingcharacters are highlighted in bold. Referring to the alignment string,
pipestands for matching symbols,crossstands for symbol substitution, and-indicates a
symbol insertion. In this example it is easy to see that the final edit distance is 6 since
S1can be reverted toS2by substituting the symbol ”A” with ”P” and inserting 5gaps.
Feature vector
Symbolic signature Input
(query path)
Output (path prototypes) Feature vector
extraction
Quantization & Symbolic coding
Symbolic matching Prototype
database
Figure 2.7: Flowchart of vector-based matching methods.
approach. Given two strings of symbolsX=x0. . . xN and Y =y0. . . yM from a given
alphabet, a matrixEDofM+ 1 rows andN+ 1 columns is initialized and filled starting
from the upper left to the lower right corner, running the recursive algorithm reported in
Table 2.2-(top). Here,dis the penalty for the gap insertion and it is set to 1 (i.e.,d= 1),
while the symbol substitution cost assumes binary values (i.e.,cost= 0,1), depending
whether symbols match or not. Once the dynamic programming problem is solved, it
returns the final edit-distanceED(N, M).
HEAGAWGHE-E --P-AW-HEAE
HEAGAWGHE-E --x-||-||-| --P-AW-HEAE
GLOBAL ALIGNMENT EDIT DISTANCE
ED(S_1,S_2) = 6 INPUT SEQUENCES
AWGHE AW-HE
LOCAL ALIGNMENT
(a) (b) (c)
S_1=HEAGAWGHEE S_2=PAWHEAE
Figure 2.8: Comparison between (a) edit distance, (b) global alignment and (c) local alignment.
mapping may lead to long symbol chains where each sample is encoded as a symbol. In the same class of methods, [75] proposes a comparison strategy inspired by the alignment methods adopted in bioinformatics to match genomic sequences [68][85], also referred to asinexactorapproximate matching.
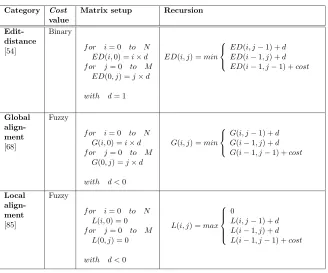
The adopted metrics rely on modifications of the Levenshtein distance. As for edit-distance, they are still based on the combination of elementary operations such as deletion, insertion and substitution of symbols, but they assign arbitrary scores to each of them, in order to make more flexible the fitness function. This kind of matching algorithms provide several advantages over the implementations described in Section 2.2.1. In particular, they provide a confidence parameter as compared to hard (match/no-match) criteria. Referring to the formula in Table 2.2, the modifications concern the evaluation of substitution costs, expressed as real numbers in the range [0−1]. Since alphabet of symbols is fixed,
substitution scores of each symbol pair can be encoded in a set ofsubstitution matrices.
The examples in Fig. 2.8-(b) and 2.8-(c) show the results achieved when matching the same pair of genetic sequences using a global and a local alignment, respectively. The global alignment [68] optimizes the score corresponding to the overall matching of the whole sequence, while the local alignment [85] searches for the most similar subsequences. Dynamic problems that have to be solved in order to recover global or local alignments
are fairly the same, except for the matrix initialization and some slight differences in the
recursive algorithm [68][85]. In [85] the first row and column of the dynamic matrix are
padded with zeros and the recursion is made using amaximumoperator over the same
entries as in edit-distance. In [68], the initialization follows the scheme of edit-distance and considers a negative score for gaps. The recursion part is instead the same as for the edit-distance. In Table 2.2 a schematization is reported to underline algorithmic
differences among edit-distance, global and local alignment.
Category Cost value
Matrix setup Recursion
Edit-distance [54]
Binary
f or i= 0 to N ED(i,0) =i×d f or j= 0 to M
ED(0, j) =j×d
with d= 1
ED(i, j) =min
ED(i, j−1) +d ED(i−1, j) +d ED(i−1, j−1) +cost
Global align-ment [68]
Fuzzy
f or i= 0 to N G(i,0) =i×d f or j= 0 to M
G(0, j) =j×d
with d <0
G(i, j) =min
G(i, j−1) +d G(i−1, j) +d G(i−1, j−1) +cost
Local align-ment [85]
Fuzzy
f or i= 0 to N L(i,0) = 0
f or j= 0 to M L(0, j) = 0
with d <0
L(i, j) =max
0
L(i, j−1) +d L(i−1, j) +d L(i−1, j−1) +cost
Table 2.2: Different metrics for comparison evaluation: (top) edit-distance, (center) Global alignment, (bottom) Local alignment.
provides a preprocessing phase to detect meaningful spatio-temporal discontinuities. Each
element is quantized in direction, velocity, and differential time, and then mapped into
a symbol triplet according to a predefined codebook. The matching among trajectories can be therefore expressed in terms of the highest score obtained by aligning the strings of symbols.
In Table 2.3 a comparison among the considered matching categories in terms of representation, strengths and weaknesses is reported.
gen-eral idea of these approaches is to extract sets of features from the low-level data and feed them into the probabilistic graphical model used to define the event structure.
As an example, the work in [26] implements a strategy to learn and recognize human ac-tivities through a special type of Hidden Markov Models (Switching Hidden Semi-HMM). A two-layer representation is proposed: in the bottom layer a sequence of concatenated Hidden Semi-Markov Model (generalization of HMM with random state duration) defines the atomic activities; the upper layer handles the temporal structure of the activities composing the event by means of a sequence of switching variables. In the same spirit, the authors of [69] proposed a Hierarchical HMM, in order to exploit both the hierarchical structure and the shared semantics contained in the movement trajectories. Moreover, they introduce a Rao-Blackwellised particle filter in the recognition engine in order to cope with real-time recognition constraints. Exploiting such a representation, the method first learns the actions of a subject from an unsegmented training data set, and successively performs an online activity classification, segmentation and anomaly detection. Among the purely probabilistic approaches, an alternative is proposed in [52] where a scalable approach for complex activity recognition is described. The system includes three major modules: a low-level action detector, for the extraction of sub-events from the low-level data, a Dynamic Bayesian Network that encodes the prior knowledge of sub actions or-dering constraints, and a Viterbi-based inference algorithm, used to maintain the most likely activity given the DBN status and the output of the low-level detectors.
The main advantage of these methods is the capability of handling the uncertainties generated during the low-level processing. On the other hand, as the event complexity increases, the recognition performance dramatically drops, due to a combination of factors
including insufficient training data, semantic ambiguity in the model of the process, or
temporal ambiguity in competing hypotheses. Although some methods for unsupervised parameter estimation of the graphical model have been proposed [10], the major problem remains the definition of the network topology, which is usually too complex to be learned from a sparse dataset, and is commonly pre-defined by human operators.
Some other approaches perform the activity recognition in a symbolic domain. In particular, in these works an intermediate step is introduced between the low-level fea-ture extraction and the high-level reasoning. The low-level primitive processing is carried
out in different ways (e.g., HMM or similar), while for the high-level behavior
as more complex tasks. In [65] the authors also use SCFG to extract high-level behaviors
from video sequences, in which multiple subjects can perform different separable activities.
An alternative approach is proposed in [43]. Here, the so-called attribute grammars [48] are employed as descriptors for features that are not easily represented by finite symbols. They provide, in other words, a formal way to define attributes for the production rules of a formal grammar. The final goal of the proposed work is to recognize activities and potential signal anomalies. In particular, the proposed framework can handle concurrent behaviors involving multiple entities, as well as uncertainties in semantic conditions on the attributes that are used to express a confidence measure over the recognized events.
A common drawback of the systems relying on formal grammars is in the definition and updating of the production rules. In fact, an exhaustive formalization and structur-ing of the observable activities a person can perform in everyday life, is in practice not available, since all possible actions cannot be defined a priori. For this reasons, in [31] a computational framework is proposed, able to recognize behaviors in a minimally super-vised manner, relying on the assumption that everyday activities can be encoded through
their local event subsequences, and assuming that this encoding is sufficient for activity
discovery and classification. In this work, the authors introduce the concept ofMotif,
defined as the most frequent subsequences that appeared in the data collection phase that may be associated to relevant atoms to be recognized as behaviors. The activity
recognition is then based on the discovery and matching of theMotif elements. However,
since behaviors are modeled using rigid variable-length event subsequences, the method is sensitive to the noise introduced for example by changing the order of the sub-events. Another major limitation of SCFG based system that prevent their use in real applica-tions is that the parsing strategy can handle only sequential relaapplica-tions between sub-events, with no capability in catching the parallel temporal relations often existing in complex events. Recently, to overcome this issue, the authors of [100] have proposed to extract the terminal symbols of a SCFG from motion trajectories. In particular, the motion
tra-jectories are transformed in a set of basic motion patterns (primitives) that are taken as
Chapter 3
Syntactic Matching of Trajectories
for Ambient Intelligence
Applications
In this chapter a novel approach is proposed for syntactic description and matching of object trajectories in digital video, suitable for classification and recognition purposes. Trajectories are first segmented by detecting the meaningful discontinuities in time and space, and are successively expressed through an ad-hoc syntax. A suitable metric is then proposed, which allows determining the similarity among trajectories, based on the so-called inexact or approximate matching. The metric mimics the algorithms used in bio-informatics to match DNA sequences, and returns a score, which allows identifying the analogies among different trajectories on both global and local basis. The tool can therefore be adopted for the analysis, classification, and learning of motion patterns, in activity detection or behavioral understanding.
3.1
Introduction
The growing interest in ambient-intelligence and the significant reduction in the price of image capture devices and digital signal processing systems, has contributed to the widespread adoption of video technologies in most monitoring and surveillance applica-tions. On the other hand, large and distributed sensing architectures provide human operators with huge amounts of data (mostly real-time video) that quickly overwhelm the ability of the security personnel to analyze and react to events, especially in safety-critical applications. As a matter of fact, most of the available consumer products mainly focus
Part of this Chapter appears in:
N. Piotto, N. Conci, F.G.B. De Natale, ”Syntactic Matching of Trajectories for Ambient Intelligence Applications” in IEEE Trans on Multimedia, v. 11, n. 9 (2009), p. 1266-1275.
on the recording of video sequences for after-event analysis that are useful as forensic tool, but disregard the primary benefit of surveillance systems as active and real-time prevention instruments. More sophisticated systems attempt to process data in real-time in order to detect significant events that need to be promptly reported to the operator. This is the case of systems for decision support, where the automation of certain proce-dures allows real-time detection of relevant events. Such events are typically related to changes detected in the monitored area, which can be caused by human actions (e.g., en-tering/exiting the scene, accessing some specific areas), modifications of the environmental conditions (e.g., objects relocation, objects left unattended, changes in illumination, pres-ence of shimmering lights or fire), or suspect behaviors (e.g., identification of specific movement patterns, interaction with objects in the scene). Most of these events are asso-ciated with the presence of moving entities like people and/or other objects in the scene. Nowadays, sophisticated and reliable object trackers can be found in the literature that make it possible to extract an accurate representation of the spatio-temporal trajectory of each object in a video sequence (see [36][96]) also in very complex scenarios. Starting from the acquired trajectory, a common way to detect activities or behaviors consists in translating the trajectories of the moving objects into sets of descriptors, and successively comparing such descriptors with predefined (or learned) models. This approach has been widely used in many application fields such as smart environments (motion is analyzed to understand people presence and behaviors [28][94][67]), content-based video indexing and retrieval [35], gesture and gait analysis [91], and biometry [93].
Starting from a preliminary study proposed in [75], we present in this work a complete representation and matching framework, and provide an in-depth description of the rel-evant processing techniques and a thorough experimental validation, also in comparison with state-of-art approaches of the same class.
The chapter is structured as follow: Section 3.2 give a qualitative overview of the proposed system, while Section 3.3 gives a more detailed description of the framework
architecture. Section 3.4 focuses on the experimental validation on two different sets of
trajectories in different indoor scenarios. Concluding remarks are drawn in Section 3.5.
3.2
Overview of the system
The implementation of an effective trajectory similarity metric requires a few preliminary
considerations. The extraction of object trajectories from video data is typically imprecise due to environmental noise, segmentation errors, and occlusions: these uncertainties typ-ically produce unreliable tracks containing gaps and misplacements. Moreover, the same
spatial trajectory could be associated to different duration, speed and acceleration
pat-terns. A good representation and matching strategy should be able to catch similarities
and differences in all these respects, assigning the appropriate weight to each parameter.
Figure 3.1: Application flowchart.
techniques do not provide a hard matching (i.e., point by point as in DTW), since they rely on modifications of the edit-distance [54].
Accordingly, we propose to segment the track in syntactic elements that represent significant substrings of the original trajectory that are used as basic symbols of a string representation. The structure of the symbols has been arranged according to a set of rules that ensure a flexible representation, as we will discuss in the following sections. The string-based representations are then aligned according the above strategies. An overview of the processing flow is shown in Fig. 3.1: raw trajectories are pre-processed to detect the spatio-temporal discontinuities, thus identifying a reduced set of meaningful trajectory segments. The concatenation of the obtained segments can thus be assumed to be an approximation of the original trajectory. The quantization of each segment in terms of direction, velocity and time, lets mapping each level into a symbol, selected from a pre-defined codebook. Then, the matching between two trajectories can be expressed as the cost of aligning the corresponding strings of symbols. The major advantages of this representation and the matching strategy we propose, can be summarized in two main points:
• reduction in the complexity of representation and matching and capability of
con-sidering the invariance to scale, rotation, temporal or spatial shifts;
• temporal and spatial features jointly contribute to the score calculation, thus leading
to a more accurate alignment, able to detect similarities on both global and local level.
Additionally, we highlight the capability of building the symbol stringon-the-fly, thus
making it possible to analyze the sequence and to evaluate the matching score in real-time, even if the complete trajectory is not available yet. The nature of the edit-distance turns
out to be effective also in tackling the local noise; in fact, the best match is found when
z[m]
x[m]
Figure 3.2: Object tracking and top-view trajectory.
level. An outlier in the trajectory may generate a very brief sequence of wrong symbols (1-2) associated to gaps in the alignment process.
3.3
The proposed approach
In this section we describe the proposed trajectory representation and matching algorithm. We would like to point out that video object tracking is beyond the scope of this work. We therefore adopted a state of art methodology. The trajectories we use consist of the
projection of the objectscentroidon the floor, which represent the top-view of the object
displacement in the environment. The tracking module we used is based on [19] for the background suppression stage, while the tracking algorithm uses a proximity criterion to detect adjacent blobs across frames based on their color appearance and distance. Since this would result in an inaccurate discrimination of objects in the presence of occlusions, we adopted a stereo camera to derive the depth information, through which it is possible to project the blobs on the ground floor and merge them accordingly. Analogous results can be obtained by using multi-camera systems. Fig. 3.2 shows an example of a moving object
detection and the corresponding top-view trajectory (x−zplane), where the coordinate
(0,0) refers to the camera position.
3.3.1 Trajectory segmentation and characterization
Starting from the raw trajectory extracted by the tracker, an on-line filtering is applied in order to identify the spatio-temporal discontinuities in the path (trajectory pre-processing in Fig. 2). The input of the pre-processor unit is:
wherexi
jandzijdetermine the top-view position of thei-th tracked object at the time
tj as shown in Fig. 3.2, andN is the number of trajectory samples. To detect sharp
velocity discontinuities in the object motion, and in particular stops/re-start events, the
coordinates of the object (xi
k, zik) are evaluated in the time window [tk, tk+l]. If t