Open Access
Research
Are fast food restaurants an environmental risk factor for obesity?
Robert W Jeffery*
1, Judy Baxter
1, Maureen McGuire
2and Jennifer Linde
1Address: 1Division of Epidemiology & Community Health, University of Minnesota School of Public Health, 1300 South 2nd Street, Suite 300,
Minneapolis, MN 55454-1015, USA and 2Guidant Corporation, Cardiac Rhythm Management Group, 4100 Hamline Ave., St. Paul, MN 55112,
USA
Email: Robert W Jeffery* - Jeffery@epi.umn.edu; Judy Baxter - baxter@epi.umn.edu; Maureen McGuire - maureen.mcguire@guidant.com; Jennifer Linde - linde@epi.umn.edu
* Corresponding author
Abstract
Objective: Eating at "fast food" restaurants has increased and is linked to obesity. This study examined whether living or working near "fast food" restaurants is associated with body weight.
Methods: A telephone survey of 1033 Minnesota residents assessed body height and weight, frequency of eating at restaurants, and work and home addresses. Proximity of home and work to restaurants was assessed by Global Index System (GIS) methodology.
Results: Eating at "fast food" restaurants was positively associated with having children, a high fat diet and Body Mass Index (BMI). It was negatively associated with vegetable consumption and physical activity. Proximity of "fast food" restaurants to home or work was not associated with eating at "fast food" restaurants or with BMI. Proximity of "non-fast food" restaurants was not associated with BMI, but was associated with frequency of eating at those restaurants.
Conclusion: Failure to find relationships between proximity to "fast food" restaurants and obesity may be due to methodological weaknesses, e.g. the operational definition of "fast food" or "proximity", or homogeneity of restaurant proximity. Alternatively, the proliferation of "fast food" restaurants may not be a strong unique cause of obesity.
Introduction
Rapid increases in the prevalence of obesity in the US over the last 20 to 30 years have been well documented and their causes much discussed [1-4]. Because of the speed of the change, it has been argued that the cause is more likely to be environmental change, broadly conceptualized to include physical and social factors, than to biological change. Exploration of data on environmental trends has identified a variety of potential environmental contribu-tors. One trend that has attracted particular attention in both the scientific and lay press is the dramatic increase in eating away from home, and particularly at "fast food"
outlets. The scientific case for "fast food" restaurants as a causal factor in obesity is based on several observations. First, time trends in eating away from home roughly par-allel the national time trends in obesity prevalence [5-10]. Second, although there is no clearly agreed upon defini-tion of the concept, "fast food" outlets have been by far the most rapidly expanding sector of the U.S. food distri-bution system [9,11,12]. Third, cross-sectional and longi-tudinal data on self-reported "fast food" restaurant use per se and consumption of foods frequently sold at "fast food" restaurants (e.g. hamburgers and French fries) have been shown to be positively associated with body weight
Published: 25 January 2006
International Journal of Behavioral Nutrition and Physical Activity 2006, 3:2 doi:10.1186/1479-5868-3-2
Received: 8 June 2005 Accepted: 25 January 2006
This article is available from: http://www.ijbnpa.org/content/3/1/2
© 2006 Jeffery et al; licensee BioMed Central Ltd.
[13-17]. Finally, nutritional analysis of products sold in "fast food" restaurants indicates that they are typically high in energy density, which provides a plausible mech-anism through which they might promote excess energy intake [18-20].
Available data on fast food use and obesity are far from conclusive, however. For example, the direction of causa-tion is unclear, i.e., the menus and prices at "fast food" res-taurants may result from the demands of an increasingly obese population rather than being a direct cause of obes-ity. It is also possible that a third variable, such as demo-graphics and lifestyle characteristics (e.g. an aging population with smaller families and a higher percent of two income families), may cause both phenomena.
To date, ecological studies on relationships between obes-ity and "fast food" restaurant exposure have largely focused on aggregate rather than individual level analysis. There is some evidence that there are more "fast food" res-taurants in geographic areas in which obesity prevalence is high (e.g. low income areas) [21-25]. A limited number of studies have also reported positive associations between aggregate measures of food outlet density in defined geographic areas and aggregate measures of obes-ity in those areas [22-26]. The only published study [27] that we are aware of that assessed relationships between exposure to "fast food" restaurants per se, and ease of access to them at an individual level, however, found no relationship. However, the sample was restricted to low-income children under the age of 5 years. The present investigation attempted to collect data that would bear further on this issue. A sample of individuals from a Mid-western state in the United States was identified and sur-veyed by telephone to assess body weight and frequency of patronage of "fast food" restaurant. The proximity of their home and work addresses to "fast food" restaurants and "non-fast food" restaurants was estimated using Glo-bal Index Systems (GIS) methodology. The association between these variables was examined. The overall hypotheses guiding the investigation was that the proxim-ity of "fast food" restaurants to individuals' homes and/or work settings would be predictive of how often they ate at those restaurants, and also would be predictive of body mass index (BMI) as a measure of obesity. We also exam-ined demographic and behavioral correlates of "fast food" eating.
Methods
This research was approved by the Institutional Review board of the University of Minnesota. Participants in this investigation were 1,033 residents of the state of Minne-sota identified in a random digit-dial telephone survey. Individuals were told the survey was being conducted by the University of Minnesota to identify patterns of eating
away from home and attitudes towards it. The survey took approximately 10 minutes to complete. All adults over the age of 18 were eligible to complete the survey. Survey respondents were asked questions about their demo-graphic characteristics, their height and weight, and their eating habits with particular emphasis on frequency of eating away from home. They were also asked for their home and work addresses. The variables used in the cur-rent analysis are reported height and weight from which BMI was calculated (kg/m2), gender, education, marital
status, employment status, household size, number of children, hours of TV watched per week, frequency of reported dieting for weight control, days per week in which individuals reported being physically active for 30 minutes or more, frequency of eating at "fast food" restau-rants, and frequency of eating at other restaurants. All of the above were assessed (see Table 2 for sample sizes available for each item) with single item questions. Qual-ity of diet was estimated using a series of questions designed for this study asking people how often in the past week they ate the following high-fat foods: tacos or burritos; hamburgers of cheeseburgers; fried chicken or fried fish; hot dogs, franks, or bratwurst; cold cuts or lunch meats; pizza; fries or onion rings; potato chips, corn chips or popcorn; ice cream of milk shakes; and doughnuts, pas-tries, cake or cookies. A total fat score was calculated by summing frequencies across items.
center of the circles. These distances were based on the expectation that they could be reached by foot or motor vehicle (more likely in the U.S.) in a short period of time.
Food outlet density was defined by the GIS, which calcu-lated number of food establishments. Analyses are con-ducted using all available data. When data were missing, cases were dropped if all variables in the specific analysis were not present. Two kinds of analyses were performed on the data. Logistic regression analyses were first used to identify variables associated with eating out at "fast food" restaurants one or more times per week compared to fewer times. The second set of analyses examined relation-ships among body mass index, the number of times per week people reported eating at "fast food" restaurants and other restaurants, and the number of "fast food" or other
restaurants within different distances from their home and work addresses. These analyses used linear regression models controlling for age and education, both of which are related to body weight and to place of residence. Initial analyses were stratified by gender. If there were no differ-ences in the relationship by gender, men and women were included in the same analysis with gender as a covariate. The numbers of restaurants at different distances were highly correlated, and the analyses results were very simi-lar for each distance. Analyses results reported here are for the 2-mile radius.
Results
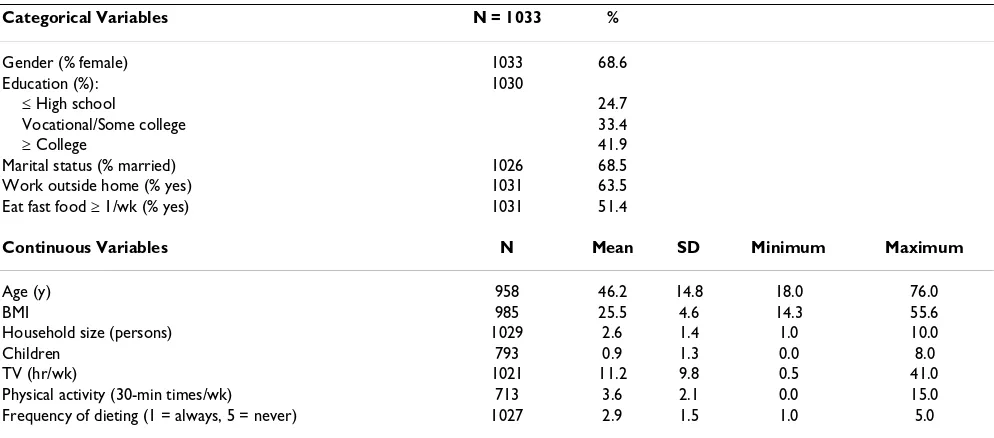
Table 1 presents descriptive statistics on the study partici-pants. Approximately two-thirds were women. The distri-bution of reported educational attainment was broad, with approximately one quarter reporting high school education or less and 40% reporting college education or more. The majority of the respondents were married, and most worked outside the home. The average age of respondents was 46 years, average BMI was approximately 26 kg/m2, average family size was 2.6 individuals (one of
whom was a child), average reported TV hours watched per week was 11.2, physical activity for 30 minutes or more was reported on 3.6 days per week on average, and participants mean reported frequency of dieting to control weight was about midway on a 5 point scale anchored by Always at one end and Never at the other. Reported fre-quency of fast food eating was similar to that found in pre-vious surveys in this population [13]. The achieved sample was clearly older than the population average, more female, and of higher education. It is believed, how-ever, that there was a fairly broad representation of indi-viduals in the geographic area.
Table 2: Factors Associated with Fast Food Eating* (≥ one time per week)
N Odds ratio
CI of odds ratio
P
Married 949 1.105 0.82–1.49 0.51 Any children 759 1.875 1.36–2.59 0.001 Number of children 759 1.137 1.002–1.29 0.05 Household size 952 1.067 0.97–1.18 0.20 Work outside home 952 1.319 0.97–1.79 0.08 Any physical activity (yes) 953 0.695 0.51–0.95 0.02 Physical activity/week 682 0.916 0.85–0.99 0.03 TV (hr/wk) 942 1.014 0.999–1.03 0.07 Frequency of dieting 951 1.027 0.94–1.13 0.58 Fat summary score 954 1.128 1.09–1.16 0.001
Fruit 947 0.945 0.86–1.05 0.27
Vegetables 947 0.837 0.75–0.93 0.001
* Adjusted for age, education, and gender. Table 1: Characteristics of Survey Respondents
Categorical Variables N = 1033 %
Gender (% female) 1033 68.6
Education (%): 1030
≤ High school 24.7
Vocational/Some college 33.4
≥ College 41.9
Marital status (% married) 1026 68.5
Work outside home (% yes) 1031 63.5
Eat fast food ≥ 1/wk (% yes) 1031 51.4
Continuous Variables N Mean SD Minimum Maximum
Age (y) 958 46.2 14.8 18.0 76.0
BMI 985 25.5 4.6 14.3 55.6
Household size (persons) 1029 2.6 1.4 1.0 10.0
Children 793 0.9 1.3 0.0 8.0
TV (hr/wk) 1021 11.2 9.8 0.5 41.0
Physical activity (30-min times/wk) 713 3.6 2.1 0.0 15.0
Results of the GIS analysis indicated that on average, there were 39 restaurants of all types within 2 miles of a home address and 94 within 2 miles of a work address. Compa-rable numbers for "fast food" restaurants were 15 and 32 for home and work site addresses, respectively. The seem-ing high density of food establishments in this sample may in part be to the fact that about 3/4 of the population of Minnesota is urban. We do not know how these densi-ties compare with those found elsewhere.
Table 2 shows the relationship between demographic and behavioral characteristics and reported eating at "fast food" restaurants at least once per week. Having children in the home was associated with significantly higher rates of reported eating at "fast food" restaurants, as was work-ing outside the home and reportwork-ing a higher fat intake. Vegetable intake and frequency of participating in physi-cal activity were inversely related to frequency of reported "fast food" restaurant use.
Table 3 reports the association between body mass index and reported frequency of eating at restaurants. As has been reported by others, we found a significant positive association between BMI and frequency of reported eating at "fast food" restaurants. We found no association between BMI and frequency of reported eating at "non-fast food" restaurants.
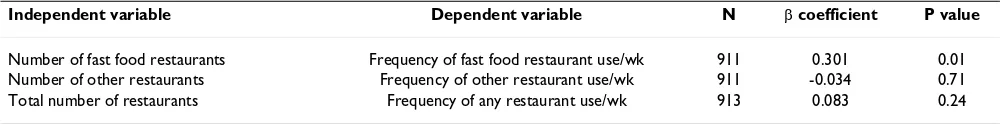
Table 4 shows the association between the number of res-taurants within 2 miles of individuals' homes and the fre-quency with which they reported eating at those restaurants. Proximity of "fast food" restaurants to
peo-ple's home was not significantly related to the frequency with which they reported eating at these restaurants. How-ever, proximity of "non-fast food" restaurants was posi-tively associated with frequency with which people reported eating at those restaurants. Analyses examining similar relationships for work rather than home addresses, we found no relationship for either men or women between reported restaurant eating frequency and proximity of restaurants to work addresses.
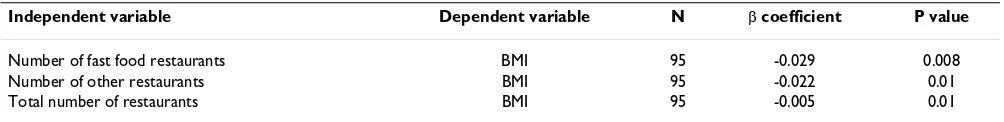
The final analyses reported here examined the relation-ships between body mass index and proximity of restau-rants to home and work addresses. We found no relationship between BMI and restaurant proximity to home addresses for either women or men. For men only, however, we found a significant inverse relationship between BMI and restaurant proximity (both "fast" and "non-fast" food). Men with more restaurants close to their places of work were leaner. The relationships for men are shown in Tables 5 and 6.
Discussion
The results of this investigation provide mixed evidence in regard to the potential effects of a proliferation of conven-ience food outlets on obesity in the US population. The study showed that how often people report eating at "fast food" restaurants is associated with higher weight and less healthy eating habits. It also showed that working outside the home and having children were associated with higher frequencies of "fast food" restaurant patronage. We also found that the accessibility of restaurants, defined as the number of restaurants within a 2-mile radius of home addresses, was predictive of frequency of reported overall restaurant usage, although not frequency of reported "fast food" restaurant usage. Number of restaurants near peo-ple's homes was not associated with BMI. For men only, the number of restaurants near to work addresses was inversely associated with BMI. Overall, therefore, these data seem consistent with the idea that geographic density of restaurants may increase the likelihood that people will eat away from home. We did not, however, find a strong link between obesity itself and restaurant exposure varia-bles.
Table 4: Associations of Reported Fast Food and Other Restaurant Use (per week) with Numbers of Restaurants Within 2 Miles of Home*
Independent variable Dependent variable N β coefficient P value
Number of fast food restaurants Frequency of fast food restaurant use/wk 911 0.301 0.01 Number of other restaurants Frequency of other restaurant use/wk 911 -0.034 0.71 Total number of restaurants Frequency of any restaurant use/wk 913 0.083 0.24
*Adjusted for age, education, and gender. Address failure
10.5% of home addresses failed to match (of 1030) 5.4% of work addresses failed to match (of 278)
Table 3: Associations between BMI and Reported 'Fast' and Other Food Restaurant Use*
Independent variable (times/wk
≥ 1 vs. none)
N P value β coefficient
'Fast' food restaurant use 911 0.02 0.301 Other restaurant use 913 0.71 -0.034 Total restaurant use 911 0.25 0.084
Given the amount of attention that has been focused on the "fast food" restaurant as a toxic element in our envi-ronment that promotes obesity, possible reasons for not finding any relationship between ease of access to such establishments and obesity in our population sample merits additional comment. There are several possible rea-sons why a real effect might not be detected in this data set. These include the following. The availability of "fast food" restaurant outlets may be relatively homogenous across the U.S. environment or, alternatively, even though different areas have different densities of restaurants, all have enough access that physical access is not a limiting factor governing restaurant patronage. If this is true, addressing the question of whether the number of "fast food" restaurants in an environment are associated with obesity might require a wider range of exposure levels than are possible in a limited geographic environment, e.g. international comparisons.
A second possible reason for failing to find the expected "fast food"/obesity relationship is that the ability to do precise analysis of relationships between "fast food" expo-sure and obesity may be limited by imprecision in the def-inition of "fast food" and the defdef-inition of "exposure." The prototypical "fast food" outlet is characterized by a relatively limited menu and food preparation options, quick service, paying for meals before they are received, no wait staff, and the option to consume the meal at the restaurant or take it out. However, there are wide varia-tions in these elements in real world settings and which of these, if any, are key is unknown. Some fast food restau-rants are also more heavily advertised than others, a factor which also was not taken into account in our definitions. Similarly, defining proximity as a linear distance from a place of residence or place of work may be too simplistic a definition of exposure. Much more germane might be access at particular points in time and space when a
per-son is in a particular need for something to eat (e.g. in route to a child's sporting event). Thus, location of pri-mary domicile or work site may be only one of many var-iables related to "fast food" restaurant usage. Third, the database available for GIS mapping of food outlets may be sufficiently error prone to make identification of char-acteristics of particular food outlets from SIC codes prob-lematic. Are the codes up to date, do they actually capture current conditions in every food outlet, who provides the information for the categorization to begin with and how accurate is it? Examination of these questions would require significant additional effort and resources.
Lastly, it needs to be recognized that "fast food" restau-rants may not in themselves make a major independent contribution to obesity. If we live lifestyles which are con-ducive to positive energy balance due in part to excess energy intake, the existence of convenience food outlets may be at least in part the consequence of the way in which lifestyles affect consumer demands for food con-venience, palatability and price (e.g. multiple family breadwinners, long work hours and multiple overlapping schedules of family members made possible by increasing affluence) rather than a reaction to industry marketing activities.
Conclusions
Reported eating at fast food restaurants was associated with having children, with poorer eating and exercise hab-its and with higher BMI. This study was unable to find a relationship between any measure of restaurant proximity and BMI.
Acknowledgements
This research was supported by Grant DK50456 from the National Insti-tute of Diabetes and Digestive and Kidney Diseases. We wish to acknowl-edge Claritas, Inc. for their assistance with GIS coding.
Table 6: Associations Between BMI and Numbers of Restaurants Within 2 Miles of Work in Men*
Independent variable Dependent variable N β coefficient P value
Number of fast food restaurants BMI 95 -0.029 0.008
Number of other restaurants BMI 95 -0.022 0.01
Total number of restaurants BMI 95 -0.005 0.01
*Adjusted for age and education (results for Females are NS)
Table 5: Associations Between BMI and Numbers of Restaurants Within 2 Miles of Home in Men*
Independent variable Dependent variable N β coefficient P value
Number of fast food restaurants BMI 305 -0.011 0.20
Number of other restaurants BMI 305 -0.008 0.27
Total number of restaurants BMI 305 0.002 0.26
Publish with BioMed Central and every scientist can read your work free of charge "BioMed Central will be the most significant development for disseminating the results of biomedical researc h in our lifetime."
Sir Paul Nurse, Cancer Research UK
Your research papers will be:
available free of charge to the entire biomedical community
peer reviewed and published immediately upon acceptance
cited in PubMed and archived on PubMed Central
yours — you keep the copyright
Submit your manuscript here:
http://www.biomedcentral.com/info/publishing_adv.asp
BioMedcentral
References
1. Hedley AA, Ogden CL, Johnson CL, Carroll MD, Curtin LR, Flegal KM: Prevalence of overweight and obesity among US chil-dren, adolescents, and adults, 1999–2002. J Am Med Assoc 2004, 291(23):2847-2850.
2. Flegal KM, Kuczmarski RJ, Johnson CL: Overweight and obesity in the United States: Prevalence and trends, 1960–1994. Int J Obes 1998, 22:39-47.
3. Jeffery RW, Utter J: The changing environment and population obesity in the United States. Obes Res 2003, 11(suppl):12S-22S. 4. French SA, Story M, Jeffery RW: Environmental influences on eating and physical activity. Annu Rev Public Health 2001, 22:309-335.
5. Kinsey JD: Food and families' socioeconomic status. Am J Clin Nutr 1994:1878-1885.
6. Binkley JK, Eales J, Jekanowski M: The relation between dietary change and rising U. S. obesity. Int J Obes 2000, 24:1032-1039. 7. Pereira MA, Kartashov AI, Ebbeling CB, Van Horn L, Slattery ML,
Jacobs DR Jr, Ludwig DS: Fast-food habits, weight gain, and insu-lin resistance (the CARDIA Study): 15-year prospective anal-ysis. Lancet 2005, 365:36-42.
8. Nielsen SJ, Siega-Riz AM, Popkin BM: Trends in food locations and sources among adolescents and young adults. Prev Med 2002, 35:107-113.
9. Lin B-H, Frazão E, Guthrie J: Away-from-home foods increas-ingly important to quality of American diet. Agriculture informa-tion Bulletin No (AIB749) 1999:32.
10. Buthrie JF, Lin BH, Frazao E: Role of food prepared away from home in the American diet, 1977–78 versus 1994–96: Chan-ages and consequences. J Nutr Educ Behav 2002, 34:140-150. 11. U.S. Bureau of the Census: Economic Census. 1967, 1977, 1987, and
1997 Washington, DC: US Department of Commerce.
12. National Restaurant Association: Restaurant industry numbers: 25-year history, 1970–1995 Washington, DC: National Restaurant Associa-tion; 1998.
13. Jeffery RW, French SA: Epidemic obesity in the United States: Are fast foods and television viewing contributing? Am J Public Health 1998, 88(2):277-280.
14. French SA, Jeffery RW, Forster JL, McGovern PG, Kelder SH, Baxter JE: Predictors of weight change over two years among a pop-ulation of working adults: The Healthy Worker Project. Int J Obesity 1994, 18:145-154.
15. French SA, Harnack L, Jeffery RW: Fast food restaurant use among women in the Pound of Prevention study: Dietary, behavioral and demographic correlates. Int J Obes 2000, 24:1353-1359.
16. McCrory MA, Fuss PJ, Hays NP, Vinken AG, Greenberg AS, Roberts SB: Overeating in America: Association between restaurant food consumption and body fatness in healthy adult men and women ages 19 to 80. Obes Res 1999, 7:564-571.
17. Prentice AM, Jebb SA: Fast foods, energy density and obesity: A possible mechanistic link. Obes Rev 2003, 4:187-194.
18. Burns C, Jackson M, Gibbons C, Stoney RM: Foods prepared out-side the home: Association with selected nutrients and body mass index in adult Australians. Public Health Nutr 2002, 5(3):441-448.
19. Bowman SA, Vinyard BT: Fast food consumption of U.S. adults: Impact on energy and nutrient intakes and overweight sta-tus. J Am Coll Nutr 2004, 23:163-168.
20. Paeratakul S, Ferdinand DP, Champagne CM, Ryan DH, Bray GA: Fast-food consumption among US adults and children: Die-tary and nutrient intake profile. J Am Diet Assoc 2003, 103:1332-1338.
21. Reidpath DD, Burns C, Garrard J, Mahoney M, Townsend M: An ecological study of the relationship between social and envi-ronmental determinants of obesity. Health Place 2002, 8(2):141-145.
22. Cummins SC, McKay L, MacIntyre S: McDonald's restaurants and neighborhood deprivation in Scotland and England. Am J Prev Med 2005, 29:308-310.
23. Maddock J: The relationship between obesity and the preva-lence of fast food restaurants: State-level analysis. Am J Health Promot 2004, 19:137-143.
24. Block JP, Scribner RA, DeSalvo KB: Fast food, race/ethnicity, and income: A geographic analysis. Am J Prev Med 2004, 27:211-217.
25. Swinburn B, Egger G, Raza F: Dissecting obesogenic environ-ments: The development and application of a framework for identifying and prioritizing environmental interventions for obesity. Prev Med 1999, 29:563-570.
26. Chou SY, Grossman M, Saffer H: An economic analysis of adult obesity: Results from the Behavioral Risk Factor Surveil-lance System. J Health Econ 2004, 23:565-587.