RESEARCH ARTICLE
Novel characterization techniques
for cultural heritage using a TEM orientation
imaging in combination with 3D precession
diffraction tomography: a case study of green
and white ancient Roman glass tesserae
Stavros Nicolopoulos
1*, Partha P. Das
1,2, Pablo J. Bereciartua
3,12, Fotini Karavasili
4, Nikolaos Zacharias
5,
Alejandro Gómez Pérez
1, Athanassios S. Galanis
1, Edgar F. Rauch
6, Raúl Arenal
7,8, Joaquim Portillo
1,9,
Josep Roqué‑Rosell
10, Maria Kollia
11and Irene Margiolaki
4Abstract
We present new transmission electron microscopy (TEM) based electron diffraction characterization techniques (ori‑ entation imaging combined with 3D precession electron diffraction tomography‑ADT) applied on cultural heritage materials. We have determined precisely unit cell parameters, crystal symmetry, atomic structure, and orientation/ phase mapping of various pigment/opacifier crystallites at nm scale which are present in green and white Roman glass tesserae. Such TEM techniques can be an alternative to Synchrotron based techniques, and allow to distinguish accurately at nm scale between different crystal structures even in cases of same/very close chemical composition, where is also possible to visualize between different crystal orientations and amorphous/crystalline phases. This study additionally demonstrates that although opacifiers in green and white tesserae are found to have average Pb2Sb2O7 cubic and CaSb2O6 trigonal structures, their pyrochlore related framework can host many other elements like Cu, Ca, Fe through ionic exchanges at high firing temperatures which in turn may also contribute to the tesserae colour appearance.
Keywords: Roman glass tesserae, TEM, Electron crystallography, Precession electron diffraction, Electron diffraction tomography, Phase and orientation mapping at nm scale
© The Author(s) 2018. This article is distributed under the terms of the Creative Commons Attribution 4.0 International License (http://creat iveco mmons .org/licen ses/by/4.0/), which permits unrestricted use, distribution, and reproduction in any medium, provided you give appropriate credit to the original author(s) and the source, provide a link to the Creative Commons license,
and indicate if changes were made. The Creative Commons Public Domain Dedication waiver (http://creat iveco mmons .org/
publi cdoma in/zero/1.0/) applies to the data made available in this article, unless otherwise stated. Introduction
The scientific study of ancient glass and ceramic pigment is very important in archaeometric research and involves a significant amount of various analytical techniques like e.g. XRF (X-Ray Fluorescence), EDS (Energy-Dispersive X-Ray spectroscopy), EPMA (Electron Probe Microanal-ysis), XRD (X-Ray Diffraction) and Raman to characterise various phases that may contribute to colour. Unfortu-nately all such techniques either lack spatial resolution
(micron instead of nm size probe) and/or their results are often not conclusive due to possible co-existence of many phases present within the analyzed volume area.
On the other hand, the use of totally non- or quasi non-destructive techniques is often a requirement to allow the analytical examination of unique artefacts. The emergence of new—TEM based-technique like orienta-tion imaging and crystallographic phase mapping at nm scale (ASTAR) gives very promising results in the study of nanomaterials [1].
TEM orientation imaging has been used the last years for structural characterization of various metals, alloys, ceramics, semiconductors, nanoparticles etc. [2]. On
Open Access
*Correspondence: [email protected]
the other hand, additional emerging—TEM based tech-nique—called ADT (Automated 3D diffraction preces-sion tomography) has also been recently used for crystal structure analysis of individual nanoparticles (e.g. pre-cipitates in metals, alloys, nanostructures, organic mate-rials etc.) establishing itself as an important alternative to Synchrotron X-Ray bases techniques [3, 4]. The com-bination of both ADT with ASTAR has allowed to solve complex problems in materials science but both tech-niques only very recently have been introduced for the
study of cultural heritage materials [5, 6]. The present
study forms part of an ongoing research on Roman glass tesserae excavated in Ancient Messene Greece having as main aim to shed light on the complex pigment colour chemistry in ancient Roman tesserae [7], the first part of the study regarding blue and yellow tesserae being pre-sented elsewhere and the data of the study on a green and a white tesserae are presented here highlighting the potentials of the techniques in the study of cultural herit-age materials [8].
Materials and methods Sample preparation
Two different thin/electron beam transparent
lamel-lae (4 × 4 microns size and approximately 100 nm thick)
were prepared by means of Focused Ion Beam (FIB). Those slices were FIB cut (using Ga ions during several
hours) from larger tesserae fragments having green and
white colours (Additional file 1: Fig. S1). All samples were lifted out from FIB on to specific TEM grids for subse-quent observation and examination with ASTAR and ADT techniques.
Technique and instrumentation
For FIB specimen preparation the FEI Dual Beam Helios NanoLab600 at LMA Zaragoza (Spain), was used. The FIB protocol for lamella preparation was the standard one (in parenthesis, the acceleration voltage and the FIB current are specified) following the next steps: (1) depo-sition (via focused electron and ion beam depodepo-sition) of some amount of Carbon in the area of interest to pro-tect the top portion of the sample; (2) the milling of the trench/slice in the sample area where the Carbon has been deposited (30 kV–2.5 nA); (3) the polishing of this trench/slice (30 kV–0.23 nA); (4) the undercutting of the trench/slice (30 kV–2.5 nA); (5 and 6) cut-off and lift-out; (7) final thinning (5 kV–68 pA) once the lamella is already welded to the special TEM Cu support. For TEM/STEM (scanning transmission electron microscopy) observa-tions, a TEM Jeol 2100 (LaB6, 200 kV) at the University of Patras (Greece) and a TEM Jeol 2100F (FEG, 200 kV) equipped with “Digistar” precession system (NanoME-GAS SPRL, Belgium) at UPV-Valencia (Spain) and at
SiMap (Grenoble, France) were used [9]. The chemical composition from the polished cross thin sections were obtained by means of EPMA (Electron Microprobe Ana-lyzer) using a JEOL JXA-8230 at the Centres Científicsi Tecnològics of the Universitat de Barcelona (Spain). The measurement conditions were 20 kV, at 15 nA probe current, spot size of ca. 2 µm and counting time of 20 s per element. The calibration standards used were: hem-atite (Fe, LIF, Kα), rutile (Ti, PET, Kα), periclase (Mg,
TAP, K Mn, LIF, Kα), rhodonite (Mn, LiF, Ka), Al2O3
(Al, TAP, Kα), metallic antimony (Sb, LIF, Lα), metallic
tin (Sn, LIF, Lα), diopside (Si, TAP, Kα), CuO2 (Cu, LIF,
Kα), wollastonite (Ca, PET, Kα), metallic silver (Ag, LIF, Lα), metallic cobalt (Co, LIF, Kα), albite (Na, TAP, Kα), orthoclase (K, PET, Lα), galena (Pb, LIF, Lα), AgCl (Cl, PET, Kα) and Celestine (S, PET, Kα). The EMPA point analyses and the elemental maps were performed directly on the carbon-coated surface of the sample on selected spots corresponding to the different regions of interest in order to probe both the glaze and pigments chemical composition.
The STEM EDS (X-Ray analysis) spatial resolution was of range of 3–5 nm (in case of TEM-FEG microscope) more suitable than the EPMA spatial resolution close to 1 micron to study the tesserae pigments. However, the EPMA compared to EDS provides a much better energy resolution for the selected emission lines (5–20 eV vs 130–150 eV for STEM-EDS). Therefore it was very use-ful in our study to combine high resolution STEM-EDS with high energy resolution EPMA to study crystals composition.
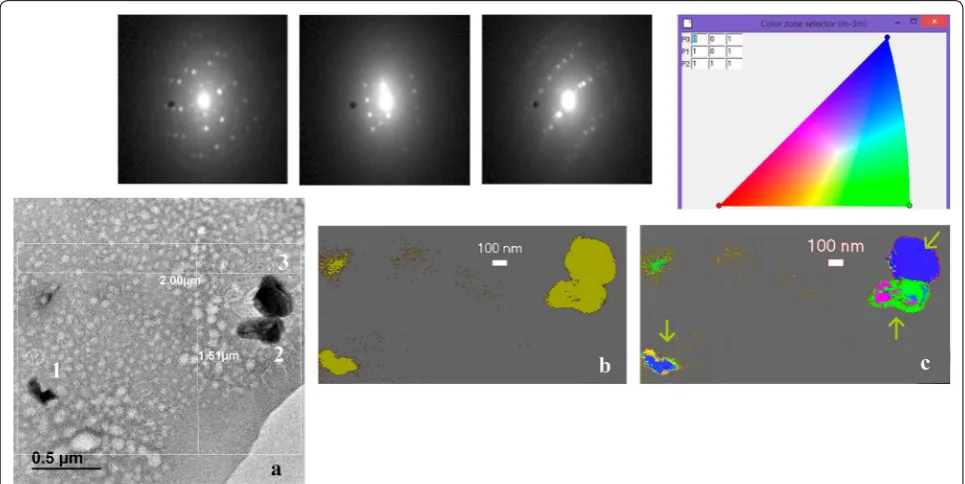
The orientation imaging and phase mapping in ASTAR technique is performed through automated collec-tion of electron diffraccollec-tion (ED) patterns on an area of several nm while scanning the area of interest with nm beam size; the collected ED patterns were fitted through template matching with pre-calculated theoretical ED patterns (templates) of all possible existing phases and relative orientations (Fig. 1). The resulting coloured crys-tal orientation map has usually a 1–3 nm spatial resolu-tion (related to the TEM FEG probe size) and each pixel colour corresponds to a particular orientation in the ste-reographic triangle (see Fig. 1) (orientation resolution is close to 1°). Typically areas of several square microns can be examined (typical step size from 1 to 10 nm) to obtain orientation and phase maps of all known crystals phases within the examined area). It is also possible to obtain crystalline/amorphous map areas at nm scale [1].
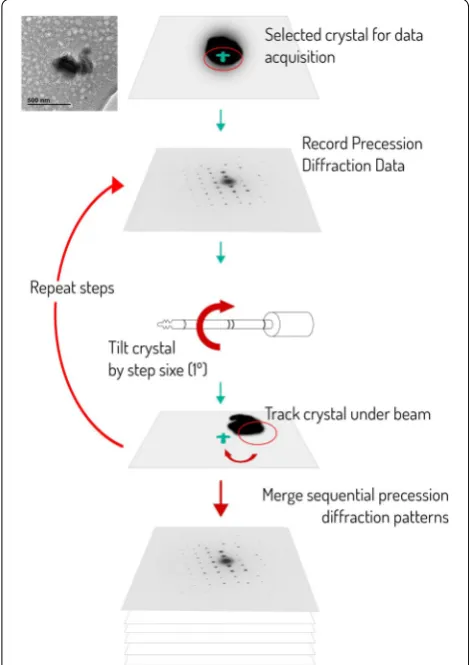
The novel TEM based technique ADT (Automated 3D diffraction tomography) allows to analyze nm sized crys-tal structures using 3D electron diffraction data from
single nanocrystals (Fig. 2); it is based on sampling the
(usually 1° tilt) without any prior information on the structure and orientation of the crystal.
The only essential requirement is that data should be collected from the same crystal, in such a way that large numbers of reflections are typically recorded through a
tilt around an arbitrary axis. As a result, the 3D recipro-cal volume of the selected crystal is reconstructed where diffraction tomography data contains nearly all reflec-tions present in the covered wedge of reciprocal space. In practice recording of 40–60% of the reciprocal space volume is enough for unit cell and symmetry determina-tion and allows crystal structure soludetermina-tion for most of high symmetry systems (cubic, tetragonal, hexagonal) [4]. It is also possible for complete structure determination to combine datasets taken from various crystals of the same crystal phase, using same reflection intensities as scale factor.
The ADT diffraction tomography can be performed in any TEM using a standard single tilt or tomogra-phy holder. An efficient sampling depends on the crys-tal symmetry; the higher the symmetry the smaller the minimum angular range required, however a tilting range
from − 60° to + 60° along the goniometer axis with a
tilt-ing step of 1° is an optimal compromise [4]. Therefore, a total tilt wedge of 120° can be recorded, providing 121 diffraction patterns that are usually enough for unit cell and crystal structure determination.
The precession electron diffraction (PED) is an impor-tant electron crystallography technique that has been developed the last 15 years as a technique suitable to solve crystal structures of various nanomaterials as
ren-ders ED intensities with less dynamical effects [10, 11].
This method is based on the precession of the incident electron beam, which is inclined away from the optical axis of the TEM and precess through a cone surface hav-ing the vertex fixed on the sample.
Due to beam precession, (usually applied at 1° semi-angle) reflection intensities are integrated over dif-fraction conditions that are far from perfect zone axis orientation, therefore dynamical effects in PED patterns are highly reduced. Using PED reflections in combina-tion with ADT-3D tomography is important as symmetry Fig. 1 a Set‑up for orientation imaging/phase mapping in the TEM (ASTAR). b Precession electron diffraction unit interfaced to TEM
related PED reflections are easily revealed and this ena-bles symmetry (Space Group) determination. Therefore, PED intensity comparison between possibly symmetry related ED intensities enables to distinguish between crystals having similar unit cell (e.g. as close as 1–2%) but different crystal symmetries. In addition, during crystal
tilt in ADT (− 60° to + 60°), the use of PED (at 1°
semi-angle) helps to recover more reliable “quasi-kinematical” ED reflections intensities within reciprocal space sections taken every 1° tilt step. On the other hand, orientation imaging ASTAR technique also uses PED reflection in comparison with ED theoretical templates as use of PED improves a lot resulting phase and orientation maps [2].
Results and discussion Green colour tesserae
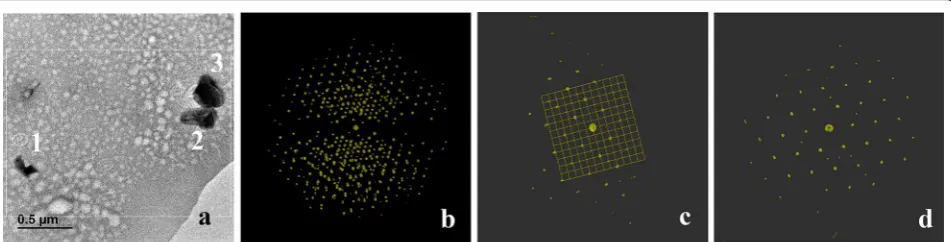
In this work we have analyzed FIB lamella sample from a green coloured glass tesserae. The TEM examination in the FIB lamella reveals the presence of small precipitates (200–400 nm) embedded in an amorphous glass matrix. We examined with ADT tomography two different
crys-tallites in Fig. 3a (1 and 2) by tilting TEM goniometer
(around an arbitrary axis) about 78° every 1° to collect 78 PED (using 1° precession angle) patterns for every crys-tallite and reconstruct reciprocal space (Fig. 3b–d). The symmetry and extinction rules analysis from the best dataset (having lowest R of symmetry related
reflec-tions Rint = 31.1% including 458 reflections) leads to 46
unique independent reflections consistent with cubic cell
with Fd-3m symmetry and cell parameter (a = 10.4 Å,
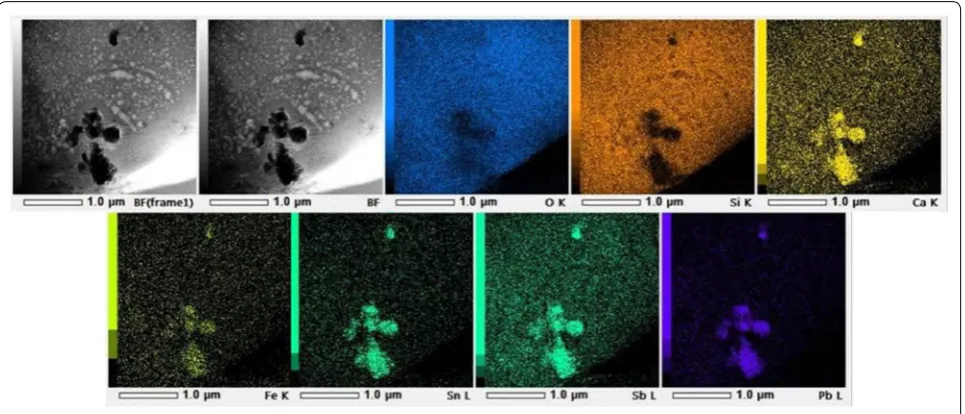
α =β=γ = 90°). The STEM EDS mapping and EPMA
analysis shows that crystallites contain Sb, Pb and O as major elements, but presence of Cu, Fe, Sn and Ca was
also detected (Fig. 4 and Table 1). As the FIB sample
holders are standardly made of Copper, to ensure that Cu is contained in the samples (in addition to EPMA experi-ments) we performed EDS-SEM (scanning electron
microscope) measurements (Additional file 1: Fig. S2a–c)
and Additional file 1: Tables S1, S2) where can be seen
that copper is detected in small quantities (~ 3%) in both glass matrix and in the opacifiers/precipitates.
A detailed search in the COD (Crystallography Open Database) of possible compounds having similar unit cell and cubic symmetry and containing (at least some) of the elements found by STEM-EDS mapping [12], led to the
unique conclusion that the compound having a = 10.53 Å
can only correspond to Pb2Sb2O7 which is known yellow colour opacifier since ancient times [13].
In addition, a more detailed crystallographic struc-ture solution program with Endeavour software using simulated annealing and providing as input 46 ED reflec-tions and average Pb2Sb2O7 chemical formula [14], leads to determination of all Pb, Sb and O atomic positions in
the structure (Fig. 5 and Table 2). Is very important to
note that the conclusion of our structure analysis that the precipitates should have the Pb2Sb2O7 structure is not based only on the combination of unit cell, COD and EPMA data; in fact, is the good fit between ED reflection intensities (46 in case of cubic structure) with the correct structure(s) that reveals that the atomic composition can only correspond to Pb2Sb2O7 structure (independently of any confirmation with accurate EDS data).
The phase mapping analysis with ASTAR (Fig. 6b) on
the green tesserae sample shows clearly amorphous (not diffracting) and some crystalline (diffracting) areas. This is an interesting result as the bright field (BF) image of the TEM is not itself indicative of which areas of the exam-ined area are crystalline or amorphous based uniquely on image contrast (Fig. 6a). The sample surface is extensively covered by micro-pitting pattern a corrosion effect that is associated with sample environmental conditions [15].
We performed also an orientation imaging on the same sample, using ED templates that correspond to the cubic Pb2Sb2O7 structure and comparing those templates with
Fig. 3 a FIB cutted thin slice of green tesserae containing several opacifier crystals (crystals 1 and 2 selected for ADT. b reconstructed 3D diffraction volume of Pb2Sb2O7 opacifier obtained by ADT. c Corresponding reciprocal space of the cubic opacifier unit cell along main a* direction and d
experimental PED patterns obtained by scanning an area
using 5 nm scanning step (Fig. 6). The different
orienta-tions of three opacifier Pb2Sb2O7 crystallites, which
cor-respond to various colours/orientations shown in the stereographic triangle (Fig. 6c) have been revealed.
On the other hand, following a detailed study of the opacifier stoichiometry after a closer look at the EPMA analysis data, the presence of Cu, Fe, Sn and Ca in the crystallites as well in the glass matrix was confirmed (Table 1). Here is interesting to note that EPMA measure-ments acquired on the Roman glass not closing at 100% wt is common in archeological samples specially when acquired on weathered surfaces [16]. The archaeological glass samples have sustained a certain degree of altera-tion during burial resulting in an increase of rugosity, porosity and fractures. Those sample defects increase the overall sample porosity misleading the total amount of bulk sample being probed by the electron beam and thus affecting the quality of the EPMA measurements.
As the Pb2Sb2O7 structure is of pyrochlore type, it can
accommodate other cations (like Fe, Cu) in the main
framework [17, 18]. The cubic Pb2Sb2O7 structure
cor-responds to the bindheimite mineral which has yellow colour, therefore the opacifier colour cannot explain alone the tesserae green colour. “Copper green” colours could be result of yellow lead antimonate particles which also contain Copper and the variability of green tonality is due to the abundance of copper and contribution of bindheimite crystals (yellow lead antimonate) in varying amounts [19].
The EPMA analysis on the green tesserae did show Cu presence in significant quantities (2.7%) in both glass
matrix and particles; this result has been confirmed also by SEM–EDS measurements (Additional file 1: Tables S1, S2) which leads to a possible conclusion that the green tesserae colour is mainly due to the presence of Copper inside the particles and the glass matrix.
White colour tesserae
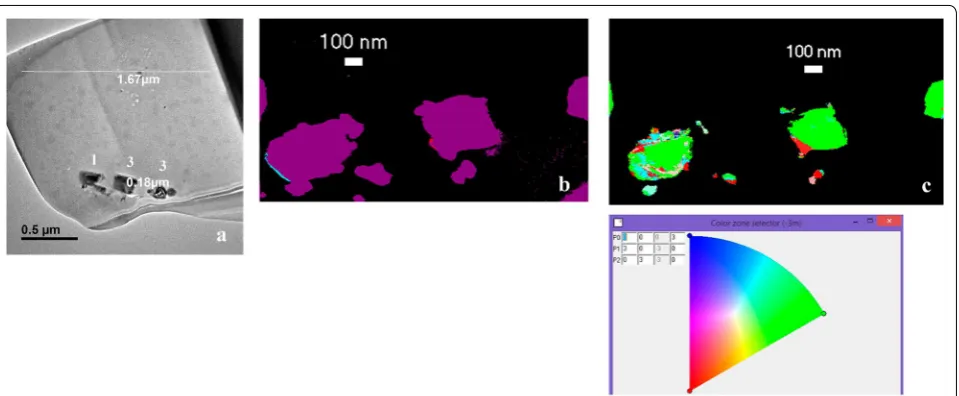
The TEM examination on FIB lamella from the white tesserae sample reveals the presence of 0.5 micron pre-cipitates embedded in an amorphous glass matrix
(Fig. 7). Two different crystallites (crystallites 1 and 3
in Fig. 7a) were studied by ADT-3D analysis by tilting
TEM goniometer about 78° every 1° to collect 78 PED patterns (using 1° precession angle) from every
crystal-lite and reconstruct its reciprocal network (Fig. 7b–d).
The symmetry and extinction rules analysis of two PED dataset intensities from the best data set (having lowest
R of symmetry related reflections Rint = 40.8% including
2585 unmerged reflections and 606 independent reflec-tions) was consistent with P-31m trigonal symmetry and
hexagonal description unit cell parameter (a = b = 5.24 Å,
c = 5.02 Å, α =β= 90°, γ = 120°).
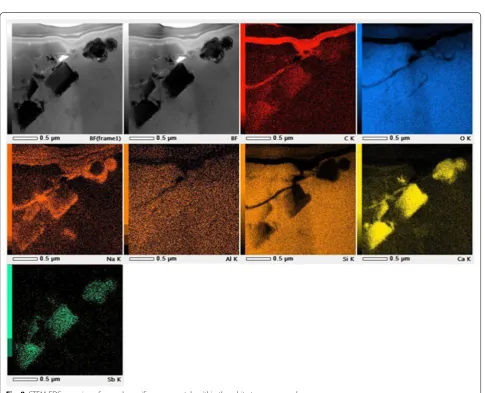
The STEM-EDS mapping and EPMA analysis shows that crystallites contain Sb, Ca and O as major elements,
but also Na, Cu and Al presence was detected (Fig. 8).
Here as previously, as the FIB sample holders are stand-ardly made of Copper, to ensure that Cu is contained in the samples we performed EDS-SEM measurements
(Additional file 1: Fig. S3a–c) and Additional file 1:
Tables S3, S4) where can be seen that Copper is detected in small quantities (0.4–0.9%) in both glass matrix and in the opacifiers/precipitates.
A detailed search in the COD Database of all possible compounds having similar hexagonal unit cell, trigonal symmetry and containing at least some of the elements found by EDS TEM mapping, led to the unique conclu-sion that the compound with hexagonal cell
param-eters (a = b = 5.24 Å, c = 5.02 Å) can only correspond
to CaSb2O6 which is again a known opacifier since the
ancient times [20].
In addition, more detailed crystallographic refinement with simulated annealing having as input 606 ED
reflec-tions and CaSb2O6 as average chemical formula, leads to
the determination of Ca, Sb and O atomic positions in the structure (Fig. 9 and Table 3).
A closer look at the EPMA analysis data (Table 4), con-firms the presence of Al, Sn, K, Na, Mg, Fe and Mn in the
crystallites as well in the glass matrix. As the CaSb2O6
structure is also related to pyrochlore structure, it can accommodate other cations (like Cu, Na) in the main
framework. The CaSb2O6 structure corresponds to the
white colour opacifier and it seems that has strong influ-ence on the white colour of the tesserae.
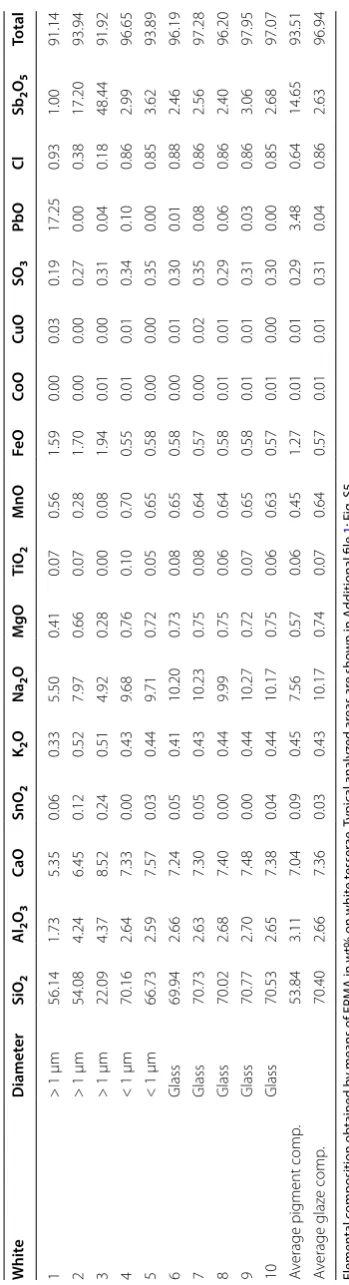
Phase mapping analysis with ASTAR (Fig. 10) on the
white tesserae sample shows clearly amorphous (not dif-fracting) and some crystalline (difdif-fracting) areas. The
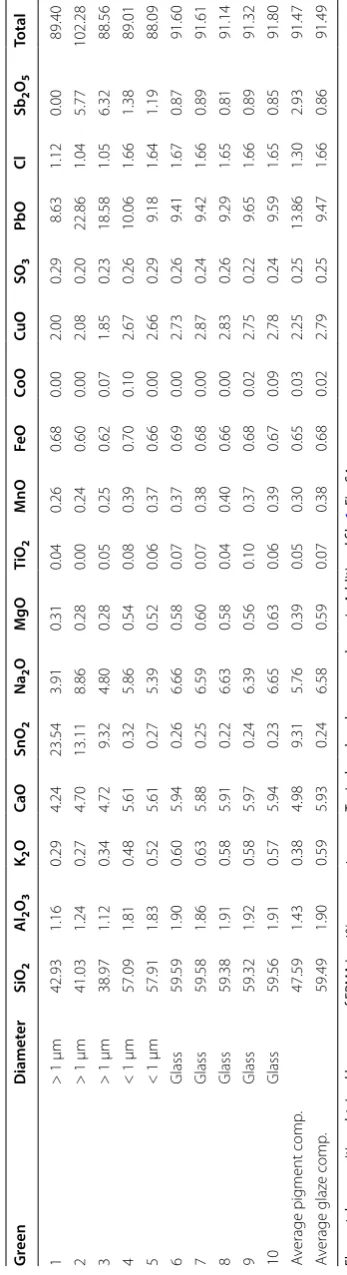
Table 1 EP M A micr oanaly sis da ta p er formed on se ver al ar eas of the gr een t esser ae sample Elemen tal c
omposition obtained b
y means of EP
M
A in wt% on g
reen t esser ae . T ypical analyz ed ar eas ar e sho
wn in A
dditional file 1 : F ig . S4 G reen D iamet er SiO 2 Al2 O3 K2 O Ca O SnO 2 Na2 O MgO Ti O2 M nO Fe O Co O Cu O SO 3 Pb O Cl Sb2 O5 Total 1 > 1 μm 42.93 1.16 0.29 4.24 23.54 3.91 0.31 0.04 0.26 0.68 0.00 2.00 0.29 8.63 1.12 0.00 89.40 2 > 1 μm 41.03 1.24 0.27 4.70 13.11 8.86 0.28 0.00 0.24 0.60 0.00 2.08 0.20 22.86 1.04 5.77 102.28 3 > 1 μm 38.97 1.12 0.34 4.72 9.32 4.80 0.28 0.05 0.25 0.62 0.07 1.85 0.23 18.58 1.05 6.32 88.56 4 < 1 μm 57.09 1.81 0.48 5.61 0.32 5.86 0.54 0.08 0.39 0.70 0.10 2.67 0.26 10.06 1.66 1.38 89.01 5 < 1 μm 57.91 1.83 0.52 5.61 0.27 5.39 0.52 0.06 0.37 0.66 0.00 2.66 0.29 9.18 1.64 1.19 88.09 6 Glass 59.59 1.90 0.60 5.94 0.26 6.66 0.58 0.07 0.37 0.69 0.00 2.73 0.26 9.41 1.67 0.87 91.60 7 Glass 59.58 1.86 0.63 5.88 0.25 6.59 0.60 0.07 0.38 0.68 0.00 2.87 0.24 9.42 1.66 0.89 91.61 8 Glass 59.38 1.91 0.58 5.91 0.22 6.63 0.58 0.04 0.40 0.66 0.00 2.83 0.26 9.29 1.65 0.81 91.14 9 Glass 59.32 1.92 0.58 5.97 0.24 6.39 0.56 0.10 0.37 0.68 0.02 2.75 0.22 9.65 1.66 0.89 91.32 10 Glass 59.56 1.91 0.57 5.94 0.23 6.65 0.63 0.06 0.39 0.67 0.09 2.78 0.24 9.59 1.65 0.85 91.80 A verage pig ment comp . 47.59 1.43 0.38 4.98 9.31 5.76 0.39 0.05 0.30 0.65 0.03 2.25 0.25 13.86 1.30 2.93 91.47 A verage glaz e comp . 59.49 1.90 0.59 5.93 0.24 6.58 0.59 0.07 0.38 0.68 0.02 2.79 0.25 9.47 1.66 0.86 91.49
Fig. 5 Projection of Pb2Sb2O7 cubic pacifier crystal structure solved
with simulated annealing using 46 reflection intensities showing Pb, Sb and O atom positions
Table 2 Atomic positions of Pb2Sb2O7 determined by simulated annealing for green sample
1 Pb Pb1 0.6250 0.6250 0.6250
2 Sb Sb1 0.125 0.125 0.125
3 O O1 0.3133 0.0000 0
orientation imaging on the same sample (generating ED templates having as input cell and atomic positions of hexagonal CaSb2O6 structure and comparing such tem-plates with experimental PED patterns produced by scan-ning this area with 5 nm scanscan-ning step) shows different orientations of three opacifier CaSb2O6 crystallites which correspond to various colours/orientations shown in the stereographic triangle.
Conclusions
The introduction of new TEM based techniques namely 3D precession electron diffraction tomography and ori-entation imaging/phase mapping in the field of cultural heritage materials allows to obtain very precise crystal-lographic data (unit cell parameters and atomic posi-tions) of different phases that may exist in ancient glass and pottery and also distinguish between different phases (amorphous/crystalline) present in the sample. The sam-ple amount used for such TEM analysis is very small (few microns size) so both techniques can be considered as non-destructive.
Is useful to state again that the conclusions of our detailed crystal structure analysis that the precipitates should have the Pb2Sb2O7 (in green colour tesserae) and CaSb2O6 structure (in white colour tesserae) are not based only on the combination of unit cell, COD and EPMA data; in fact, is the good fit between ED reflection
intensities (46 in case of cubic and 606 in case of hexago-nal structure) with the correct structure(s) that reveals that the atomic composition (Figs. 5, 9) can only corre-spond to Pb2Sb2O7 and CaSb2O6 structures respectively (independently of confirmation with accurate EDS data).
As a confirmation of our study, for the green colour tesserae, a density of 9.09 g/cc is calculated following our ED determined crystal structure (number that is very close to Pb2Sb2O7 bindheimite mineral density where the calculated density is 8.988 g/cc). For the white colour tesserae, our ED determined crystal structure leads to a density of 5.278 g/cc, very close to the density of 5.28 g/cc reported for the literature reported compound CaSb2O6.
One need to keep in mind that any of this structure solution gives an average structure, where the “real struc-ture” of the precipitates may be not stoichiometric, where atomic disorder may exist with mixed occupancy or vacancies (pyrochlore type structural shows strong struc-tural disorder). It is possible that Copper or other ele-ments detected in small quantities into the precipitates can occupy some vacancy sites in the structure. Study of such structural disorder in our samples is beyond the scope of our current scientific work.
In our work, we apply for the first time to our knowl-edge in cultural heritage studies combined 3D tomog-raphy and orientation imaging techniques to finely distinguish between different crystal phases based on
electron crystallography. Such analysis can be performed on nm scale and it has strong advantages over conven-tional analytical techniques like e.g. XRF, EDS, Raman,
XRD or EPMA which they lack spatial resolution (micron instead of nm probe size) over the analyzed volume area. The ADT technique can be superior to most actual Fig. 7 a FIB cutted thin slice of white tesserae containing several opacifier crystals selected for ADT diffraction tomography. b Reconstructed 3D diffraction volume of CaSb2O6 opacifier obtained by ADT. c Corresponding reciprocal space projection of the hexagonal unit cell opacifier along main c* (left) and 110 direction (right)
Synchrotron sources where the examined crystal size is usually 1–5 micron size; in contrast, crystals as small as 20 nm can be studied and solve their structure with TEM based diffraction tomography. In this work using ADT we achieved to distinguish precisely opacifier crystal struc-ture in ancient Roman glass; such precision in atomic structure solution/identification can be very important in order to obtain information about the range of tempera-tures used to produce opaque glass.
For instance, it has been reported that during
synthe-sis of pure Ca antimonate crystals, CaSb2O6 is formed at
higher temperature instead of Ca2Sb2O7 [21]. CaSb2O6
crystallizes from 927 °C at the expense of Ca2Sb2O7 and
becomes the major phase from 1094 °C [17]. As a future analytical work, it will be interesting to combine such crystallographic information with SIMS at nm resolution to elucidate the possibility of a two stages process that characterize recycled Roman glass with the help of iso-topic data [22, 23].
Another interesting aspect in our study is the confirma-tion (by both STEM -EDS, and EPMA) of the presence of minor quantity elements (like Cu, Fe, Sn) in the opacifier crystal framework. We have observed similar behavior in an independent study of yellow and blue Roman tesserae [8]. As opacifier structures are related to pyrochlores, ion substitution in pyrochlores through ionic exchanges is well known fact in solid state chemistry and is also used
in modern materials applications [24, 25]. It has also
Fig. 9 Hexagonal crystal structure projection of CaSb2O6 opacifier
obtained with simulated annealing using 606 reflections intensities and showing Ca, Sb and oxygen atomic positions
Table 3 Atomic positions of CaSb2O6 determined
by simulated annealing for white sample
1 Ca Ca1 0.00000 0.00000 0.00000
2 Sb Sb1 0.33333 0.66667 0.50000
3 O O1 0.36800 0.0000 0.2951
1 Ca Ca1 0.00000 0.00000 0.00000
Table 4 EP M A micr oanaly sis da ta p er formed on se ver al ar eas of the whit e t esser ae sample Elemen tal c
omposition obtained b
y means of EP
M
A in wt% on whit
e t esser ae . T ypical analyz ed ar eas ar e sho
wn in A
been reported incorporation of ternary cations (like Sn
and Zn) into Pb2Sb2O7 cubic pigment pyrochlore
struc-ture in Naples Yellow Renaissance majolica, studied with advanced Synchrotron X-Ray absorption (XANES) tech-niques [18].
One important point of our work is that it contrib-utes to the understanding of the complex colour chem-istry of tesserae. Their crystal colour may or may not be influenced by the opacifier presence, which colour in turn may be influenced by the presence of cations introduced through ionic exchanges in the host struc-ture at firing temperastruc-tures and the cations presence within the glass matrix. For instance we determined with ADT tomography in green and yellow colour tesserae that both contain cubic structure (Fd-3m
sym-metry) Pb2Sb2O7 yellow colour opacifier [8]. However
the resultant tesserae colours are different as both opacifiers contain different amount of Cu inside the crystal framework and the glass matrix (2% into the green sample vs 0.01% into the yellow sample).
The same behaviour has been observed with deep blue and white tesserae where our previous study with ADT tomography has shown the presence of same type
of CaSb2O6 P-31m trigonal white colour opacifier [8].
The observed deep blue and white tesserae colours can be explained as consequence of the presence of trace amounts of Co in the glass matrix (about 0.3–0.6% for deep blue sample up to not detectable quantity in the white sample).
On the other hand, orientation and phase map-ping techniques that have also been applied in cultural heritage ceramics show in clear way amorphous and
crystalline areas which otherwise are not possible to recognize with TEM image contrast [26]. Again iden-tification of nanoparticle’s orientation/phase relation-ships in relation with crystalline/amorphous matrix may shed light in properties of complex ceramics where colour may also depend on nanoparticle size. On the other hand, Synchrotron based techniques have been an option to study complex and heterogeneous samples and it has been proved that micro focused X-rays beams from synchrotron beamlines provided the capabilities to study the chemistry and structure of ancient metals, paintings and ceramics. However, there is mounting evi-dence that the complexity of ancient materials require higher spatial resolution to pin down the scientific chal-lenges resulting from the study of ancient materials.
In the present paper by combining the ASTAR and ATD techniques we reveal that TEM provides the chemi-cal and structural information at nanoschemi-cale required to study ancient materials, otherwise difficult to obtain by means of synchrotron radiation based techniques. The 3D electron tomography and orientation imaging tech-nique can be used with any TEM (100–300 kV) having
sufficient angular tilt (+ − 45° minimum), precession
electron diffraction hardware, and 3D electron diffrac-tion tomography software.
Additional file
Additional file 1. Additional figures and tables.
Authors’ contributions
PPD and EFR were involved with crystal structure and orientation imag‑ ing analysis, NZ collected the samples and revised the manuscript, PJB, FK, JP, MK, IM were involved with data collection with different TEM microscopes, PPD and both AG were involved with ADT data treatment, RA and JRR were involved with FIB preparation and EPMA analysis. The manuscript was written by SN who also supervised the study and helped in data analysis interpreta‑ tion (TEM, EDS, ASTAR and crystallography). Manuscript was edited by SN and PPD. All authors read and approved the final manuscript.
Author details
1 NanoMEGAS SPRL, Blvd Edmond Machtens 79, 1080 Brussels, Belgium. 2 Elec‑ tron Crystallography Solutions, Calle Orense 8, 28020 Madrid, Spain. 3 Instituto Tecnologia Quimica (UPV‑CSIC), Universitat Politècnica de València/CSIC, Av. de los Naranjos s/n, 46022 Valencia, Spain. 4 Section of Genetics, Department of Biology, University of Patras, 26500 Patras, Greece. 5 Department of History, Archaeology and Cultural Resources Management, University of the Pelo‑ ponnese, 24100 Kalamata, Greece. 6 SIMaP, Grenoble INP‑CNRS‑UJF, BP 46, 38402 Saint‑Martin‑d’Hères Cedex, France. 7 Lab de Microscopias Avanzadas, INA, University de Zaragoza, 50018 Zaragoza, Spain. 8 ARAID Foundation, 50018 Zaragoza, Spain. 9 CCiT, University of Barcelona, Lluís Solé i Sabaris 1‑3, 08028 Barcelona, Spain. 10 Department of Mineralogy, Petrology and Applied Geology, University of Barcelona, Marti i Franquès s/n, 08028 Barcelona, Spain. 11 Laboratory of Electron Microscopy and Microanalysis, School of Natural Sci‑ ences, University of Patras, 26504 Patras, Greece. 12 Present Address: Deutsches Elektronen‑Synchrotron DESY, Notkestraße 85, 22607 Hamburg, Germany.
Acknowledgements
PJB thank the Electron Microscopy Service of the Universitat Politècnica de València for access of TEM equipment. FK, IM and MK thank the interde‑ partmental Laboratory of Electron Microscopy and Microanalysis (L.E.M.M.) of University of Patras, Greece for access to TEM equipment. NZ grateful to the Director of the Society for the Messenian Archaeological studies, Prof. P. Themelis, for permitting the analyses of the material presented. RA grate‑ fully acknowledges the support from the Spanish Ministerio de Economia y Competitividad (MAT2016‑79776‑P), from the Government of Aragon and the European Social Fund under the project “Construyendo Europa desde Aragon” 2014–2020 (Grant Number E/26).
Competing interests
The authors declare that they have no competing interests.
Availability of data and materials
Available upon request by the authors.
Funding
PJB also thanks the Spanish government for economic funding (Severo Ochoa SEV‑2012‑0267). FK and IM acknowledges part of the research presented in this article has been co‑financed by the European Union (European Social Fund) and the Greek State under the “ARISTEIA II” Action of the “OPERATIONAL PROGRAMME EDUCATION AND LIFELONG LEARNING”. NZ acknowledges travel support during the laboratory work from the Cultural Heritage Materials and Technologies MSc Program of the University of the Peloponnese (KA‑ELKE293).
Publisher’s Note
Springer Nature remains neutral with regard to jurisdictional claims in pub‑ lished maps and institutional affiliations.
Received: 4 May 2018 Accepted: 26 October 2018
References
1. Portillo J, Rauch EF, Nicolopoulos S, Gemmi M, Bultreys D. Precession elec‑ tron diffraction assisted orientation mapping in the transmission electron microscope. Mater Sci Forum. 2010;64:1–7.
2. Rauch EF, Véron M. Automated crystal orientation and phase mapping in TEM. Mater Charact. 2014;98:1–9.
3. Kolb U, Gorelik T, Kübel C, Otten MT, Hubert D. Towards automated diffraction tomography: part I‑data acquisition. Ultramicroscopy. 2007;107:507–13.
4. Kolb U, Gorelik T, Mugnaioli E. Automated diffraction tomography combined with electron precession: a new tool for ab initio nanostruc‑ ture analysis. In: Mater. Res. Soc. Symp. Proc. vol. 1184. Materials Research Society; 2009. p. GG01–05.
5. Baraldi A, Buffagni E, Capelletti R, Mazzera M, Fasoli M, Lauria A, Moretti F, Vedda A, Gemmi M. Eu incorporation into sol–gel silica for photonic applications: spectroscopic and TEM evidences of α‑quartz and Eu pyro‑ silicate nanocrystal growth. J Phys Chem C. 2013;117:26831–48. 6. Nicolopoulos S, Das P, Mugnaioli E, Zacharias N, Gemmi M. Where
crystallography meets archaeology: analysis of blue color of ancient Greek amphorisk with TEM electron 3D diffraction tomography. In: Book of Abstracts of VIII Congreso Nacional de Cristalografía, Mérida, México. 2016.
7. Papageorgiou M, Zacharias N, Beltsios KG, Analytical and typological investigation of late roman mosaic tesserae from Ancient Messene, Greece. In: Ignatiadou D, Antonaras A, editors. Proceedings of the ΑΙHV18, Thessaloniki. 2012. p. 241–8.
8. Zacharias N, Karavassili F, Das P, Nicolopoulos S, Oikonomou A, Galanis A, Rauch E, Arenal R, Portillo J, Roque J, Casablanca J, Margiolaki I. A novelty for cultural heritage material analysis: transmission electron microscope (TEM) 3D electron diffraction tomography applied to roman glass tesserae. Microchem J. 2018;138:19–25.
9. NanoMEGAS SPRL, Brussels, Belgium. http://www.nanom egas.com. 10. Vincent R, Midgley PA. Double conical beam‑rocking system for measure‑
ment of integrated electron diffraction intensities. Ultramicroscopy. 1994;53:271–82.
11. Nicolopoulos S, Weirich TE. ELCRYST 2005 proceedings of the electron crystallography school 2005: new frontiers in electron crystallography. Ultramicroscopy. 2007;107:431–558.
12. Grazulis S, Chateigner D, Downs RT, Yokochi AT, Quiros M, Lutterotti L, Manakova E, Butkus J, Moeck P, Le Bail A. Crystallography open data‑ base—an open‑access collection of crystal structures. J Appl Crystallogr. 2009;42:726–9.
13. Oppenheim AL, Brill RH, Barag D, vanSaldern A. Glass and glass making in ancient Mesopotamia. New York: The Corning Museum of Glass; 1970. p. 105–30.
14. Putz H, Schön JC, Jansen M. Combined method for ab initio structure solution from powder diffraction data. J Appl Crystallogr. 1999;32:864–70. 15. Zacharias N, Palamara E. Chapter 12: glass corrosion issues and
approaches for archaeological science in recent advances in the scientific research on ancient glass. In: Gan F, Li Q, Henderson J, editors. World Scientific. 2016; p. 233–48.
16. Roque J, Molera J, Perez‑Arantegui J, Calabuig C, Portillo J, Vendrell‑Saz M. Xiques workshop in Paterna (Spain), 13th century AD: nanostruc‑ ture, chemical composition and annealing conditions. Archaeometry. 2007;49:511–28.
17. Butler KH, Bergin MJ, Hannaford VMB. Calcium antimonates. J Electro‑ chem Soc. 1950;97:117–22.
18. Cartechni L, Rosi F, Miliani C, D’Acapito F, Brunetti BG, Sgamellotti A. Modified Naples yellow in Renaissance majolica: study of Pb–Sb–Zn and Pb–Sb–Fe ternary pyroantimonates by X‑ray absorption spectroscopy. J Anal At Spectrom. 2011;26:2500–7.
19. Van der Werf I, Mangone A, Giannossa LC, Traini A, Laviano R, Coralini A, Sabbatini L. Archaeometric investigation of roman tesserae from Hercula‑ neum (Italy) by the combined use of complementary micro‑destructive analytical techniques. J Archaeol Sci. 2009;36:2625–34.
20. Shortland AJ. The use and origin of antimonate colorants in early Egyp‑ tian glass. Archaeometry. 2002;44:517–30.
22. Duckworth C, Henderson J, Rutten FJM, Nikita K. Opacifiers in late bronze age glasses: the use of TOF‑SIMS to identify raw ingredients and produc‑ tion techniques. J Archaeol Sci. 2012;39:2143–52.
23. Duckworth CN. The created stone: chemical and archaeological perspec‑ tives on the colour and material properties of early Egyptian glass, 1500–1200 B.C. PhD thesis. University of Nottingham. 2011.
24. Subramanian MA, Aravamudan G, SubbaRao GV. Oxide pyrochlores—a review. Prog Solid State Chem. 1983;15:55–143.
25. Sidey VI, Shteyfan AY. Predicting the structures of the ideal ternary oxide pyrochlores: the bond valence model and distance least squares. J Alloys Compd. 2015;660:433–6.