A
A
S
S
T
T
A
A
T
T
I
I
S
S
T
T
I
I
C
C
A
A
L
L
S
S
U
U
R
R
V
V
E
E
Y
Y
U
U
P
P
O
O
N
N
T
T
H
H
E
E
E
E
V
V
O
O
L
L
U
U
T
T
I
I
O
O
N
N
O
O
F
F
T
T
H
H
E
E
S
S
T
T
U
U
D
D
E
E
N
N
T
T
S
S
’
’
S
S
A
A
T
T
I
I
S
S
F
F
A
A
C
C
T
T
I
I
O
O
N
N
R
R
E
E
G
G
A
A
R
R
D
D
I
I
N
N
G
G
T
T
H
H
E
E
E
E
D
D
U
U
C
C
A
A
T
T
I
I
O
O
N
N
A
A
L
L
P
P
R
R
O
O
C
C
E
E
S
S
S
S
T
Ti
i
be
b
e
ri
r
i
u-
u
-
Ma
M
ar
ri
i
us
u
s
K
Ka
ar
r
ny
n
ya
an
ns
s
zk
z
k
y,
y
,
C
Co
or
ri
i
na
n
a
M
Mu
uş
ş
ur
u
r
oi
o
i
“Tibiscus” University of Timişoara, Romania
Corresponding author: Tiberiu-Marius Karnyanszky, [email protected]
ABSTRACT: This papers bases on the specifications of the Romanian Agency for Quality Insurance in Higher Education (ARACIS) regarding the assessment of the B.Sc. programs. Some of our prior works are also presented in order to substantiate our solution, focusing on the automation of the statistical calculus.
The paper presents an expert system implemented at the “Tibiscus” University of Timisoara, Romania, used for at least five years to analyze the quality assessment of the educational process, compulsory made by the students at our university using an online web-based application. The results of the analysis and of the statistical processing are used on departments, assuring a transparent policy of the educational high education evaluation. Our application allow the evaluation, the interpretation, the study of the evolution and the history of the results of evaluation, using statistical indicators as the average, the mean squared deviations, the class values, the correlations and others. A widely implementation of our solution permits to have the same evaluation system in all universities and, by consequence, a unitary insight to the higher education level.
KEYWORDS: quality assessment, high education, statistical processing, means, deviation, correlations.
1. INTRODUCTION
The periodical assessment of the students satisfaction regarding the educational process we are presenting bases on the stipulations of the ARACIS previously presented in [***06, K+07, KLA12], implemented and updated based on some recent researches as [Fur12, PPV10, P+10, Sko10]. Our university implemented a compulsory method of students’ evaluation, based on two separate questionnaires implemented as web applications :
one for the evaluation of the teaching staff (more results were presented in [CK07, K+10]);
one for the evaluation of the educationa l process (more results were presented in [KLA12]).
Both results are processed by the Department of Evaluation and Quality Assurance (D-Q) then discussed on departments and university, in order to adopt the best solutions to improve the results of the educational process. Also, these results are openly
presented on the university web site, accessible to the public (students, parents, candidates, stakeholders, state authorities [AGP12]).
The web applications we proposed for the evaluation allows:
for students: to evaluate the educational process;
for the D-Q: to validate the evaluations and to interpret the results of the statistical processing of the results, using different criteria;
for the heads of the department / university: to obtain a feed-back from the students and to apply adequate measures to increase the quality of the educational process.
We’re concentrating now on the assessment of the educational process, which is based on a questionnaire containing 15 questions :
Q.1: Student-centered learning methods Q.2: Practical application of the knowledge Q.3: Possibility of course selection
Q.4: Audio-video and computers Q.5: Student services
Q.6: Availability of learning resources Q.7: Library access
Q.8: Career guidance to students Q.9: Partnerships with other universities Q.10: Quality of teaching
Q.11: Availability of staff Q.12: Furniture
Q.13: Recreational spaces Q.14: Educational spaces
Q.15: Structure of the study program namely regarding:
the endowment (4 items – Q.4, Q.12, Q.13, Q.14);
the contents of study (3 items – Q.2, Q.3, Q.15);
the learning outcomes (2 items – Q.1, Q.8);
the accessibility of learning resources (6 items – Q.5, Q.6, Q.7, Q.9, Q.10, Q.11).
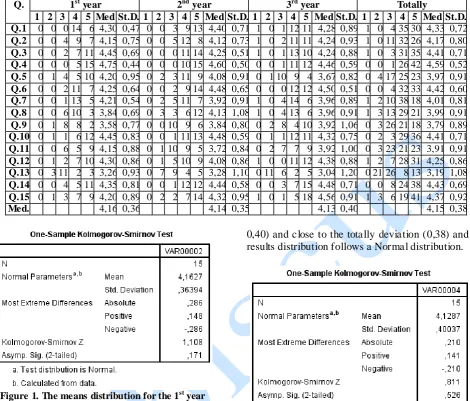
Table 1. The answers’ aggregate for the 2011/2012 academic year
Q. 1st year 2nd year 3rd year Totally
1 2 3 4 5 Med St.D. 1 2 3 4 5 Med St.D. 1 2 3 4 5 Med St.D. 1 2 3 4 5 Med St.D. Q.1 0 0 0 14 6 4,30 0,47 0 0 3 9 13 4,40 0,71 1 0 1 12 11 4,28 0,89 1 0 4 35 30 4,33 0,72 Q.2 0 0 4 9 7 4,15 0,75 0 0 5 12 8 4,12 0,73 1 0 2 11 11 4,24 0,93 1 0 11 32 26 4,17 0,80 Q.3 0 0 2 7 11 4,45 0,69 0 0 0 11 14 4,25 0,51 1 0 1 13 10 4,24 0,88 1 0 3 31 35 4,41 0,71 Q.4 0 0 0 5 15 4,75 0,44 0 0 0 10 15 4,60 0,50 0 0 1 11 12 4,46 0,59 0 0 1 26 42 4,59 0,52 Q.5 0 1 4 5 10 4,20 0,95 0 2 3 11 9 4,08 0,91 0 1 10 9 4 3,67 0,82 0 4 17 25 23 3,97 0,91 Q.6 0 0 2 11 7 4,25 0,64 0 0 2 9 14 4,48 0,65 0 0 0 12 12 4,50 0,51 0 0 4 32 33 4,42 0,60 Q.7 0 0 1 13 5 4,21 0,54 0 2 5 11 7 3,92 0,91 1 0 4 14 6 3,96 0,89 1 2 10 38 18 4,01 0,81 Q.8 0 0 6 10 3 3,84 0,69 0 3 3 6 12 4,13 1,08 1 0 4 13 6 3,96 0,91 1 3 13 29 21 3,99 0,91 Q.9 0 1 8 8 2 3,58 0,77 0 0 10 9 6 3,84 0,80 0 2 8 4 10 3,92 1,06 0 3 26 21 18 3,79 0,89 Q.10 0 1 1 6 12 4,45 0,83 0 0 1 11 13 4,48 0,59 0 1 1 12 11 4,32 0,75 0 2 3 29 36 4,41 0,71 Q.11 0 0 6 5 9 4,15 0,88 0 1 10 9 5 3,72 0,84 0 2 7 7 9 3,92 1,00 0 3 23 21 23 3,91 0,91 Q.12 0 1 2 7 10 4,30 0,86 0 1 5 10 9 4,08 0,86 1 0 0 11 12 4,38 0,88 1 2 7 28 31 4,25 0,86 Q.13 0 3 11 2 3 3,26 0,93 0 7 9 4 5 3,28 1,10 0 11 6 2 5 3,04 1,20 0 21 26 8 13 3,19 1,08 Q.14 0 0 4 5 11 4,35 0,81 0 0 1 12 12 4,44 0,58 0 0 3 7 15 4,48 0,71 0 0 8 24 38 4,43 0,69 Q.15 0 1 3 7 9 4,20 0,89 0 2 2 7 14 4,32 0,95 1 0 1 5 18 4,56 0,91 1 3 6 19 41 4,37 0,92
Med. 4,16 0,36 4,14 0,35 4,13 0,40 4,15 0,38
Figure 1. The means distribution for the 1st year
Figure 2. The means distribution for the 2nd year
A statistical processing of these results shows that all three years means (4,16; 4,14; 4.13) are very close to the totally mean (of all study years, 4,15), that the standard deviations are low (0,36; 0,35;
0,40) and close to the totally deviation (0,38) and all results distribution follows a Normal distribution.
Figure 3. The means distribution for the 3rd year
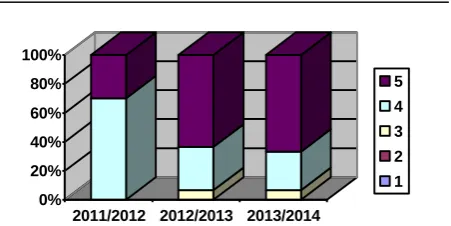
Regarding the evolution of the results, the means of the 2011/2012, 2012/20113 and 2013/2014 evaluations are depicted in the figures 4, 5, and 6 respectively.
For the 2011/2012 year, as presented in figure 4, there are no “1” (=insufficient) answers and the “2” (=sufficient) and “3” (=medium) answer are rarely present. The “4” (=good) and “5” (=very good) answers predominate, being approximately equal. The same results can be observed for the 2012/2013 and the 2013/2014 year.
0% 20% 40% 60% 80% 100%
Q.1 Q.2 Q.3 Q.4 Q.5 Q.6 Q.7 Q.8 Q.9 Q.10 !.11 Q.12 Q.13 Q.14 Q.15
5 4 3 2 1
Figure 4. The means distribution for the 2011/2012 year
0% 20% 40% 60% 80% 100%
Q.1 Q.2 Q.3 Q.4 Q.5 Q.6 Q.7 Q.8 Q.9 Q.10 !.11 Q.12 Q.13 Q.14 Q.15
5 4 3 2 1
Figure 5. The means distribution for the 2012/2013 year
0% 20% 40% 60% 80% 100%
Q.1 Q.2 Q.3 Q.4 Q.5 Q.6 Q.7 Q.8 Q.9 Q.10 !.11 Q.12 Q.13 Q.14 Q.15
5 4 3 2 1
Figure 6. The means distribution for the 2013/2014 year
Table 2. The evolution of the answers between 2011 and 2014 Q. 1st year 2011/2012 2nd year 2012/2013 3rd year 2013/2014
same students, according to their promotion from the 1st year (2011/2012) to the 2nd then 3rd year (2013/2014). The totally means are e volving from 4,16 (=very good) to 4,25 respectively 4,45, so we can appreciate this route as a clear improvement of the students’ satisfaction.
At the Q.1: Student-centered learning methods, the means evolution shows an increase of the “very good” answers (figure 7).
At the Q.2: Practical application of the knowledge, the means evolution shows an increase of the “very good” answers (figure 8).
At the Q.3: Possibility of course selection, the means evolution shows a sinuous evolution of the “very good” answers (figure 9).
At the Q.4: Audio-video and computers, the means evolution shows a sinuous evolution of the “very good” answers (figure 10).
At the Q.5: Student services, the means evolution shows a sinuous evolution of the “very good” answers (figure 11).
At the Q.6: Availability of learning resources, the means evolution shows an increase of the “very good” answers (figure 12).
At the Q.7: Library access, the means evolution shows an increase of the “very good” answers (figure 13).
At the Q.8: Career guidance to students, the means evolution shows an increase of the “very good” answers (figure 14).
At the Q.9: Partnerships with other universities, the means evolution shows an increase of the “very good” answers (figure 15).
At the Q.10: Quality of teaching, the means evolution shows a relative stability of the “very good” answers (figure 16).
At the Q.11: Availability of staff, the means evolution shows a sinuous evolution of the “very good” answers (figure 17).
At the Q.12: Furniture, the means evolution s hows a sinuous evolution of the “very good” answers (figure 18).
At the Q.13: Recreational spaces, the means evolution shows an increase of the “very good” answers (figure 19).
At the Q.14: Educational spaces, the means evolution shows a relative stability of the “very good” answers (figure 20).
At the Q.15: Structure of the study program, the means evolution shows a sinuous evolution of the “very good” answers (figure 21).
0% 20% 40% 60% 80% 100%
2011/2012 2012/2013 2013/2014
5 4 3 2 1
Figure 7. Evolution of the Q.1 answers during a cycle of study
0% 20% 40% 60% 80% 100%
2011/2012 2012/2013 2013/2014
5 4 3 2 1
Figure 8. Evolution of the Q.2 answers during a cycle of study
0% 20% 40% 60% 80% 100%
2011/2012 2012/2013 2013/2014
5 4 3 2 1
Figure 9. Evolution of the Q.3 answers during a cycle of study
0% 20% 40% 60% 80% 100%
2011/2012 2012/2013 2013/2014
5 4 3 2 1
Figure 10. Evolution of the Q.4 answers during a cycle of study
0% 20% 40% 60% 80% 100%
2011/2012 2012/2013 2013/2014
5 4 3 2 1
0% 20% 40% 60% 80% 100%
2011/2012 2012/2013 2013/2014
5 4 3 2 1
Figure 12. Evolution of the Q.6 answers during a cycle of study
0% 20% 40% 60% 80% 100%
2011/2012 2012/2013 2013/2014
5 4 3 2 1
Figure 13. Evolution of the Q.7 answers during a cycle of study
0% 20% 40% 60% 80% 100%
2011/2012 2012/2013 2013/2014
5 4 3 2 1
Figure 14. Evolution of the Q.8 answers during a cycle of study
0% 20% 40% 60% 80% 100%
2011/2012 2012/2013 2013/2014
5 4 3 2 1
Figure 15. Evolution of the Q.9 answers during a cycle of study
0% 20% 40% 60% 80% 100%
2011/2012 2012/2013 2013/2014
5 4 3 2 1
Figure 16. Evolution of the Q.10 answers during a cycle of study
0% 20% 40% 60% 80% 100%
2011/2012 2012/2013 2013/2014
5 4 3 2 1
Figure 17. Evolution of the Q.11 answers during a cycle of study
0% 20% 40% 60% 80% 100%
2011/2012 2012/2013 2013/2014
5 4 3 2 1
Figure 18. Evolution of the Q.12 answers during a cycle of study
0% 20% 40% 60% 80% 100%
2011/2012 2012/2013 2013/2014
5 4 3 2 1
Figure 19. Evolution of the Q.13 answers during a cycle of study
0% 20% 40% 60% 80% 100%
2011/2012 2012/2013 2013/2014
5 4 3 2 1
Figure 20. Evolution of the Q.14 answers during a cycle of study
0% 20% 40% 60% 80% 100%
2011/2012 2012/2013 2013/2014
5 4 3 2 1
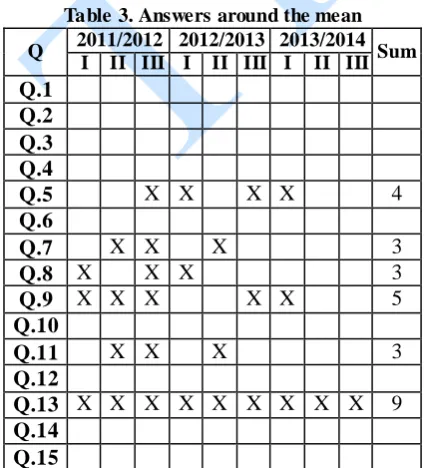
value of the whole period (result: the standard deviation is minim) as presented in the table 3, and some answers are surpassing the mean (table 4). As presented in table 4, the Q.3: Possibility of course selection answers (with 9 surpassing) shows that students are content about the possibility to select the optional courses according to their personal interest.
As seen in table 4, at the Q.4: Audio-video and computers all answers are surpassing the mean so we can conclude that students appreciate the efforts of the university for the continuous development of the teaching means.
Also, at the Q.6: Availability of learning resources, the results indicates that the educational resources available in the university library or in e-format are sufficient for a good education.
The 9 surpassing results at the Q.14: Educational spaces demonstrate a good disposal of the classrooms and laboratories.
Finally, the Q.15: Structure of the study program answers indicates a good understanding and appreciation upon the curricula and upon the disciplines’ content.
Opposite, the lack of surpassing of the Q.13: Recreational spaces answers are a sign for the university management to implement a plan to build (maybe rent) some spaces for the extracurricular time of the students, which is also a time for the fair future development of the students.
Intriguing for us is the result of the Q.9: Partnerships with other universities, because the university developed a lot of international Erasmus programs with outside institutions (from France, Germany, Spain etc.), maybe this result may be interpreted as a lack of communications between the local promoters and students.
Table 3. Answers around the mean
Q 2011/2012 2012/2013 2013/2014 Sum I II III I II III I II III
Q.1 Q.2 Q.3 Q.4
Q.5 X X X X 4
Q.6
Q.7 X X X 3
Q.8 X X X 3
Q.9 X X X X X 5
Q.10
Q.11 X X X 3
Q.12
Q.13 X X X X X X X X X 9
Q.14 Q.15
Q 2011/2012 2012/2013 2013/2014 Sum I II III I II III I II III
Q.1 X X X X X X X 7
Q.2 X X X X X X X 7
Q.3 X X X X X X X X X 9
Q.4 X X X X X X X X X 9
Q.5 X 1
Q.6 X X X X X X X X X 9
Q.7 X X X 3
Q.8 X 1
Q.9
Q.10 X X X X X X X X 8
Q.11 X X 2
Q.12 X X X X X X 6
Q.13
Q.14 X X X X X X X X X 9
Q.15 X X X X X X X X X 9
CONCLUSIONS
Our paper presented a survey upon the evolution of the students’ satisfaction upon the educational process, using a computer aided management system we developed at the “Tibiscus” University of Timişoara.
As presented above, we can conclude (from table 1) that students expectations are fulfilled: more than ¾ of the students are satisfied/very satisfied on the offered conditions:
1st year 2011/2012: 78% of the answers are “good” and “very good”;
2nd year 2011/2012: 79% of the answers are “good” and “very good”;
3rd year 2011/2012: 80% of the answers are “good” and “very good”.
Also, the students’ expectations improve continuously during their academic route (from table 2):
1st year 2011/2012: 78% of the answers are “good” and “very good”;
2nd year 2012/2013: 82% of the answers are “good” and “very good”;
3rd year 2013/2014: 89% of the answers are “good” and “very good”.
Finally, as seen, the differences between the studying years are low; we can conclude that the results are harmonious and reflect a median trend of the students’ opinion.
REFERENCES
[AGP12] A. Apostolou, E. Grigoro udis, Y.
Politis - Quality Assessment in Higher
Education Based on a
Multi-Stakeholder Evaluation Process, E” Era & Higher Education, Proceedings of the 7th International Conference Quality Management in Higher Education, Austrian Computer Society, Viena, 2012, ISBN: 978-3-85403-291-5, pp. 161-168.
[CK07] O. Crista, T. M. Karnyanszky - Application for Evaluation of the Professional Competencies of the
Teaching Staff, Anale. Seria
Informatica , vol. V, pp. 71-76, 2007.
[Fur12] R. Füreder - Quality Assurance through Internal Program Evaluation, E” Era & Higher Education, Proceedings of the 7th International Conference Quality Management in Higher Education, Austrian Computer Society, Viena, 2012, ISBN: 978-3-85403-291-5, pp. 273-280.
[KLA12] T. M. Karnyanszky, L. D. Lacrămă,
S. A. Apostol - Co mputer Aided
Assessment of Students’ Satisfaction Regarding the Educational Process, E” Era & Higher Education, Proceedings of the 7th International Conference Quality Management in Higher Education, Austrian Computer Society, Viena, 2012, ISBN: 978-3-85403-291-5, pp. 39-48.
[K+07] T. M. Karnyanszky, L. D. Lacrămă,
L. Luca, I. Iacob - Teacher’s
Evaluation - a Component of Quality
Assessment System, Anale. Seria
Informatica , vol. VI, pp. 107-112, 2007.
[K+10] T. Karnyanszky, A. Fortiş, O. Crista,
D. Lacrămă - Co mputer Aided
Management of the Teaching Staff Assessment, Proceedings of the 6th International Seminar on Quality Management in Higher Education, Book 1, pp. 87-90, 2010.
[PPV10] A. Purcarea, I. Purcarea, S. Visan – The Analysis of the Quality Assurance System at the Faculty of Commerce within Bucharest Academy of Economic Studies, in the View of the Quality
Culture, Proceedings of the 6th
International Seminar on Quality Management in Higher Education, Book 1, pp. 303-306, 2010.
[P+10] S.F. Popescu, C. Stroe , E. Militaru, D.
Radu – Assessment of the Quality of
Educational Services in Higher
Education through the Survey of Students’ Perceptions, Proceedings of the 6th International Seminar on Quality Management in Higher Education, Book 2, pp. 211-214, 2010.
[Sko10] M. M. Skok – Values of Teachers and
Students and Quality of Higher
Education, Proceedings of the 6th International Seminar on Quality Management in Higher Education, Book 1, pp. 339-342, 2010.
[TKS08] C. Ţuican, T. M. Karnyanszky, B.
Şelariu - Expert System for Quality
Assessment in „Tibiscus” University, Anale. Seria Informatica , vol. VI, pp. 239-248, 2008.
[***06] Agenţia Română de Evaluarea
Calităţii în Învăţământul Superior –
Metodologia de evaluare externă,