D
D
E
E
V
V
E
E
L
L
O
O
P
P
I
I
N
N
G
G
F
F
E
E
A
A
T
T
U
U
R
R
E
E
R
R
E
E
P
P
R
R
E
E
S
S
E
E
N
N
T
T
A
A
T
T
I
I
O
O
N
N
A
A
N
N
D
D
R
R
E
E
S
S
P
P
E
E
C
C
T
T
E
E
D
D
I
I
N
N
N
N
O
O
V
V
A
A
T
T
I
I
V
V
E
E
D
D
A
A
T
T
A
A
B
B
A
A
S
S
E
E
C
C
O
O
L
L
L
L
E
E
C
C
T
T
I
I
N
N
G
G
A
A
L
L
G
G
O
O
R
R
I
I
T
T
H
H
M
M
F
F
O
O
R
R
T
T
E
E
X
X
T
T
U
U
R
R
E
E
A
A
N
N
A
A
L
L
Y
Y
S
S
I
I
S
S
S
Sh
he
e
r
r
va
v
an
n
F
F
e
e
kr
k
ri
i-
-
Er
E
rs
s
ha
h
ad
d
Department of Computer Science and IT, Amin University of Foolad Shahr, Isfahan, Iran
ABSTRACT: Texture analysis and classification are some of the problems which have been paid much attention by image processing scientists since late 80s. If texture classification is done accurately, it can be used in many cases such as object tracking, visual pattern recognition, and face recognition. Since now, so many methods are offered to solve this problem. Against their technical differences, all of them used same popular databases to evaluate their performance such as Brodatz or Outex which may be make their performance biased on popular databases. In this paper, some metrics are proposed to collect more actual database of texture images. The proposed approach is included two stages. The first one is developing feature representation based on structural and statistical features and the next one is consisted an algorithm which termed SFCO to collect images based on metrics. Finally, in order to prove the quality of developed metrics, some texture classification approaches are applied on proposed database. Decreasing the probability of biasing texture classification approaches on popular database is the main advantage of this paper.
KEYWORDS: Database Collecting, Texture Classification, Statistical Features, Structural Features
1. INTRODUCTION
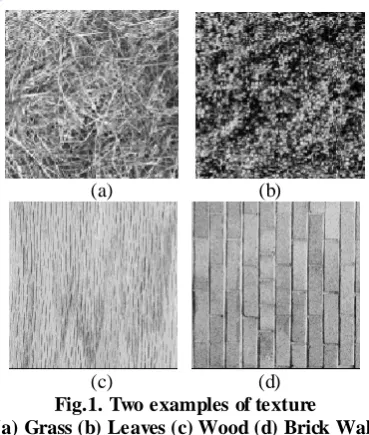
Texture analysis and classification are some of the problems which have been paid much attention by image processing scientists since late 80s. Texture analysis is one of the basic stages in computer vision cases such as object tracking, visual pattern recognition, face recognition, skin detection, image retrieval and etc. Texture is a description of the spatial arrangement of color or intensities in an image or a selected region of an image. There are some aspects about textures such as size of granularity, directionality, randomness or regularity and texture elements. Analysis these aspects may be useful to classify the textures in one or more than images. For example, two different textures of grass, leaves, Wood, and Brick wall are shown in Fig.1, which are different in many terms such as regularity, directionality and etc.
In this respect, many methods are offered to solve this problem accurately. These methods are difference in technical details. Some of these methods directly work on the taken images of the textures, such as Texture Classification Based on Random Threshold
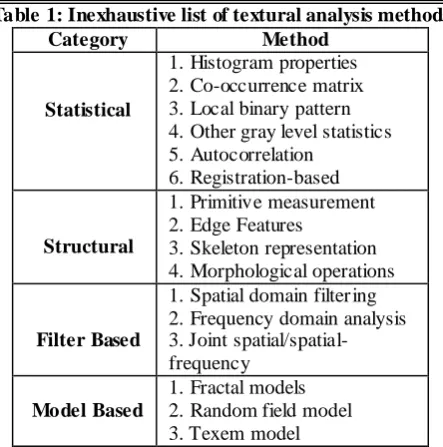
Vector Technique [R+10], and Texture Classification Based on Primitive Pattern Units [Ers11]. Another group of methods, first do some process on the images and then search for suitable features related to the class labels, such as texture classification by using advanced local binary patterns, and spatial distribution of dominant patterns [LC07] and New Color-Texture Approach for Industrial Products Inspection [AML08]. Xie [Xie08] categorized the techniques used to texture analysis in four categories, statistical approaches, Structural approaches filter based methods, and model based approaches.
Some other approaches proposed a robust method which is combination of structural and statistical features. For example, in [ANG10] an approach is proposed for classification of medical Indian plants based on combination of color, texture and edge features together.
(a) (b)
(c) (d) Fig.1. Two examples of texture (a) Grass (b) Leaves (c) Wood (d) Brick Wall
Table 1: Inexhaustive list of textural analysis methods
Category Method
Statistical
1. Histogram properties 2. Co-occurrence matrix 3. Local binary pattern 4. Other gray level statistics 5. Autocorrelation
6. Registration-based
Structural
1. Primitive measurement 2. Edge Features
3. Skeleton representation 4. Morphological operations
Filter Based
1. Spatial domain filter ing 2. Frequency domain analysis 3. Joint spatial/spatial-frequency
Model Based
1. Fractal models 2. Random field model 3. Texem model
Against, technical differences between proposed texture analysis techniques, in order to evaluate their performance, all of them applied their algorithms on same popular databases such as Brodatz and Outex. This similarity may make the m biased on databases. In this respect, there are some basic questions here that, why these databases are used? How much are these natural? Or, how much are different their images in terms of regularity, directionality or etc? Briefly, why these texture images are collected in a database?
Since late 90s, nearly all of the proposed texture classification methods considered Outex and Brodatz databases as the train and test images. It may make methods and related performance biased to these images. This problem absolutely decrease the accurately rate versus untrained images in real applications. Some researchers were proposed texture analysis techniques with high accuracy rate which are not useful in special applications because of biasing to the popular databases.
In this paper, some metrics are proposed to choose an image for a texture database which is more general than previous. In order to have a more general database which includes high range of natural textures, an algorithm is proposed to collect images using proposed metrics.
2. METRICS TO ANALYSIS TEXTURES
The aim of this section is to look for features that discriminate textures. In this respect, previous features are looked to collect discriminative ones together as a feature vector called F. Since now, many features are proposed to analysis textures such as Local binary patterns (LBP), Haralick features, Voronoi polygon features, and histogram properties. There is a large overlap between these features. For example, Haralick features such as entropy and
energy can be computed based on histogram properties. My researches are shown that some features are more different between natural textures as follows:
2.1. Histogram Features
The histogram can be easily computed, given the image. The shape of the histogram provides many clues as to the character of the texture. For example, a narrowly distributed histogram indicated the low-contrast texture. A bimodal histogram often suggests that the texture contained an object with a narrow intensity range a gainst a background of differing intensity. Different useful parameters (image features) can be worked out from the histogram to quantitatively describe the first-order statistical properties of the image.
Most often the so-called central moments are derived from it to characterize the texture. Among them, mean, skewness, kurtosis, energy and entropy are more reliable and discriminant for texture analysis and classification. These are defined by Equations (1 to 4) as below.
Mean: (1)
Skewness: (2)
Kurtosis= (3)
Energy = (4)
Entropy= (5)
Where, G is total number of intensity levels in image, p(i) means the occurrence probability of ith level of intensity in image. σ is the total variance of the image.
a measure of histogram uniformity. Other possible features derived from the histogram are the minimum, the maximum, the range and the median value.
2.2 Gray Tone Difference Matrixes
A Grey-Tone Difference Matrix (GTDM) was suggested in [AK89] in an attempt to define texture measures correlated with human perception of textures. A GTD matrix is a column vector containing G elements. Its entries are computed based on measuring the difference between the intensity level of a pixel and the average intensity computed over a square, sliding window centered at the pixel. Suppose the image intensity level f(x,y) at location (x,y) is i, i=0,1,…,G-1. The average intensity over a window centered at (x,y) is
(6)
where K specifies the window size and W = (2K+1)2. The ith entry of the gray-tone difference matrix is:
(7)
Notice, for all pixels having the intensity level i and otherwise, s(i) = 0.
Three different features were derived from the GTDM, to quantitatively describe such perceptual texture properties as follows:
A. Coarseness (defined by the size of texture primitives):
(8)
Where, ε is a small number to prevent the coarseness coefficient becoming infinite and pi is the estimated probability of the occurrence of the intensity level i and pi = Ni / n. Also, with Ni denoting the number of pixels that have the level i, and n = (N-K)(M-K).
B. complexity (dependent on the number of different primitives and different average intensities):
(9)
C. texture strength (clearly definable and visible primitives):
(10)
Some other features such as contrast and busyness can be derived using GTDM, but the result shows discrimination effect of these features are not much in this case.
2.3. Proposed Discriminant Feature Vector fo r Textures
In order to collect a texture database, the first stage is providing a feature representation for each input candidate image. According to the previous sections, some metrics are described which can be derived for each image. In this respect, the feature vector F can be described as follows, which can be a good identifier for each input candidate.
(11)
Where, Fi means the feature vector which is computed for ith candidate input image. Also, f1, f2, .. f8, are the feature values which can be computed using Equations 1 to 11.
3. PROPOSED ALGORITHM TO COLLECT
DATABASE
The aim of this section is to propose an algorithm to choose texture images between candidates which should be collected in database. In order to collect a database in artificial intelligence cases, some motivations should be considered as follows:
A. The database should covered all search space which is really may be occurred in the case
B. The search space should be balanced in terms of samples and its feature values
In the previous section, an identifier feature vect or is presented to analysis each texture candidates. Each texture candidates is a sample which can be joined to the database or not. In order to collect a database which handled two motivations, an algorithm is proposed in this section which is called SFCO (Selected Farthest Candidate by Others). SFCO is included nine steps, as follows:
I. Let "N", as the total number of images in desired database.
II. Compute the proposed feature vector F for all of the texture candidates as it is proposed in Equation 11. The computed feature vector for ith candidate is notified by Fi.
finally, Soergel is provided most accuracy. It is shown in Equation 12.
where: (12)
where, Dith-total is shown the summation distance between ith candidate and all of others. D(Fi,Fj) means the distance between feature vectors which are extracted for ith and jth candidates. Also, K is shown the number of features and fik is shown the value of kth feature in Fi.
IV. Sort the candidates in a table based on their distance summation.
V. Choose the N candidates which are at the high rank of the sorted table.
VI. Compute the average feature vector for chosen set of images, using Equation 13. It is notified by Favg.
(13)
VII. Compare the distance between each one of the chosen images and Favg. Select the maximum computed distance in this step as threshold. It is shown in equation 14.
(14)
VIII. Compare the distance between each one of Non-Chosen candidates and Favg.
IX. Relocation each non-chosen images which have distance more than threshold, with chosen image which is at the lowest rank in the sorted table.
Notice, the steps 6 to 9 are considered to avoid of unbalanced groups. In order to example unbalanced groups, suppose some images that are similar together, in this respect, because of their total number, none of them may be chosen. This group of candidates is called unbalanced groups because of their size against other candidate groups. This is due to normalization part, 1/N which is used in equation 13 as a necessary parameter. In order to solve unbalanced problem, steps 6 to 9, are relocated center of unbalanced groups with forest member.
4. RESULTS
The main aim of this paper is discussed in two categories. The first goal is to propose some metrics to analysis textures and the second one is proposing a
texture collection algorithm. In order to evaluate the performance of the first aim, texture classification based on proposed feature vector may be a good idea. In this respect, one of the popular texture databases which call Brodatz is considered.
Brodatz dataset is included 112 classes of textures. In this dataset, each class is included one texture image in size of 512×512. In order to provide satisfied number of train and test images for classifying, each one is cropped to non-overlap windows in size of 128×128. In this respect, 16 images are provided for each class. At random, 40% of images are considered as train and 60% for test set [EH11]. The proposed feature extraction approach is applied on them. Finally, texture classification is done using K-nearest neighborhood as classifier. This process is repeated 10 times and the total classification rate is shown in the table 2. Also, J48 tree and Bayesian network are used as classifier in a same way. Notice, the computed feature vectors are normalized in each dimension based on the dimension range.
In order to compare the performance of the proposed feature extraction algorithm and other methods, classification is done using some other well-known, efficient and new feature representation methods such as combination of primitive pattern units and statistical features [Ers11], random threshold vector[R+10], and energy variation [Ers12]. The classification rates are shown in table2. Some other classifiers such as J48 tree and Bayesian Network are used. Respected, results are shown in table3.
Table2. The classification rate of proposed approach and some other methods using KNN classifier
1NN
Method Proposed [Ers11] [R+10] [Ers12] Accuracy
rate 90.33±0.1 93.31±0.5 88.17±0.1 89.46±0.2 3NN
Method Proposed [Ers11] [R+10] [Ers12] Accuracy
rate 95.47±0.3 95.23±0.5 90.11±0.4 94.2±0.6 5NN
Method Proposed [Ers11] [R+10] [Ers12] Accuracy
rate 93.87±0.1 94.31±0.4 90.36±0.2 90.07±0.6
Table3. The classification rate of proposed approach and some other methods using J48 and B.N. Classifiers
J48 Tree
Method Proposed [Ers11] [R+10] [Ers12]
Accuracy
Rate 93.17±0.2 92.65±0.2 86.47±0.5 93±0.1 Bayesian Network
Method Proposed [Ers11] [R+10] [Ers12] Accuracy
As, it is shown in the tables2 and 3, the proposed feature representation has satisfied quality to classify textures accurately. However, in the table2, the [Ers11] using 1NN and 5NN, is provided better accuracy rate, but the best accuracy rate is provided by proposed approach based on 3NN as classifier. As it is seen in table3, the proposed approach is more efficient and accurate than other ones. Exactly, 95.87 classification rate, which is provided by proposed approach using Bayesian network, is the best in two tables.
In order to evaluate performance of the proposed approach for collecting database, a novel test is proposed as follows:
First of all, N texture images are collected based on proposed algorithm, next, the proposed feature representation is applied on them, and N feature vector are provided. This process is applied exactly on popular databases such as Brodatz and Outex. According to the mentions that are discussed in the section3, therefore, we will be looking for a projection where examples from the same class are projected very close to each other and, at the same time, the projected means are as farther apart as possible. This discussing is shown in fig.2. In [TK03], the fisher measure is discussed to show the qua lity of clustering approaches. In our case, each one of the chosen images have a role same as a cluster center. According to the numerator of fisher equation, how much the cluster centers are far from others, clustering algorithm is covered more search space. It is shown in equation 15.
(15)
Where, µi is shown the mean of ith cluster members which is equal by Fi in our collected dataset. C is the number of classes, which is equal by N in our collected dataset. Also, is used to normalize the computed fisher value based on size of datasets. In the table4, the numerator of fisher measure is computed for our collected database and previous.
Fig.2. The desired projection of collected images
In the Fig. 2., each cluster centers which are notified by µ1 and µ2, are same with database members in our case. The members are too far from each other; hence, the database covered a vast search space.
Table4. The fisher value of proposed collected database and some popular texture dataset
Dataset Proposed
Collected Brodatz Outex Simplicity
Fisher 0.743 0.472 0.510 0.418
The results are shown that the collected database is covered more spaces of the texture analysis search space. Respectively, as it is seen in table4, the collected database is more general than others.
CONCLUSION
The main aim of this paper was to propose a robust algorithm to collect general databases which are used for image processing cases such as texture analysis and classification. In this respect, a feature representation is proposed based on combination of histogram statistical features and gray tone different matrixes. Next, an innovative algorithm is prepared to make a texture database. In order to evaluate collection algorithm, the image candidates are represented using proposed feature extraction method, and were chosen as database member based on their distance.
The results are shown that the proposed feature representation provides discrimination to analysis and classification textures. The results are shown that the database which is made based on proposed algorithm is more general than others and it covers texture analysis search space more than previous. Other advantages of this research are as follows:
I. Providing general and applicable texture database collecting algorithm which can be used for special cases.
II. Proposing feature representation method which can be used for very broad categories of image processing problems such as texture analysis, classification, image segmentation, visua l defect detection and etc.
III. Low computational complexity of applying proposed feature representation against filter based and model based methods.
IV. Solving the biasing to popular database problem which may be occurred for texture analysis researches.
FUTURE WORK
The proposed collection algorithm is a general one which is not limited by a specific feature representation. In this respect, one interesting future research is to study for more accurate and general feature extraction methods to use. Collection databases which are included multi-sample classes, is a new problems in computer vision. The proposed collecting algorithm is not sensitive to the number of samples; therefore, it can be used for discussed problems as a future research.
ACKNOWLEDGMENT
The author likes to say thanks to Mrs. Sana Karimian Ardestani (MS.c. student of agriculture engineering) because of her support for providing a comfortable research environment.
REFERENCES
[AK89] M. Amadasun, R. King - Textural features corresponding to textural properties, IEEE Transactions on System, Man Cybernetics, Vol. 19, No. 5, 1989
[AML08] M. A. Akhloufi, X. Maldag ue , W. B.
Larbi - A new color-texture approach
for industrial products Inspection, Journal of multimedia, Vol. 3, No. 3, 2008
[ANG10] B. S. Anami, S. S. Nandyal, A.
Govardhan - A combined color, texture
and edge features based approach for identification and classification of Indian medical plants, International Journal of Computer Applications, Vol. 6, No. 12, 2010
[Cha08] S. H. Cha - Taxonomy of nominal type histogram distance measures, In Proc. of American Conference on Applied Mathematics, Vol. 1, 2008
[Ers11] S. Fekri-Ershad - Color texture classification approach based on combination of primitive pattern units and statistical features, International Journal of Multimedia and its Applications, Vol. 3, No. 3, 2011
[Ers12] S. Fekri-Ershad- Texture classification approach based on energy Variation,
International Journal of Multimedia Technology, Vol. 2, No. 2, 2012
[EH11] S. Fekri-Ershad, S. Hashemi – To increase quality of feature reduction approaches based on processing input datasets, IEEE International Conference on Data Storage and Data Engineering, Vol. 1, 2011
[LC07] S. Liao, A. C. S. Chung - Texture classification by using advanced local binary patterns and spatial distribution of dominant patterns, IEEE International Conference on Acoustics, Speech and Signal Processing, Vol. 1, 2007
[Mon04] V. Monev - Introduction to similarity searching in chemistry, MATCH Communication in mathematical and in computer chemistry, Vol. 51, 2004
[R+10] B. V. Reddy, M. R. Mani, B. Sujatha,
V. V. Kumar - Texture Classification
Based on Random Threshold Vector Technique, International Journal of Multimedia and Ubiquitous Engineering, Vol. 5, No. 1, 2010
[TK03] S. Theodoridis , K. Koutroumbas -
Pattern Recognition (Second Edition), Elsevier Academic Press, 2003