454
Copyright © 2016. Vandana Publications. All Rights Reserved.
Assessment of Land Use/Cover Changes in Lower Tesua Subwatershed
in Chhattisgarh through Remote Sensing and GIS
Ajay K Singh
Department of Forestry, Wildlife & Environmental Sciences, Guru Ghasidas University, Bilaspur, Chhatisgarh, INDIA
ABSTRACT
In this study, remote sensing and geographical information system (GIS) was used to assess spatial changes in the land use/cover (LULC)changes of lower Tesua subwatershed by using Landsat7 ETM+ data between 2000 and 2009. The LULC change detection analysis for year 2000 and year 2009 indicates that Agricultural land with crop and Agricultural land without crop have been increased 18.78 km2 (13.22%) and 0.55 km2 (0.38%). The
settlement area has been also increased 5.38 km2 (3.78%). But the Scrub land, Waste land, Water bodies and Standing trees have been found decreased 2.06 km2 (1.45%), 11.56 km2 (8.18%), 4.56 km2 (2.66%) and 6.66 km2 (4.32%) respectively. This study concluded that illegal logging, grazing, population increase and encroachment causes LULC changes in the subwatershed.
Keyword-- (GIS) was used to assess spatial changes in the land use/cover
I.
INTRODUCTION
In the watershed, land use/cover pattern has changed from traditional subsistence farming to high yielding variety of cash crops, vegetables and fruits. These changes are primarily responsible for degrading the quality of environment and vegetation pattern in a system. Land use/cover and its changes is a key to many diverse applications such as environment, forestry, hydrology, agriculture and geology. The changes in LULC occur naturally in a progressive and gradual way, however sometime it may be rapid and abrupt due to anthropogenic activities (Giriraj et al., 2008). Remote sensing helps in acquiring multi spectral spatio-temporal data through space borne remote sensors. It provides multi-spectral, multi-temporal and multi sensor data of the earth surfaces (Lillesand and Kiefer, 2000; Choudhary, 1999; Diaz, 2006; Tzoraki, 2007; Latron, 2008). Digital image processing techniques helps in
analysing the dynamic changes associated with the earth resources such as land and water using remote sensing data (Weng, 2001; Al-abed et al., 2005). Remote sensing and GIS play an important role in watershed management and helps in planning water resources development in the watersheds (Tripathi et al., 2010). One of the big advantages of using Remote sensing data for hydrological investigations and monitoring is its ability to generate information in spatial and temporal domain (Saraf, 1999).
This study made use of remotely sensed data and GIS techniques to evaluate qualitatively and quantitatively outcome of lower Tesua subwatershed land use/cover distribution. Obtaining results were compared with each other, visualised and analysed in Geographical Information System.
II.
STUDY AREA
455
Copyright © 2016. Vandana Publications. All Rights Reserved.
Fig. 1. Location map of Lower Tesua subwatershedThe lower Tesua sub watershed experiences tropical monsoon type of climate receiving moderate to high rainfall. Rain fall occurs mostly in rainy season from mid June to mid September. The total rainfall from July to September varies from 962.5 to 1425.5 in mm. The temperature varies according to the relief and elevation of the sub watershed. The temperature increases from February in whole sub watershed. January is the coolest month, the minimum monthly temperature is 11.20C and 30.30C is the maximum temperature recorded in the sub watershed. May is the hottest month, minimum monthly temperature is 18.10C and 47.30C is the maximum temperature recorded in the sub watershed. The soil of the sub -watershed is pre dominant residual. Fine loamy soil is found more than 45% area of the sub watershed Fine skeleton, Clay, Fine mixed soil are found as 30%, 20%, 5% area respectively.
III.
MATERIALS AND METHODS
The present study is based on secondary sources of information of the sub watershed area under different land use and were collected from statistical department of Pathariya block of Mungeli district. LULC change detection were analyzed by using satellite data of Landsat 7 ETM+ (path/row: 144/42) of year 2000 and 2009. The Survey of India topographic sheets no. 64-J/13 and 64- K/1 ofscale 1:50,000 has been used as a base reference map for the study. Preliminary information about the hydro-geomorphology, geology of the study area were collected through literature review which served the basis to carry out the reconnaissance in the study area. Ground truth verification was done by conducting various field trips in the study area for collecting information that is used either to corroborate or update the existing thematic data and to generate subsequent themes for decision making. Climate data like rainfall and temperature was collected from various
meteorological stations located in the study area. The entire digital processing task was carried out using ERDAS Imagine software, while analysis work was carried out in ArcGIS environment. The study area was mosaic and generated from the georeferenced topographic maps. Base layers like sub-watershed boundary along with drainage and contours with 20 m interval were delineated from the topographic map mosaic. These base layers are later integrated for the computation of Drainage, Water Bodies, Agriculture, Road and LULC. Multi-temporal remote sensing images were georeferenced and rectified with the help of georeferenced topographic maps. Various radiometric and spectral enhancement algorithms were employed to remove the noise and to enhance the interpretability of the data. In order to cut the areas outside of the study area boundary the images were clipped using the basin boundary AOI extracted from the georeferenced topographic sheets. The remote sensing data then visually interpreted with the help of various visual interpretation indicators, like, shape, size, pattern, tone/color, texture and association. Based on a two level classification schema various land use and land cover feature classes have been interpreted and mapped accordingly. Subsequently, seven LULC classes viz; agriculture land with crop, agriculture land without crop, scrub land, waste land, water bodies, standing trees and settlement were computed for comparison analysis. Intensive field checks were conducted in the study area for ground truth verification.
IV.
RESULTS
Drainage pattern analysis:
456
Copyright © 2016. Vandana Publications. All Rights Reserved.
Fig. 2. Drainage map of lower Tesua subwatershedSpatio- temporal LULC analysis
Land use/cover defined as all land bearing vegetation, surface, water, settlement etc. The LULC of the subwatershed has been broadly categorized into seven classes viz; Agricultural land with crop, Agricultural land without crop, Water bodies, Waste
land, Standing trees, Settlement area and Scrub land. The final data of the Land Use/Cover status of Lower Tesua sub watershed in two years has given in table 1:
Table 1: Spatial and Temporal variation in LULC for year 2000 and 2009
LULC Classes 2000 2009 Change detection
(2000-2009) Area (in km2)
Area ( in km2) %age
Agricultural land with crop 38.41 57.19 (+) 18.78 (+)13.22
Agricultural land without crop
18.12 18.67 (+) 0.55 (+) 0.38
Scrub land 7.96 5.90 (-) 2.06 (-) 1.45
Waste land 23.03 11.47 (-) 11.56 (-) 8.14
Water bodies 26.90 22.34 (-) 4.56 (-) 3.21
Standing trees 14.57 7.91 (-) 6.66 (-) 4.69
Settlement 13.94 19.32 (+) 5.38 (+) 3.78
Total 142 142
457
Copyright © 2016. Vandana Publications. All Rights Reserved.
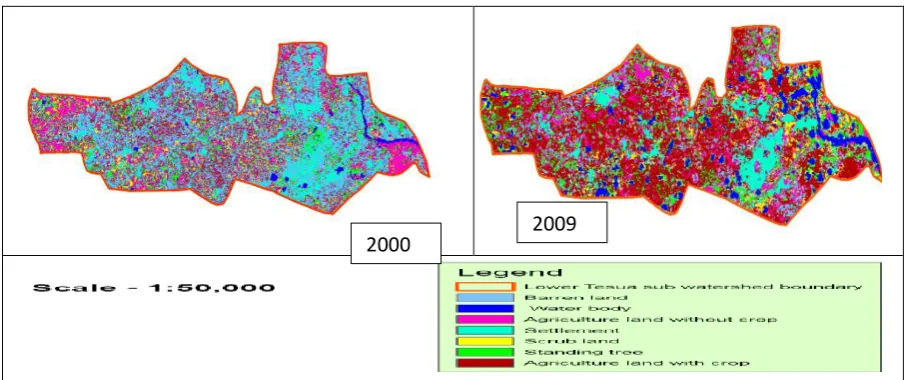
Fig. 3. Supervised classification map of lower Tesua subwatershedThe table 1 and fig 3 summarizes the land use/ land cover of Tesua sub watershed. During 2000, the agriculture with crop area was recorded as 38.41 km2 (27.04%), agriculture land without crop as 18.12 km2 (12.76%), scrubland as 7.96 km2 (5.6%), wasteland as 23.03 km2 (16.12%), water bodies as 26.90 km2 (18.3%), standing trees as 14.57 sq kms (9.85%) and settlement area as 13.94 km2 (9.81%). During 2009, the most extensive scrub land, wasteland, water bodies and standing trees area changed into agricultural land which covers 57.19 km2 (40.04%), followed by water bodies area of 22.34 km2 (15.64%), settlement area as 19.32 km2 (13.53%), waste land as 11.47 km2 (8.03%). The LULC change detection analysis for year 2000 and year 2009 indicates that Agricultural land with crop and Agricultural land without crop have been increased18.78 km2 (13%) and0.55 km2 (0.38%). The settlement area has been also increased 5.38 km2 (3.72%). But the Scrubland, Waste land, Water bodies and Standing trees have been found decreased 2.06 km2 (1.45%),11.56 km2 (8.18%), 4.56 km2 (2.66%) and 6.66 km2 (4.32%) respectively.
V.
CONCLUSION
Watershed management is a mechanism that ensure land resources are preserved, conserved and exploited sustainably now and for future generation. The watershed management approach integrates various aspects of forestry, agriculture, hydrology, ecology, soils, physical climatology and other sciences. It is a continuous and participatory process that involves people and aim to improve their livelihoods. A watershed approach can be coordinating framework for management that attempts to focus public and private, community and individual efforts towards addressing high priority land use and water related issues within the hydro logically defined geographic area (FAO report, 2010). Lower Tesua sub watershed has play a vital role to shaping and supporting diverse cultures and professions. Specific characteristics of streams and river reflect an integration of countless physical and biological
processes providing long-term influences of environmental conditions. Rainfall over the land surface provides input for recharging the soil with water, replenishing groundwater reservoirs and providing run-off in streams and rivers. The socio-economic condition of the local population of the sub watershed is completely depends on agriculture. Most of the population comes under poor living and there is no any alternative source of income is available for them. So, income and employment generation is the basic priority and challenge in lower Tesua sub watershed.
REFERENCES
[1] Al-Abed, N., Abdulla, F., Khayarah, A.A. (2005). GIS hydrological models for managing water resources in the Zarqa river basin, Environ. Geol., 47: 405-411. [2] Choudhary, P. R. (1999). Integrated remote sensing and GIS techniques for groundwater studies in part of Betwa basin, Ph. D. Thesis. Department of Earth Sciences, University of Roorkee, India.
[3] Diaz, Palmer, Garcia, A., Servera, C., Ubeda, X. (2006). Spatial variability of total nitrogen, total carbon and organic carbon content in the top-soil of the Na Borges basin, Mallorca, Spain. Zeitschrift fur Geomorphologie. 143: 83-94.
[4] FAO(2000). Land water linkages in rural watershed: Introductory note. Land –water Linkages in Rural watershed Electronic Workshop, 18-27 October, 2000 FAO, Rome.
[5] Giriraj, A., Babar, S., Reddy, C.S. (2008). Monitoring of forest cover change in Pranahita wildlife sanctuary, Andhra Pradesh, India using remote sensing and GIS. J. Environ. Sci. Technol., 1: 73-79.
[6] Latron, J., Soler, M., Llorens, P., Gallart, F. (2008). Spatial and temporal variability of the hydrological response in a small Mediterranean research catchment (Vallcebra, Eastern Pyrenees). Hydrological Processes 22 (6): 775-787.
[7] Lillesand, T.M. and Kiefer, R.W. (2002). Remote sensing and Image Interpretation, John Wiley,Singapore.