Volume-4, Issue-4, August-2014,
ISSN No.: 2250-0758
International Journal of Engineering and Management Research
Available at:
www.ijemr.net
Page Number: 54-58
A Comparative Study Of Efficient Lending by Indian Commercial
Banks
Deepa Damodaran1, Dr. Kalyani Rangarajan2, Dr. P James Daniel Paul3 1,2,3
VIT Business School, VIT University, Chennai, INDIA
ABSTRACT
Higher mobilization of the loans by the Banks indicate the higher level of facilitation and support. However higher levels of default indicates the opposite. This study after the review of over 20 empirical articles, attempts to use the Reserve Bank of India information to assess the credit portfolio service levels of different types of banks in India. The study attempts to examine the case using the 1996-2012 RBI data set to understand the credit portfolio choice using the secondary data. The study finds the shifting stance of the credit portfolio preferences over the years from the old PSU banks to the PSU banks. Despite the lower start the new generation PSU banks are able to contain the risks.
Keywords- component; Banking, Non-performing Assets, NPA, Public sector Banks in India
I.
I
NTRODUCTIONAlmost 5% of the outstanding loans of the Indian banking industry are currently NPAs. This adds up to a whopping Rs 2.4 lakh crore for the 40 top banks –In case of some banks, the top 30 defaulters account for over half of all their NPAs by value. For the entire banking system, almost 40% of all NPAs come from these top defaulters. In the case of Punjab National Bank (PNB), the top 30 defaulters owed the bank a total of Rs 1,494 crore on 31st March 2011. State Bank of India, the top 30 defaulters owed the bank a whopping Rs 8,775 crore – Rs 292 crore for each account. However, since SBI is far larger than other lenders, these account for just about one-seventh of the NPA portfolio.Is there a relationship between the Non-performing assets of the Banks and the credit portfolio choice? Can it be measured without a survey? This paper makes an attempt to use secondary data from a 15 year Reserve Bank of India Data set. The data is subject to simple risk analysis and the OLS models to gain the understanding into the data set. This requires a detailed review of literature. Over 20 studies are reviewed
II.
S
URVEY OFL
ITERATUREG Sabato (2006) in his article Managing Credit Risk for Retail Low – Default Portfolios analyses Low default Portfolio‟s are portfolio‟s where there are very low
level of default. Hence unable to measure Loss Given default, Probability of Default and Exposure at Default. The mentioned paper discusses about measuring risk of such portfolio‟s
DJ Hand, MJ Crowder during (2005) “Measuring Customer Quality in Retail Banking” describes such a model that separates the observed variables for a customer into primary characteristics on the one hand, and indicators of previous behaviour on the other, and links the two via a latent variable that is identified as „customer quality‟.
E Kocenda during (2009) in their paper “Default Predictors and Credit Scoring Models for retail banking” develops a specification of the credit scoring model with high discriminatory power to analyze data on loans at the retail banking market. Parametric and non- parametric approaches are employed to produce three models using logistic regression (parametric) and one model using Classification and Regression Trees (CART, nonparametric). The models are compared in terms of efficiency and power to discriminate between low and high risk clients by employing data from a new European Union economy.
S Hlawatsch and P Reichling (2010) in an article “A framework for Loss Given Default validation of Retail Portfolios” state that Modeling and estimating loss given default (LGD) is necessary for banks that apply for the internal ratings based approach for retail portfolios. To validate LGD estimations, there are only a few approaches discussed in the literature. In this paper, two models for validating relative LGD and absolute losses are developed. The validation of relative LGD is important for risk-adjusted credit pricing and interest rate calculations. The validation of absolute losses is important to meet the capital requirements of Basel II. Both models are tested with real data from a bank. Estimations are tested for robustness with in-sample and out-of-sample tests.
55 ,Deposits, Fixed Assets , Assets, Priority Sector Advances
and Advances, Ratio Of Borrowings, Funds Management is the first step in the long-term strategic planning process. Therefore, it can be considered as a planning function for an intermediate term,It has also explained the investment pattern and optimal mix of assets and liabilities of scheduled commercial banks in India.
Sunil Kumar (2008) in An Analysis Of Efficiency–Profitability Relationship In Indian Public Sector Banks, Analyse Efficiency–Profitability Quadrants using variables relating to production, intermediation, net-interest income, net-interest expenses, net-interest income and „efficiency frontier maximization Efficiency profitability matrix models. They have explored the relationship between technical efficiency and profitability in Indian PSBs using the „efficiency–profitability matrix‟
Vinod Kumar (2013) in an analysis of the Success Parameters Of Indian Commercial Banks use Secondary data that had been used in the study: · Report on Trend and Progress of Banking in India, RBI, 2008 to 2012. The analysis covers data of Nationalized Banks, SBI and its associates,
Old Private Sector Banks (OPSBs), New Private Sector Banks (NPSBs), Foreign Banks (FBs), Interest income and interest expenses of banks, Non-Interest income and operating expenses of banks, Total Income and Total Expenditure. He has analysed the data using arithmetic mean and percentage statistical techniques He concludes that no bank group is successful in controlling its operating expenses within limits as compared to its non-interest income. Apart from this, SBI and Its Associated bank group and New Private sector bank group are more successful as compared to other bank groups as their percentage increase in income side is more than the percentage increase in expenditure side.
Ashfaq Ahmad,Kashif-Ur-Rehman and Muhammad Iqbal Saif (2010), in their article on Islamic Banking Experience Of Pakistan: Comparison Between Islamic And Conventional Banks find positive relationships between service quality and borrower satisfaction regarding Islamic banks in Pakistan. There will be positive relationships between service quality and borrower satisfaction. They use variables like Islamic and conventional banks, relationship between service quality and borrower satisfaction, using IBSQL-IBCS model, CBSQL-CBCS model. Correlation, Linear Regression Model, This study examined the relationship between service quality and borrower satisfaction by comparing Islamic and conventional banks operating in Pakistan. The researchers collected data from 720 respondents. The responses of bank borrowers were analyzed by Pearson‟s Correlation and regression. The results indicate that there is strong direct and positive relationship between service quality and borrower satisfaction. The magnitude of relationship between service quality and borrower satisfaction is greater in Islamic banks as compared to conventional banks.
Syed Ibrahim M (2011) in Operational Performance Of Indian Scheduled Commercial Banks-An Analysis use variables like Deposits, Investments, Credits, Loans and advances, Reserve Bank of India, Aggregate Deposits of Scheduled Commercial Banks, Credits Deployed by Scheduled Commercial Banks, Investments made by Scheduled Commercial Banks, Credit-Deposit
Ratio and Investment Deposit Ratio, Deposits and Credits of Scheduled Commercial Banks per Office, Role of Scheduled Commercial Banks in the Priority Sector Lending, diagnostic and exploratory in nature and makes use of secondary data. This study is confined only to the specific areas such as Aggregate Deposits mobilized by these banks, Loans and Advances, Credit-Deposits Ratios, Investment-Deposits Ratios, for the ten years period starting from the year 2000 to the year 2009. In order to analyze the data and draw conclusions in this study, various statistical tools like Descriptive Statistics, „t‟test, and Correlation have been applied. This research paper reveals that the operational performance of Indian Scheduled Commercial Banks has improved since the year 2000. Aggregate deposits show a constant increase. The percentage of time deposits to aggregate deposits mobilized by the Scheduled Commercial Banks was high in 2009. It was found that there is a positive correlation between demand deposits and time deposits. Credits deployed and investments made by these banks have shown significant performance. The Indian Scheduled Commercial Banks have been more efficient by maintaining the C-D ratios in an increasing trend over the period of the study
Mahipal Singh Yadav (2011), in his study on Impact of Non Performing Assets on Profitability And Productvity Of Public Sector Banks In India study the Non-Performing Asset Of Public Sector Banks, Aggregate Impact Of Non-Performing Assets On Profitability, Impact Of Non-Performing Assets In Priority And Non- Priority Sector, Aggregate Impact Of Non-Performing Assets On Profitability With Other Banking Variables,Non-Performing Assets And Productvity,Non-Performing Assets And Productvity use variables like Total Advance, Gross NPA,NPA of Priority sector, NPA of non-priority Sector value of spread and burden, Priority sector advances, Credit–Deposit ratio, Operating expenses, Term deposits, Provisions and contingencies, Value of Non-performing assets, using Regression Analysis. The study concludes that gross non-performing assets of public sector banks in absolute terms has shown increasing trend till 2001 and declined later on, whereas its percentage shown declining trend. One fourth amount of total advances of public sector banks was in the form of doubtful or non-performing assets in the initial year of nineties, which raising question mark on the credit appraisal performance of the public sector banks in India.
Organizational goals Increasing productivity Enhancing borrower service Utilization of existing system Instituting cross-functional systems Building integrated information systems, Cash management Product, Borrower information, Retail Banking, Regulatory Compliance, Integrated product information, Marketing Research, Atm Planning, bank marketing, Bank acqisition, media marketing Their survey confirms the technology predictions of many practitioners and experts in the IS community, namely, the increasing growth of client server systems and local area networks. Empirical study which investigated the contribution of IS to banks in Florida. There are several interesting findings that emerged from this study. First, there is a lack of rigorous analysis and theoretical frameworks that explore the link between IS investments and a bank‟s efficiency, Second, top IS professionals strongly feel the need for developing more rigorous cost-benefit methodologies that will help them sell the technology to top management. Third, traditional measures of productivity, such as decrease in operating costs and increase in profits, continue to be the most popular measures of efficiency and return on investments, although these measures may not be suitable for information systems and technologies.
Amarender Reddy A, (2002), in his article, Banking Sector Performance During Liberalization In India-A Review , compares performance among public sector banks for three years in the post-reform period, 1992, 1995 and 1998.Their study covered 70 banks in the period 1986-91. They analyse variables like Spread, Income ratio, total assets wage costs. Capital adequacy and asset quality, Median profit per employee, Non-interest income to working funds, The ratio wage bill to total expenses, the cost to income ratio, Cash reserve ratio and statutory liqudity ratio They conclude that there has been a decline in spreads and intermediation costs widely used measures of efficiency in banking and a tendency towards their convergence across all bank-groups.In short, only cost effective, costumer focused, technology driven, capital strengthen banks which follow prudential regulations can only sustain in attracting depositors and borrowers in the current competitive environment.
Uppal (2011) in an article E-Delivery Channels In Banks-A Fresh Outlook analyse the data of Nationalized Banks G-I, State Bank Group G-II Old Private Sector Banks G-III, New Private Sector Banks G-IV, Foreign Banks G-V Computerization in Public Sector Banks, Branches and ATMs of Scheduled Commercial Banks, Transactions through Retail Electronic Payment Methods, ATMs as a percentage of Total Branches, Internet Banking Branches as a percentage of Total Branches, Mobile Banking Branches as a percentage of Total Branches, Tele Banking Branches as a percentage of Total Branches They conclude that technology is taking place but this speed is quite slow in Indian banking industry particularly, in public sector banks. The future outlook demands heavy investment in information technology.The study concludes that more developments in technology are taking place. In the face of the new competitive pressures, inherent rigidities in public sector banks to enhance serious challenges. The gap between partially using IT in banks and fully using IT in banks has widened
Hemali G. Broker and Bhadresh H. Senjaliya (2013) in the article on “Pros & Cons Of Banking Facilities In India”, use variables like FDIC Insured, Getting Paid to Save, Loans, credit, Automated Teller Machines ATM, Electronic Clearing Service (ECS), Electronic Funds Transfer (EFT), tele-banking, internet banking etc Investors' Trust, Economics of Scale, Resource Utilization, Profitable Diversification, Easy Marketing, One-stop Shopping The study concludes saying, Banking has become very,the demands of the people are still on the
increase and banks are
now thinking of new schemes and policies to protect and promote the interests of their Borrowers. The prospect of E-Banking is becoming popular day by day. Even people who do not have an access to the Internet can perform banking transactions through the telephone. The latest trend in banking is M-banking or mobile banking, which is a venture now on the test run
After the survey of the literature, The available indicators for the borrower Choice and the Non performing assets were collected from the Reserve Bank of India website The results of the analysis are presented below.
III.
ANALYSIS
In this section the graphs of the advances and NPAs are presented.
The area graph indicates that the SCB advances are of greater proportion than that of the PSU or old PSU advances.
57 In the first section the descriptive of the schedule
commercial banks are presented.
Table I CAGR of Banking Variables
S.NO BANKING VARIABLES CAGR
1 SCB Gross Advances 19%
2 SCB Net Advances 20%
3 SCB Amount 7%
4 SCB Gross NPA as a percentage of Gross advances -10%
5 SCB NPA as a % of total Assets -8%
6 SCB NPA amount 7%
7 SCB Net NPA as a% of Net Advances -10%
8 SCB NPA as a % of Total Assets -8%
9 OPSB Gross Advances 16%
10 OPSB Net Advances 16%
11 OPSB Amount 4%
12 OPSB Gross NPA as a percentage of Gross advances -11%
13 OPSB NPA as a % of total Assets -9%
14 OPSB Net NPA as a% of Net Advances -14%
15 OPSB NPA as a % of Total Assets -12%
16 PSB Gross Advances 18%
17 PSB Net Advances 20%
18 PSB Amount 6%
19 PSB Gross NPA as a percentage of Gross advances -10%
20 PSB NPA as a % of total Assets -8%
21 PSB NPA amount 7%
22 PSB Net NPA as a% of Net Advances -10%
23 PSB NPA as a % of Total Assets -8%
24 PSB NPA as a % of Total Assets -8%
SCB : Schedule Commercial Bank OPSB: Old Public Sector Banks PSB : Public Sector Banks
While estimating the CAGR for banking related variables it was found that the following variables had a positive CAGR SCB Gross Advances,SCB Net Advances,SCB Amount,SCB NPA amount,OPSB Gross Advances,OPSB Net Advances,OPSB Amount,PSB Gross Advances,PSB Net Advances,PSB Amount,PSB NPA amount.
While estimating the CAGR for banking related variables it was found that the following variables had a negative CAGR
SCB Gross NPA as a percentage of Gross advances,SCB NPA as a % of total Assets,SCB Net NPA as a% of Net Advances,SCB NPA as a % of Total Assets,OPSB Gross NPA as a percentage of Gross advance,OPSB NPA as a % of total Assets,OPSB Net NPA as a% of Net Advances,OPSB NPA as a % of Total Assets,PSB Gross NPA as a percentage of Gross advances,PSB NPA as a % of total Assets,PSB Net NPA as a% of Net Advances,PSB NPA as a % of Total Assets.
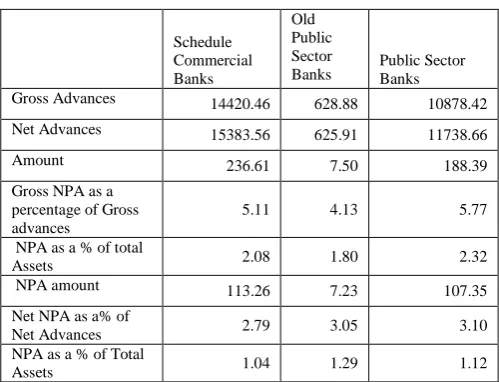
In order to assess the risks of different types of banks, the risk was assessed using the standard deviation in data relating to the three categories of banks. The results are presented in the table below.
Table II Comparison of Risks
Schedule Commercial Banks
Old Public Sector
Banks Public Sector Banks
Gross Advances 14420.46 628.88 10878.42
Net Advances 15383.56 625.91 11738.66
Amount 236.61 7.50 188.39
Gross NPA as a percentage of Gross advances
5.11 4.13 5.77
NPA as a % of total
Assets 2.08 1.80 2.32
NPA amount 113.26 7.23 107.35
Net NPA as a% of
Net Advances 2.79 3.05 3.10
NPA as a % of Total
Assets 1.04 1.29 1.12
The Standard deviation of the gross advances Indicate net advances of the scheduled commercial banks have the highest risk, the public sector banks remain the second and the old public sector banks is the lowest. But when we considered the Gross NPA as a percentage of Gross advances, Public sector banks rank the highest. Similarly in the case of NPA as the percentage of the Assets, the risk of the PSU banks remained the highest. In the case of the NPA amount also the deviation was the highest in the PSU banks. NPA as the percentage of advances also had the highest deviation at the PSU banks. But NPA as a percentage of the total assets was the highest in the old PSU banks. Traditionally the Public sector banks have always been accused of poor borrower service and the data analyzed by the article further proves the same.
In order to understand the impact of the NPA on the asset base of the banks three regression models were formed. They are
Βi = λi + λi δi +
μ………..[1]
Where β is the gross advances; λi is the advances at the ith type of bank. λ is the coefficient / slope of the equation and δ is the value of the Non performing assets.
Table III Regression Coefficients and the fit
Model
No Bank
Depen dent Variabl e
Indepe ndent Variab
le R2
Coeffec ient t
1 SCB SCB Gross Advan ces
(Const ant) .778
a
-9438.12 5
-1.161
SCB NPA amoun
t
86.082 3.433
2 OPSB PSB Gross Advan ces
(Const ant) .617
a 1789.683 5.239
OPSB NPA amoun
t
3 PSB PSB Gross Advan ces
(Const ant) .595
a
-2461.09 6
-.416
PSB NPA amoun
t
60.317 2.771
The regression results indicate that the SCBs model had a better fit that the other models. The While the constant of the PSU model was negative, the constant of the SCB model was the largest. This indicates the lower starts for the PSBs rather than the scheduled commercial banks. However the slope of the SCBs and the old PSU banks were negative while the slope of the PSU banks remained positive. This indicates despite the lower start of the PSU banks, the growth prospects of the PSU banks remain higher despite the lower start.
IV.
C
ONCLUSIONThis article attempts to prove that the borrower service need not be measured by the primary surveys but also by the secondary data. The findings of the study reveal that the overall scheduled commercial banks and the old PSU banks had a higher start than the PSU banks. However the growth rates of the PSU banks are significant and positive than the other two categories. While the value of the assets or their risks in the old PSU banks are lesser the risk of the other banks. This indicates that though the industry as a whole is facing challenging time with the borrowers, the new PSU banks are able to cope up with the circumstances. But the older PSU banks are unable to take cope up with the requirements of the borrowers.
R
EFERENCES[1] Shameem Ahmed, Syed Md. Khaled Rahman and Rubaba Rahman (2009), An Investigation Into The Customer Relationship Management Of Commercial Banks Of Bangladesh: A Comparative Study Among Nationalized, Private And Foreign Banks Asian Affairs, Vol. 31, No. 4 : 22-48, October-December, 2009
[2] Ajay Kumar Behera , Narayan C. Nayak And Harish C. Das 2013 Service Quality Of Banking Sectors Due To It Adoption Industrial Science, Vol 1, Issue 2/ Dec 2013 [3] Kavitha N (2012) An Insight Into Determinants Of Funds Management In Indian Scheduled Commercial Banks Zenith International Journal Of Business Economics & Management Research
[4] Ramanigopal C S , Mani A (2011), Customers‟ Perception Towards Service Quality Of The Commercial
Banks In Coimbatore City Asian Journal Of Business And Economics
[5] Sunil Kumar (2008) An Analysis Of Efficiency– Profitability Relationship In Indian Public Sector Banks Global Business Review
[6] Vinod Kumar (2013) Success Parameters Of Indian Commercial Banks Volume 2, Number 3, July – September‟ 2013
[7] Ashfaq Ahmad,Kashif-Ur-Rehman,Muhammad Iqbal Saif (2010) Islamic Banking Experience Of Pakistan:
Comparison Between
Islamic And Conventional Banks, International Journal Of Business And Management
[8] Umma Salma, Mir Abdullah Shahneaz (2013), Customer Satisfaction: A Comparative Analysis Of Public And Private Sector Banks In Bangladesh European Journal Of Business And Management
[9] Syed Ibrahim (2011) Operational Performance Of Indian Scheduled Commercial Banks-An Analysis International Journal Of Business And Management [10] Mahipal Singh Yadav (2011) Impact Of Non Performing Assets On Profitability And Productvity Of Public Sector Banks In India Afbe Journal
[11] Uma G. Gupta,William Collins (1997), The Impact Of Information Systems On The Efficiency Of Banks: An Empirical Investigation Industrial Management & Data Systems
[12] Ahmed J U (2010) Customer Orientation And Service Quality Of Commercial Banks: The Empirical Evidence From State Bank Of India International Journal Of Management
[13] Amarender Reddy A (2002), Banking Sector Performance During Liberalization In India-A Review M.P. Gupta And Sonal Shukla 2002 Learnings From Customer Relationship Management (CRM) Implementation In A Bank Global Business Review [14] Surabhi Singh,Renu Arora (2011) A Comparative Study Of Banking Services And Customer Satisfaction In Public, Private And Foreign Banks
[15] Jitendra Kumar Mishra (2009) Constituent Dimensions Of Customer Satisfaction: A Study Of Nationalised And Private Banks Revista Tinerilor Economi Ti
[16] Jayakumar.A, Sathiya.N A Study On Customer Relationship Management Practices In Banking Sector- With Reference To Salem District, Tamil Nadu, India Uppal (2011) E-Delivery Channels In Banks-A Fresh Outlook International Refereed Research Journal
[17] Kamini Rai (2012) Customer Relationship Management Practices In Banking Sector Of India: A Comparative Study A Journal Of Radix International Educational And Research Consortium