0163-4984186/100] —0065$02.20
Effects of Excess Dietary Selenite on
Lead Toxicity in Sheep
H. F.
MAYLAND,
L*
J. J.DOYLE,
2AND
R. P. SI-IARMA3US Department of Agriculture, Agricultural Research Service,
Kimberly, ID 83341; 2E1 Reno, OK 73036; and3 Toxicology Program, Utah State University, Logan, UT 84322
Received April 12, 1984; Accepted March 6, 1985
ABSTRACT
The hypothesis that excess dietary selenite ameliorates lead (Pb) toxicosis in domestic sheep was tested. Twenty 6-8-yr-old ewes fed alfalfa pellets were assigned to the following treatments: (1) control; (2) 9.8 mg Pb/kg body weight (b.w.)/d as PbCO 3; (3) 3 mg Se/anirnal/d as Na2Se03.5H20; or (4) a combination of treatments 2 and 3. The gelatin-encapsulated salts were given orally. The study was termi-nated on d 104, by which time three animals in the Pb group and all five animals in the Pb + Se group had died. All remaining animals were slaughtered on d 104. Lead and Se concentrations were deter-mined in six biweekly-collected blood samples and in soft tissues and bone. Sheep on the control and Se treatments had similar feed in-takes, body weights, and tissue Pb levels. Those in the Pb + Se group had lower feed intake, but higher blood Pb values compared with the Pb group. Feeding either element increased (P < 0.05) the concentra-tion of that element in blood, kidney, liver, spleen, and bone. Muscle-Pb concentrations were not affected (P < 0.05) by treatment. Selenium concentrations in kidney, liver, and muscle were greater (P
< 0.05), whereas those in heart were less (P < 0.05) for the Pb + Se group than for the Se Group. Clinical signs associated with Pb toxico-sis noted in other animals were not observed in the poisoned sheep in this study. Selenite did not protect sheep against Pb toxicity and likely served as a synergistic factor.
index Entries: Alfalfa pellets; blood; bone; kidney; lead; liver; muscle; ovine; selenium; sheep; spleen.
*Author to whom all correspondence and reprint requests should be addressed.
66 Mayland, Doyle, and Sharma
INTRODUCTION
The toxicity of lead (Pb) to animals may be reduced by the presence of other minerals, especially calcium (Ca) in the diet (1). Selenium, as so-dium selenite, was mildly protective against the toxic effects of Pb, as the acetate, but only up to 0.5 ppm Se (2). At higher sodium selenite levels, a synergistic effect of lead acetate toxicity was observed.
Others (4) have shown that lead (5 and 25 ppm) as the acetate antag-onizes selenium (1 ppm) in the organic forms in which it occurs normally in foods; low levels of lead (5 ppm) in this case produced high mortality among female mice thus exposed. The following study was initiated to determine whether a high, but not lethal, level of dietary selenite was protective against Pb toxicosis in domestic sheep. These results provided evidence that this level of selenite-Se increased rather than decreased Pb
toxicosis in sheep under the experimental conditions employed.
METHODS
Mixed breed ewes, 6-8 yr old and having an average body weight of 63 kg, were allotted by weight into four treatment groups of five sheep each. Treatments were as follows: (1) control, no supplements; (2) daily supplements of 9.8 mg Pb/kg body wt (b.w.)/d; (3) 3 mg Se/animalld; (4) 9.8 mg Pb/kg b. w./d plus 3 mg Se/animalld. Lead as PbCO 3 and Se as Na2Se03 .5H20 were administered orally in gelatin capsules immediately
before feeding. Sheep in group 1 did not receive a placebo capsule. Each animal was weighed weekly and the amount of Pb administered to sheep in groups 2 and 3 was adjusted weekly. Lead levels were chosen to pro-duce acute toxicosis in sheep within 6-10 weeks, whereas the Se levels were chosen to be high, but not lethal (1). The study was to continue un-til all sheep in any given treatment group had died.
All sheep had free access to water and NaCI and were group fed, by treatment, alfalfa pellets (1.6 kg/animalld) that had the following approxi-mate dry matter analysis: 25 mg N/g, 25 mg K/g, 2.7 mg Mg/g, 20 mg Ca/g, 1.6 mg P/g, 600 vg Na/g, 30 p.,g Mn/g, 200 lig Fe/g, 9 Cu/g, 20 lig Zn/g, 5.4 j_tg Pb/g, and 0.4 Se/g. Feed was offered once daily and arts were weighed periodically to calculate feed intake.
Blood was collected at the beginning of the experiment and at about 2-wk intervals thereafter for 64 d. Samples of liver, kidney, spleen, heart, bone, and skeletal muscle were obtained from the sheep that died during the study and from the remaining sheep when they were slaughtered on d 104.
Whole blood, homogenized soft tissues, and defatted bone were freeze-dried. Selenium was determined fluorometrically (6) and Pb was determined by flameless atomic absorption using the method of standard
additions (7). A national Bureau of Standards (NBS) bovine liver sample was analyzed with each set of Pb samples. The overall mean of the NBS
sample was 0.38 ± 0.02 ps Pb/g compared with the certified value of 0.34 ± 0.08 lig Pb/g. Recovery of 0.10 p.g Pb additions to tissue samples prior to digestion ranged from 92 to 110 percent. Copper, iron, and zinc in freeze-dried whole blood were determined by flame atomic absorption after digestion in HNO3/HC104.
Whole blood was analyzed for urea nitrogen (BUN) and serum was analyzed for Ca, glucose, a-amylase, aspartate aminotransferase (AST), glutamate pyruvate transaminase (SGPT), lactate dehydrogenase (LDH), and creatine kinase (CK) using a Clinicard Analyzer, model 368. Serum inorganic phosphorus was analyzed by a colorimetric phosphomoly-bdate procedure (8). Whole blood was characterized for red cells (RBC), white cells (WBC), neutrophils, lymphocytes, monocytes, eosinophils, and hemoglobin (Hb) by the Hycell 300 cell counter. Blood hematocrit was also determined.
Mineral data for soft tissues and bone were subjected to least squares analysis of variance followed by Duncan's new multiple range test to ascertain differences among treatments (9). Blood chemistry data were analyzed by linear regression techniques, without transformation, and the difference between regression coefficients (rate of change = b)
was evaluated by the t-test (10).
RESULTS
Feed Intake
Sheep on the control and Se treatments readily ate the 8.0 kg feed (1.6 kg/animal/d) offered daily to each group. The Se-supplemented ani-mals always appeared hungry and fought aggressively for the feed. Feed consumption by animals in the Pb and Pb + Se groups varied through-out the study (Fig. 1). After d 57, sheep on the Pb + Se treatment showed considerable inappetence.
Body Weight Changes
The mean body weight of the sheep at the beginning of the experi-ment was 63 kg (Fig. 2). During the first 30 d of the experiexperi-ment, before any sheep died, the control and Se-treated sheep maintained their weight, whereas the Pb treated and Pb + Se treated sheep lost an aver-age of 0.17 kg/animal/d. After d 50, sheep on the control and Se treat-ments gained 0.12 kg/animal/d for the remainder of the study. Two sheep on the Pb treatment gained up to 3 kg during the remaining
pe-riod, but these gains were generally offset by weight losses of other sheep in the group. The animal in the Pb + Se group that died on d 104
68 Mayland, Doyle, and Sharma
20
Lu Control and Se Sheep
'>, 1.5
0
Z - ;
L-;
A ! ;
A
Pb
A
cc 47$
g
1.0>-cc a
0.5-;Pb + Se p n ri
ir
t
4. ,
n40 60 80 100
DAYS
Fig. 1. Running 5-d mean dry matter intake by sheep. Death of sheep is indicated by a chevron (Pb group) or an arrow (Pb + Se).
had a net gain of 2 kg b.w. for the entire experimental period, but the other four animals lost weight from the beginning of the study until they died. Bodyweight changes were not related to body weights at the begin-ning of the study.
Fig. 2. Group Live weight of sheep. Death of sheep in indicated by a chev-ron (Pb group) or an arrow (Pb + Se).
0 20
Pb + Se
x Se 0 Control
60 0
TIME, days
20 40 20 40 60
Death Losses
None of the animals in the control or the Se groups died during the experiment. However, three sheep in the Pb group and all five animals in the Pb + Se group died during the 104 d study (Figs. 1 and 2).
Blood and Tissue Se
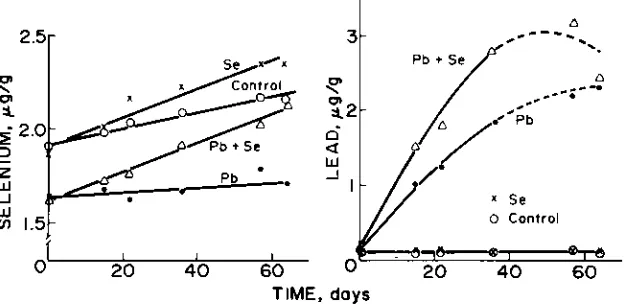
Whole blood Se concentrations (Fig. 3) increased 4.2, 7.5, 7.9, and 0 ng/g/d for sheep on the control, Se, Pb + Se, and Pb treatments, respec-tively. The rates for the Se and Pb + Se groups were not different (P <
0.2) from each other, but were greater (P < 0.01) than that for the control group, which in turn was greater (P < 0.06) than that for the Pb treat-ment. Blood Se values at the beginning of the experiment were greater (P
= 0.06) for animals assigned to the control and Se treatments than for those assigned to the Pb and Pb + Se treatments. Although these initial differences may be real, they do not negate the rate of change occurring in response to diet.
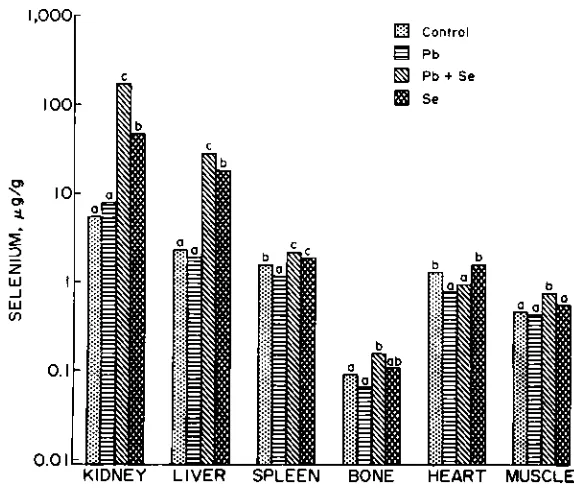
Selenium concentrations in kidney, liver, spleen, and bone were greater (P < 0.05) in animals receiving the Pb + Se and Se treatments than for those on the control or Pb treatments (Fig. 4). The Pb treatment, reduced (P < 0.05) Se concentrations in spleen and heart when compared with similar tissues in the control group. The Pb + Se group had higher
(P < 0.05) concentrations of Se in kidney, liver, and muscle and lower (P
< 0.05) concentrations in heart when contrasted with similar tissue con-centrations in the Se treatment.
The Se concentrations in tissues of the eight animals dying during the experiment were regressed on the number of days on trial prior to death. The only significant (P < 0.05) changes were Se increases in kid-ney, spleen and heart of 1.71, 0.0067, and 0.0023 it g/g/d, respectively, for
Fig. 3. Mean Se and Pb concentrations in freeze-dried whole blood of sheep.
70 frlayland, Doyle, and Sharma
DI Control
M Pb
El Pb + Se Se
0
KIDNEY LIVER SPLEEN BONE HEART MUSCLE
Fig. 4. Mean Se concentrations in freeze-dried tissues and defatted bone of sheep. Treatment Se concentrations, within a given tissue, that do not share a small letter are different (P < 0.05).
animals in the Pb + Se group. The 95% confidence intervals (0.95 Cl) for these regression coefficients were 0.35, 0.00001, and 0.000004 Kg Se/g/d, respectively.
Blood and Tissue Pb
Lead concentrations in whole blood did not differ between the con-trol and Se groups (Fig. 3). The Pb concentrations averaged 0.1 Kg/g and did not change during the 64-d sampling period.
However, in the Pb and Pb + Se groups, blood Pb values increased linearly at a rate of 0.05 and 0.09 Kg/g/d during the first 37 d, respectively.
The rate of change was greater (P < 0.01) for the Pb + Se group than for the Pb group. The additive effect of the Se in the Pb + Se diet continued through d 57 (P < 0.03), but was not different than the Pb only group on d 64. Blood Pb values for the Pb + Se group and even the Pb group ap-pear curvilinear, but regression of the quadratic (a + bt + ct2) form did not improve the correlation in either case. The apparent curvilinear re-sponse of blood Pb values in the two Pb groups may have been con-firmed if sampling had continued beyond 64 d and sheep numbers were maintained.
Lead concentrations in kidney, liver, spleen, and bone were not dif-ferent between the Pb and Pb + Se groups (Fig. 5), but values were
b b b
10,000-1,000 ==
Control
Pb Pb * Se Se
100
N
a_
EN 1
_J 0
KIDNEY LIVER SPLEEN BONE HEART MUSCLE
Fig. 5. Mean Pb concentrations in freeze-dried tissue and defatted bone of sheep. Lead concentrations, within a given tissue, that do not share a small letter are different (P < 0.05).
larger (P < 0.05) than those measured in the non-Pb groups. Muscle-Pb concentrations were not different (P < 0.05) for the treatments evaluated in this study. Periodic deaths of three sheep in the Pb and five sheep in the Pb + Se group provided an assessment of Pb accumulation with time. Bone-Pb concentrations increased 0.26 ligig,/d (0.95 Cl = 0.0003) in these eight sheep. Lead accumulations in the soft tissue were not time-related.
Blood Chemistry
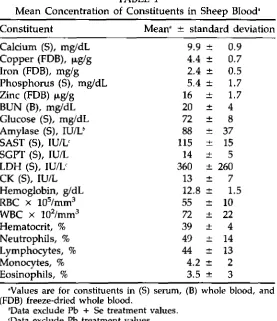
Blood chemistry values for each of the treatment groups were re-gressed against time. Only three of these relationships were significantly different from zero (P < 0.1). The Pb treatment increased the serum AST values by 3.8 U/d (0.95 Cl = 2.5) and the serum LDH values by 9 U/d (0.95 Cl = 11). These two enzymes move easily from body tissue and increased serum levels are generally not tissue specific. The Pb + Se treatment increased the serum amylase values by 1.0 U/d (0.95 Cl = 0.025). Elevated levels of these enzymes are often indicative of liver, kid-ney, pancreas, and muscle damage (11). Mean blood chemistry values
are shown (Table 1), except that values for treatment responses of serum AST and LDH in the Pb-treatment group and amylase values in the Pb + Se treatment group were omitted.
72 Mayland, Doyle, and Sharma
TABLE 1
Mean Concentration of Constituents in Sheep Blood'
Constituent Mean' ± standard deviation
Calcium (5), mg/dL 9.9 ± 0.9
Copper (FDB), p.,g/g 4.4 ± 0.7
Iron (FDB), mglg 2.4 ± 0.5
Phosphorus (S), mg/dL 5.4 ± 1.7
Zinc (FDB) Rg/g 16 ± 1.7
BUN (B), mg/dL 20 ± 4
Glucose (5), mg/dL 72 ± 8
Amylase (5), IU/12 88 ± 37
SAST (5), IU/1; 115 ± 15
SGPT (S), IU/L 14 ± 5
LDH (5), IU/L 360 ± 260
CK (5), IU/L 13 ± 7
Hemoglobin, g/dL 12.8 ± 1.5
RBC x 105/mm3 55 ± 10
WBC x 102/mm3 72 ± 22
Hematocrit, % 39 ± 4
Neutrophils, % 49 ± 14
Lymphocytes, % 44 ± 13
Monocytes, % 4.2 ± 2
Eosinophils, % 3.5 ± 3
'Values are for constituents in (5) serum, (B) whole blood, and (FDB) freeze-dried whole blood.
Data exclude Pb + Se treatment values. `Data exclude Pb treatment values.
DISCUSSION
The depressive effects of Pb on feed intake and body weight meas-ured in this study have been observed in many species (1). However, in another study, Pb (as lead acetate) at concentrations of up to 1000 lig/g in a practical diet fed to young lambs for 84 d did not affect feed consump-tion, weight gain, or the feed conversion ratio (12). Their diet, assuming 1.3 kg dry matter intake by 36 kg lambs, provided a Pb intake of 36 mg/kg b.w., which is 3.6 times the level administered to the adult sheep in this study. Young animals are more sensitive to Pb toxicosis than are mature adults (1), but possibly these 36 kg lambs should not be considered as young animals. Dietary Ca concentrations were also higher in our study than for the lambs (2.0% vs estimated 0.14% Ca), which should have re-versed the Pb effects on those two classes of sheep. Practical diets were used in both studies, although the lambs were fed a high concentrate ra-tion and they were offered 10% more feed than was consumed the previ-ous day. The Pb was mixed in the feed for the lambs, whereas it was pro-vided in an encapsulated dose in this study. The dosing treatment may
have aggravated the toxicity effects of Pb. Differences in the Pb source may also have been a factor.
The weight loss by these adult sheep may have been a direct effect of reduced dietary intake, an indirect effect of Pb on animal metabolism, or both.
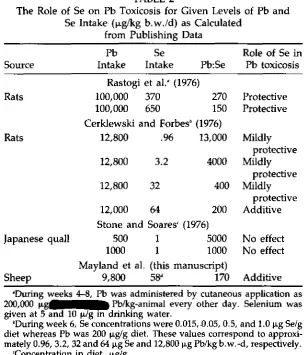
Selenium, as the selenite has been shown to protect against Pb toxi-cosis in some cases (2,3). Yet, in other cases Se had no effect (5) or in-creased Pb toxicosis (2), which was also demonstrated in this study. The confusion associated with this interaction of Se with Pb is not readily ex-plained by intake rates of either Pb or Se, nor by the ratio of the two (Ta-ble 2). Perhaps in our study the daily intake of 3.6 mg Se/animalld (2.2 lig Se/g diet for animals eating the 1.6 kg allowance) was excessive, and an intake of 1 mg Se/animal might have been more appropriate. Se was mildly protective (2) against the toxic effects of Pb only up to 0.50 pg
TABLE 2
The Role of Se on Pb Toxicosis for Given Levels of Pb and Se Intake ( Kg/kg b.w./d) as Calculated
from Publishing Data
Source
Pb Se
Intake Intake Pb: Se
Role of Se in Pb toxicosis
Rastogi et al.' (1976)
Rats 100,000 370 270 Protective
100,000 650 150 Protective
Cerklewski and Forbes' (1976)
Rats 12,800 .96 13,000 Mildly
protective
12,800 3.2 4000 Mildly
protective
12,800 32 400 Mildly
protective
12,000 64 200 Additive
Stone and Soares' (1976)
Japanese quail 500 1 5000 No effect
1000 1 1000 No effect
Mayland et al. (this manuscript)
Sheep 9,800 58' 170 Additive
'During weeks 4-8, Pb was administered by cutaneous application as 200,000 'LAMM" Pb/kg-animal every other day. Selenium was given at 5 and 10 pig in drinking water.
'During week 6, Se concentrations were 0.015,1).05, 0.5, and 1.0 Se/g
diet whereas Pb was 200 lig/g diet. These values correspond to
approxi-mately 0.96, 3.2, 32 and 64 pg Se and 12,800 Pb/kg b.w.-d, respectively.
`Concentration in diet, µ.g/g.
'The value is calculated as 0.64 mg Se from 1.6 kg alfalfa plus 3 mg sup-plementary Se per 63 kg sheep.
74 Mayland, Doyle, and Sharma
Se/g. At higher Se concentrations, an exaggeration of Pb toxicosis was observed. Although the source of supplemental Pb and Se will be a factor in determining availability, the ratio of absorbed Pb to absorbed Se may be more important and meaningful than the Pb/Se intake. It is well estab-lished that mineral absorption varies between animals species and be-tween young and adult animals (1). Because delta-aminolevulinic acid derydratase (ALAD) activity in tissue is a useful parameter in the study of Pb toxicosis and Pb–Se interactions, it is unfortunate that its activity was not measured in blood and soft tissue in this study.
The additions of both Se and Pb to the diet resulted in higher con-centrations of Pb and Se in some tissue than when either element was fed alone (refs. 3 and 4, and this study). However, Se levels in some soft
tis-sue were decreased by the interactive effects of Pb and Se (refs. 2 and 4,
and this study). The results of dietary Pb and Se on tissue levels of these two elements must be related to the absolute levels of soluble Pb, Se, and other interactive elements, and the proteins and or chelating agents in the diet or in the gastrointestinal tract.
The data in this study clearly illustrate that Se increased the toxicity of Pb when fed to sheep at the rate of 3 mg Se/animal/d and 9.8 mg Pb/kg b.w./d, respectively. Hence, a protective effect of Se against Pb toxicity is not confirmed by this research.
ACKNOWLEDGMENTS
Our appreciation is given to J. Linaweaver and J. Rich for their assist-ance in the animal work, and to Arlene Florence, John Manwaring, and R. C. Rosenau for their help in mineral analysis.
Mention of a trademark or proprietary product does not constitute a guarantee of warranty of the product by the US Department of Agricul-ture and does not imply its approval to the exclusion of other products that may also be suitable.
REFERENCES
I. National Research Council, Mineral Tolerance of Domestic Animals, National Academy of Sciences, Washington, DC, 1980, pp. 256-276, 392-420.
2. F. L. Cerklewski and R. M. Forbes, I. Nutr. 106, 778 (1976).
3. S. C. Rastogi, J. Clausen, and K. C. Srivastava, Toxicology 6, 377 (1976). 4, G. N. Schrauzer, K. Kuehn, and D. Hamm, Biol. Trace Element Res. 3, 185
(1981).
5. C. L. Stone and J. H. Soares, Poultry Sci. 55, 341 (1976).
6. 0. E. Olson, I. S. Palmer, and E. E. Cary, J. Assoc, Off. Anal. Chem, 58, 117
(1975).
7. R. P. Sharma, J. C. Street, J. L. Shupe, and D. R. Bourcier, J. Dairy Sci. 65,
972 (1982).
8. J. A. Daly and G. Ertingshausen, Clint. Chem. 18, 263 (1972).
9. W. R. Harvey, US Department Agriculture, Agricultural Research Service 20-8, 1960.
10. R. G. Steel and J. H. Torrie Principles and Procedures of Statistics,
McGraw-Hill, New York, 1960, pp. 173 and 334.
11. J. J. Kaneko, in Clinical Biochemistry of Domestic Animals, 3rd ed., Academic
Press, New York, 1980, pp. 184-235.
12. K. R. Fick, C. B. Ammerman, S. M. Miller, C. F. Simpson, and P. E. Loggins, J. Animal Sci. 42, 515 (1976).
13. D. S. Pearl, S. B. Ammerman, P. R. Henry, and R. C. Littell, J. Animal Sci.
56, 1416 (1983).
14. K. R. Mahaffey, in Lead Toxicity, R. L. Singhal and J. A. Thomas, eds., Urban and Schwarzenberg, Baltimore, 1980, pp. 425-460.
15. S. A. Meyer, W. A. House, and R. M. Welch, J. Nutr. 112, 954 (1982).
16. P. K. Ku, E. R. Miller, R. C. Wahlstrom, A. W. Groce, J. P. Hitchcock, and D. E. Ullrey, J. Animal Sci, 37, 501 (1973).
17. K. T. Mandisodza, W. G. Pond, D. J. Lisk, D. E. Hogue, L. Krook, E. E. Cary, and W. H. Gutenmann, J. Animal Sci., 49, 535 (1979).