279
Volume-4, Issue-1, February-2014,
ISSN No.: 2250-0758
International Journal of Engineering and Management Research
Available at:
Page Number: 279-284
A Metrics Set for Reusability Based Quality Framework for Software
Components
Simrandeep Singh Thapar1, Paramjeet Singh2, Shaveta Rani3 1
Research Scholar, Punjab Technical University, Kapurthala, Punjab, INDIA 2,3
Department of Computer Science & Engineering, GZS PTU Campus Bathinda, Punjab, INDIA
ABSTRACT
Reusability is the most important factor which cannot be ignored when practicing component based software development since it offers many advantages like improved productivity, cycle time and quality. Reusability and quality are proportional to each other as a high quality component is definitely reusable and vice versa. The quality is a subjective issue which is difficult to measure objectively. In this paper, we proposed a metrics set to evaluate the quality or reusability of black box software components. The scales of metrics are so chosen that are capable of easily grasping the behavior of components in order to measure the quality worth. The results are found highly significant when validated with Pearson correlation method.
Keywords— Quality metrics, Reusability, Reusability
based quality framework (RQF), Software component.
I.
INTRODUCTION
A software component can be used repeatedly in diverse or similar domains to create new software, provided it has a property of high reusability. The components are re(used) mainly to cut development costs and development time with additional benefit of being high quality since these are already tried and tested [1, 2]. The reusability worth of any component can be established by evaluating it using any mathematical technique. Generally, software quality metrics are taken as a suitable solution to quantitatively assess the component’s quality or reusability [3].
Quality is defined as a totality of features or characteristics of a product that bears on its ability to satisfy the given needs or expectations of a customer or user [4, 5]. Quality is often desired and assessed by its stakeholders. So, it is customary to involve them in the evaluation process. Although, the quality is a subjective issue, still there are methods like metrics which can measure it quantitatively. The metrics are the only method
(though, other methods work in conjunction with metrics) through which the stakeholders (persons) get the confidence in the software by assessing it. In fact, quality is one of the most important factors for assessing the global competitive position of a software company [4].
Humans estimate the quality in a subjective manner whereas metrics are used to judge the attributes of something in an objective and quantitative manner [5]. In other words, a metric is a quantitative measure of the degree to which a system, a process or a component possesses an attribute [1]. Software metrics are used for measurement of software product or project’s different functional or quality aspects. Metrics are a method which one can use to estimate, track, improve, control, predict, and get feedback of the software product or project in order to be able to make good decisions, to control or improve the quality, to measure effectiveness and to increase productivity and added confidence to the stakeholders.
We proposed a metrics set as a part of reusability based quality framework (RQF) that comprises a component quality model (CQM), and an evaluation technique(s) to assess the quality and reusability of software components. The quality model is used to evaluate the quality of component where quality is directly proportional to reusability. Quality is a critical aspect of the software development and especially in the component based software development, since for a high quality system it must be having high quality components. Single low quality component may prove fatal to the whole software [2]. So, quality of the individual components must be given high priority to increase the reliability and reusability of the end product [6].
280
significance of quality metrics in order to assess the blackbox components which otherwise won’t be possible to assess quantitatively. The applicability of the proposed metrics set is demonstrated through website components followed by validation of the results.
II.
LITERATURE REVIEW
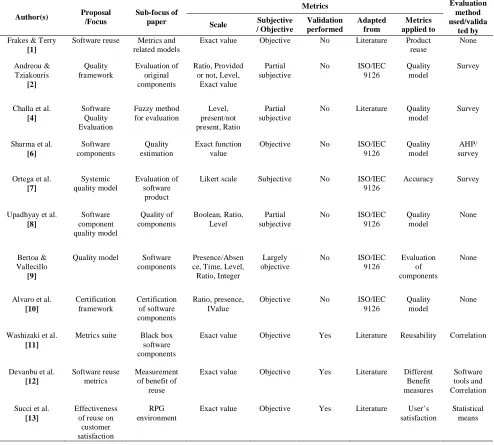
It has been customary to quantify the quality of software or software components using metrics. It is reflected through numerous research studies falling in the line of or related to the software metrics. Each study put across a different aspect of software or software components’ evaluation using metrics for usability, maintainability, reusability, functionality, efficiency,
reliability, security, risk etc. Table I depicts the comparative relationship of some of the major studies which used or proposed metrics. It shows different perspectives of metrics such as scale, validation, origin and applicability. The scales of metrics significantly affect the final results. If the metrics are calculated from Likert scale then the results would be based on subjective perceptions of respondents, if exact number is computed from actual function value then the result is calculated objectively.
Building upon these studies, we tried to propose a comprehensive metrics set for black box software components. These metrics may be used to evaluate the quality of components that indirectly may be used to compute the reusability of components.
TABLE I
COMPARATIVE RELATIONSHIP OF STUDIES RELATED TO THE METRICS
Author(s) Proposal /Focus
Sub-focus of paper
Metrics Evaluation
method used/valida
ted by Scale Subjective
/ Objective Validation performed Adapted from Metrics applied to
Frakes & Terry
[1]
Software reuse Metrics and
related models
Exact value Objective No Literature Product
reuse None Andreou & Tziakouris [2] Quality framework Evaluation of original components Ratio, Provided or not, Level,
Exact value
Partial subjective
No ISO/IEC
9126
Quality model
Survey
Challa et al.
[4] Software Quality Evaluation Fuzzy method for evaluation Level, present/not present, Ratio Partial subjective
No Literature Quality
model
Survey
Sharma et al.
[6] Software components Quality estimation Exact function value
Objective No ISO/IEC
9126
Quality model
AHP/ survey
Ortega et al.
[7] Systemic quality model Evaluation of software product
Likert scale Subjective No ISO/IEC
9126
Accuracy Survey
Upadhyay et al.
[8] Software component quality model Quality of components Boolean, Ratio, Level Partial subjective
No ISO/IEC
9126 Quality model None Bertoa & Vallecillo [9]
Quality model Software
components
Presence/Absen ce, Time, Level,
Ratio, Integer
Largely objective
No ISO/IEC
9126
Evaluation of components
None
Alvaro et al.
[10] Certification framework Certification of software components Ratio, presence, IValue
Objective No ISO/IEC
9126
Quality model
None
Washizaki et al.
[11]
Metrics suite Black box
software components
Exact value Objective Yes Literature Reusability Correlation
Devanbu et al.
[12]
Software reuse metrics
Measurement of benefit of
reuse
Exact value Objective Yes Literature Different
Benefit measures
Software tools and Correlation
Succi et al.
[13]
Effectiveness of reuse on
customer satisfaction
RPG environment
Exact value Objective Yes Literature User’s
satisfaction
281
III.
CONTEXT OF USE OF METRICS
Metrics as used to track, evaluate, improve, control, predict and give feedback of software or software components. There is a significant diversity in the metrics collected for one project to another [14]. Since, it depends upon the expertise of team, the type of project and the type of technology to be implemented. Also, different categories of metrics are required for different type of projects, products or processes.
Software metrics are categorized as white box and black box to assess internal and external attributes of software. There are white box metrics like defects per KLOC for correctness, MTTC for maintainability, LOC or FP for size. Black box metrics depends upon the external factors and behavior of software or software components like response time and throughput are used to measure performance. Metrics may also be categorized as functional and extra-functional (quality) metrics based on the parameter under consideration. The functional metrics assess working aspect or functionality of software or component which is related to its accuracy, security etc. The quality metrics assess the quality aspect of software or component which is often measured subjectively such as its maturity, learnability, testability etc. Metrics may be direct or indirect, in other words, their values may be evaluated directly or indirectly. LOC is a direct metric whereas effort is an indirect metric.
a. Black Metrics vs. White Metrics
White box metrics are used to measure the internal attributes of software that is the coding of software for example defects per KLOC, LOC, function points. These are used by software developing organization to evaluate the quality of code they have produced.
On the other hand, black box metrics are used to measure the external attributes of software since the source code is inaccessible. Here, functionality of software is assessed by testing it with the experimental data similar to the actual data. These metrics may be used by parent software organization or by third party to assess the behaviour of software.
Both types of metrics are essential to assess and uncover the real state of software, using it one can assert the quality of the concerned software or software component. If software or component is purchased by another company then that company may apply both white and black box metrics to the software or component. If it is purchased as a black box package then only black box metrics can be applied to assess its quality.
b. Measurement Scale
There are many methods (scale) which are used to calculate the value of a metric. Each having its implication such as ratio of metrics may be used to measure the direct value or indirect value of attribute. Presence/absence measurement indicates the existence of an attribute. Level/range measurement method is used when attribute’s value can’t be determined directly that is its exact value falls in between the levels or ranges. Exact value measurement is used to compute the exact value of attribute directly or indirectly.
The measurement methods like present/absent and ratio or exact value method is more promising as it gives the exact value of attributes. While other methods are not precise, accurate and quantitative, hence their results are not reliable to depend upon. However, their application cannot be neglected in the absence of relevant data or attributes where other methods can’t be applied.
IV
PROPOSED METRICS
As indicated in Table II, we proposed a set of 32 quality metrics to evaluate the quality or reusability of black box components. This metric set is defined for attributes of component quality model which is the basic building block of reusability based quality framework (RQF). These metrics are of present (1) / absent (0), level (0, 0.5, 1) and ratio nature and their outcome is normalized in the range of 0 to 1. If the value is 1, the component has that feature completely, 0.1 to 0.9 means partial and 0 means non-availability of the feature.
The rationale behind choosing these metric scales (present/absent, ratio, level) is that black box component does not provide any internal details so evaluator or buyer has to assess it from the available specification details or by evaluating its demo version. The proposed metrics set is very easy to calculate the black box components since respondents are not offered ordinal scale for metric estimation. The evaluator’s responses will be according to the actual state of a component’s quality. The scale like absent or present will present the actual picture, similarly, ratio is calculated from actual parameters of the component under testing and level scale is also taken in a form that is suitable for grasping near accuracy of results. In this model, we have incorporated only those characteristics, sub-characteristics and attributes which are proved statistically important for reusability. Their importance with regard to components can be studied from the literature of [2, 4, 6-10].
TABLE II
PROPOSED COMPONENT QUALITY MODEL
Characteristics Sub-characteristics Attributes Metrics
Functionality (C1) Security (SC 1.1) Access control (A 1.1.1) Present / Absent
Encryption (A 1.1.2) Present / Absent
282
functions
Suitability (SC 1.3) Completeness (A 1.3.1) = no. of functions provided / no. of functions
required
User-Satisfaction (A 1.3.2) Level [0-not satisfied, 0.5-average,
1-satisfied]
Reliability (C2) Recoverability (SC 2.1) Restore Point (A 2.1.1) Present / Absent
Fault-tolerance (SC 2.2) Error-handling (A 2.2.1) Present / Absent
Availability (A 2.2.2) = uptime/uptime + downtime
Maturity (SC 2.3) Versions Released (A 2.3.1) Present / Absent
Usability (C3) Learnability (SC 3.1) Time to learn (A 3.1.1) Level [0-longer than average, 0.5-average,
1-less than average]
Time to administer (A 3.1.2) Level [0-longer than average, 0.5-average,
1-less than average]
Time to customize (A 3.1.3) Level [0-longer than average, 0.5-average,
1-less than average]
Operability (SC 3.2) Operating effort (A 3.2.1) Level [0-longer than average, 0.5-average,
1-less than average]
Administer effort (A 3.2.2) Level [0-longer than average, 0.5-average,
1-less than average]
Customizing effort (A 3.2.3) Level [0-longer than average, 0.5-average,
1-less than average]
Understandability (SC 3.3) Documentation (A 3.3.1) Level [0-no documentation,
0.5-documentation not understandable, 1-documentation understandable] International language support (A
3.3.2)
Level [0-one language, 0.5-english and any other language, 1- popular languages supported]
Demonstration/Training (A 3.3.3) Level [0-not provided, 0.5-provided but not adequate, 1- Provided and adequate]
Efficiency (C4) Time efficiency (SC 4.1) Throughput (A 4.1.1) Level [0-longer than average, 0.5-average,
1-less than average]
Response time (A 4.1.2) Level [0-longer than average, 0.5-average,
1-less than average]
Resource efficiency (SC 4.2) Memory utilization (A 4.2.1) Level [0-more than 50% memory occupied,
0.5-between 10-50% memory occupied, 1- less than 10% memory occupied]
Processor utilization (A 4.2.2) Level [0-CPU free upto 25%, 0.5- CPU free upto 25-80%, 1- CPU free more than 80%]
Disk utilization (A 4.2.3) Level [0-more space occupied with respect to
total software, 0.5-average space occupied, 1- very less space occupied]
Maintainability (C5) Testability (SC 5.1) Test material (A 5.1.1) Level [0-not provided, 0.5-provided but not
adequate, 1- provided and adequate]
Proof of test (A 5.1.2) Present / Absent
Replaceability (SC 5.2) Backward-compatibility (A 5.2.1) Present / Absent
Portability (C6) Deployability (SC 6.1) Complexity (A 6.1.1) Level [0-complex, 0.5-average, 1- easy]
Documentation (A 6.1.2) Present / Absent
Interoperability (SC 6.2) Hardware compatibility (A 6.2.1) Level [0-more than 2 constraints, 0.5- less than 2 constraints, 1- no constraints]
O.S. Compatibility (A 6.2.2) Level [0-compatible with only 1 O.S.,
0.5-compatible with more than 1 O.S. but less than 3, 1- no constraints]
Software Compatibility (A 6.2.3) Level [0-more than 2 constraints, 0.5- less than 2 constraints, 1- no constraints]
Adaptability (SC 6.3) Adjustability (A 6.3.1) Level [0-doesn’t adjust, 0.5-adjust with minor
settings, 1- automatically adjust]
V.
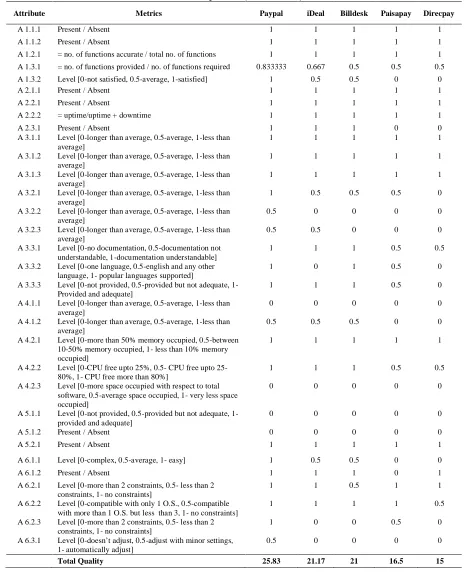
APPLICATION OF METRICS
The proposed metrics set is applied to the attributes of payment gateway components to determine their quality or reusability which is essential for their selection. We chose Paypal, iDeal, Billdesk, Paisapay and
283
(15). We suggest that any component with quality value less than 60% should not be considered for reuse.TABLE III
RESULTS OF COMPONENTS QUALITY (REUSABILITY) USING METRICS
Attribute Metrics Paypal iDeal Billdesk Paisapay Direcpay
A 1.1.1 Present / Absent 1 1 1 1 1
A 1.1.2 Present / Absent 1 1 1 1 1
A 1.2.1 = no. of functions accurate / total no. of functions 1 1 1 1 1
A 1.3.1 = no. of functions provided / no. of functions required 0.833333 0.667 0.5 0.5 0.5
A 1.3.2 Level [0-not satisfied, 0.5-average, 1-satisfied] 1 0.5 0.5 0 0
A 2.1.1 Present / Absent 1 1 1 1 1
A 2.2.1 Present / Absent 1 1 1 1 1
A 2.2.2 = uptime/uptime + downtime 1 1 1 1 1
A 2.3.1 Present / Absent 1 1 1 0 0
A 3.1.1 Level [0-longer than average, 0.5-average, 1-less than average]
1 1 1 1 1
A 3.1.2 Level [0-longer than average, 0.5-average, 1-less than average]
1 1 1 1 1
A 3.1.3 Level [0-longer than average, 0.5-average, 1-less than average]
1 1 1 1 1
A 3.2.1 Level [0-longer than average, 0.5-average, 1-less than average]
1 0.5 0.5 0.5 0
A 3.2.2 Level [0-longer than average, 0.5-average, 1-less than average]
0.5 0 0 0 0
A 3.2.3 Level [0-longer than average, 0.5-average, 1-less than average]
0.5 0.5 0 0 0
A 3.3.1 Level [0-no documentation, 0.5-documentation not understandable, 1-documentation understandable]
1 1 1 0.5 0.5
A 3.3.2 Level [0-one language, 0.5-english and any other language, 1- popular languages supported]
1 0 1 0.5 0
A 3.3.3 Level [0-not provided, 0.5-provided but not adequate, 1- Provided and adequate]
1 1 1 0.5 0
A 4.1.1 Level [0-longer than average, 0.5-average, 1-less than average]
0 0 0 0 0
A 4.1.2 Level [0-longer than average, 0.5-average, 1-less than average]
0.5 0.5 0.5 0 0
A 4.2.1 Level [0-more than 50% memory occupied, 0.5-between
10-50% memory occupied, 1- less than 10% memory occupied]
1 1 1 1 1
A 4.2.2 Level [0-CPU free upto 25%, 0.5- CPU free upto 25-80%, 1- CPU free more than 80%]
1 1 1 0.5 0.5
A 4.2.3 Level [0-more space occupied with respect to total software, 0.5-average space occupied, 1- very less space occupied]
0 0 0 0 0
A 5.1.1 Level [0-not provided, 0.5-provided but not adequate, 1- provided and adequate]
0 0 0 0 0
A 5.1.2 Present / Absent 0 0 0 0 0
A 5.2.1 Present / Absent 1 1 1 1 1
A 6.1.1 Level [0-complex, 0.5-average, 1- easy] 1 0.5 0.5 0 0
A 6.1.2 Present / Absent 1 1 1 0 1
A 6.2.1 Level [0-more than 2 constraints, 0.5- less than 2 constraints, 1- no constraints]
1 1 0.5 1 1
A 6.2.2 Level [0-compatible with only 1 O.S., 0.5-compatible with more than 1 O.S. but less than 3, 1- no constraints]
1 1 1 1 0.5
A 6.2.3 Level [0-more than 2 constraints, 0.5- less than 2 constraints, 1- no constraints]
1 0 0 0.5 0
A 6.3.1 Level [0-doesn’t adjust, 0.5-adjust with minor settings, 1- automatically adjust]
0.5 0 0 0 0
Total Quality 25.83 21.17 21 16.5 15
VI.
VALIDATION OF METRICS
Nonetheless, alone metric’s outcomes may not be utilized to take decision since their value depends on
284
method at different intervals of time by differentevaluators to check the correlation and hence the validity between results we obtained earlier. Positive correlation
(0.997) indicates that our results are valid and the metrics are reliable [7].
TABLE IV
VALIDATATION OF METRICS
Interval Paypal iDeal Billdesk Paisapay Direcpay Pearson correlation
T1 25.83 21.17 21 16.5 15
0.997**
T2 24 21 20.87 17.02 16.29
**. Correlation is significant at the 0.01 level (2-tailed).
VII.
CONCLUSION
The quality or reusability of software can be measured with many methods but appropriate and effective method is measurement with metrics. Metrics give crisp numerical results that are reliable and helps in decision making. We, in this paper have proposed the metrics set for component quality model of reusability based quality framework. We have picked metrics to evaluate black box components, accordingly, their scales are chosen appropriately. Computed quality of different components also indicates the reusability value of each component. The more the value of a component, the more is its reusability. The calculated results are validated using the correlation method. The correlation value is highly significant at the .01 level, that is, it can be extended to the underlying normal population.
ACKNOWLEDGEMENT
We wish to thank the Punjab Technical University, Kapurthala for stretching out incredible backing to us. Also, we extend our heartiest thanks to many others who helped us to attain our targets.
REFERENCES
[1] Frakes, W.B., & Terry, C. (1996). Software reuse: metrics and models. ACM Computing Surveys, 28(2), 415-435.
[2] Andreou, A. S., & Tziakouris, M. (2007). A quality framework for developing and evaluating original software components, Information and Software Technology, 49 (2), 122-141.
[3] Caldiera, G., & Basili, V.R. (1991). Identifying and qualifying reusable software components. IEEE Computer, 24(2), 61-70.
[4] Challa, J.S., Paul, A., Dada, Y., Nerella, V., Srivastava, P.R., & Singh, A.P. (2011). Integrated software quality evaluation: a fuzzy multi-criteria approach. Journal of Information Processing Systems, 7 (3), 473-518. DOI: 10.3745/JIPS.2011.7.3.473
[5] Khosravi, K., & Gueheneuc, Y. (2005). On issues with software quality models. Proceedings of 9th ECOOP workshop on quantitative approaches in OO software
engineering, Glasgow Scotland, 70-83. DOI: 10.1.1.92.7553
[6] Sharma, A., Kumar, R., & Grover, P.S. (2008). Estimation of quality for software components-an empirical approach. ACM SIGSOFT Software Engineering Notes, 33(6), 1-10.
[7] Ortega, Maryoly; Perez, Maria; and Rojas, Teresita. Construction of a systemic quality model for evaluating a software product. Software quality journal, 11(3), 2003, 219-242.
[8] Upadhyay, N., Despande, B., & Agrawal, V. (2011). Towards a Software Component Quality Model. Proceedings of 1st International Conference on Computer Science and Information Technology (CCSIT’11), Bangalore, India, Springer Verlag 131 (3), 398-412. DOI: 10.1007/978-3-642-17857-3_40
[9] Bertoa, M., & Vallecillo, A. (2002). Quality Attributes for COTS Components. Proceedings of 6th ECOOP Workshop on Quantitative Approaches in Object-Oriented Software Engineering (QAOOSE), Spain. DOI: 10.1.1.16.7555
[10] Alvaro, A., Almeida, E., & Meira, S. (2010). A software component quality framework. ACM SIGSOFT Software Engineering Notes, 35(1), 1.
[11] Washizaki, H., Yamamoto, H. & Fukazawa, Y. (2003). A metrics suite for measuring reusability of software components. Proceedings of the 9th International Symposium on Software Metrics (METRICS '03). Washington DC: IEEE Computer Society, 211-223. DOI: 10.1.1.114.4655
[12] Devanbu, P., Karstu, S., Melo, W., Thomas, W. (1996). Analytical and empirical evaluation of software reuse metrics. IEEE proceedings of ICSE-18, 189-199 [13] Succi, G., Benedicenti, L., & Vernazza, T. (2001). Analysis of the effects of software reuse on customer satisfaction in an RPG environment. IEEE Transactions on Software Engineering, 27(5), 473-479.
[14] Pressman, Roger S., “Software Engineering: A practitioner’s approach”, McGraw-Hill, 5th ed., ISBN 0-07-365578-3