Patient Experience Journal
Volume 5 | Issue 1
Article 13
2018
Exploring workforce confidence and patient
experiences: A quantitative analysis
Katie M. Owens
formerly of HealthStream, [email protected]
Stephanie Keller
HealthStream, [email protected]
Follow this and additional works at:
https://pxjournal.org/journal
Part of the
Health and Medical Administration Commons
,
Health Policy Commons
,
Health
Services Administration Commons
, and the
Health Services Research Commons
This Research is brought to you for free and open access by Patient Experience Journal. It has been accepted for inclusion in Patient Experience Journal by an authorized editor of Patient Experience Journal.
Recommended Citation
Owens, Katie M. and Keller, Stephanie (2018) "Exploring workforce confidence and patient experiences: A quantitative analysis,"
Research
Exploring workforce confidence and patient experiences: A quantitative
analysis
Katie M. Owens,
formerly of Healthstream, [email protected]
Stephanie Keller,
Healthstream, [email protected],
Abstract
Confidence is recognized as one of the most influential factors to affect performance. Individual, leader, and team confidence play essential roles in achieving success and the absence of confidence has been connected with failure. While confidence is not a substitute for competency, it creates trusting relationships, empowerment, and resiliency to persevere when challenges arise. Objective: In this study, we examined workforce confidence in the patient experience and patient perceptions of their experience of care. Methods: We compared responses to the Patient-Centered Excellence Survey (PCES) from 41 United States hospitals, measuring workforce confidence in the patient experience provided, to patient’s ratings of their experience through the Hospital Consumer Assessment of Healthcare Providers
and Systems (HCAHPS) survey. Results: Higher workforce confidence in the patient experience provided is related to higher patient ratings of their experience while lower workforce confidence is linked with lower patient ratings. Hospitals in the top 25% with workforce perceptions score 11.7% higher with HCAHPS Overall Rating than hospitals in the bottom 25%. Of the 10,945 workforce respondents to the PCES Overall Rating item, 24.2% rated their organization top box (9 or 10) versus 64.7% of patients rating top box. Senior leaders reported the highest degree of confidence in the patient experience, while staff and providers reported the lowest. Conclusion: Confidence is an important characteristic of the healthcare workforce. Building mastery of patient experience competencies holds promise to further elevate
patient’s perceptions of their care. Gaps in confidence should be addressed - especially among those with the most direct caregiver responsibilities.
Keywords
Confidence, patient experience, perceptions, HCAHPS, patient-centered care, performance, competency, leadership, team-based care
Introduction
When you are confident you get more dates, do better at work and perform better at sports.1,2,3 Literature
demonstrates the importance of confidence on impacting success. Additionally, the connection of confidence to competence is noted by psychologists in medical and non-medical publications: confidence can affect performance when the efficacy expectation is strong and our abilities are well developed.4,5,6,7 However, we could not identify research assessing the role confidence plays in the patient experience. Does caregiver confidence influence patients to perceive a better patient experience?
Improving the patient experience is one of the top priorities for healthcare executives.8 Presently, only 71% of patients can report receiving care at the “best possible hospital” according to Centers for Medicare and Medicaid
Services (CMS) Hospital Compare.9 Our study explores the confidence literature as well as original research to assess the impact of workforce confidence in the patient
experience provided on patient perceptions of the experience received.
Background/Literature Review
Confidence
While confidence is frequently connected to and cited as a predictor of behaviors and outcomes, its definition and conceptualization are malleable and not universally consistent.10 Confidence is closely associated (but not synonymous) with constructs such as presence, self-efficacy, expectancy, self-esteem, and trust.11 Additionally the cultivation and presence of confidence lends others to perceive a person as more competent.12,13 As Amy Cuddy describes in her research, “presence is not about
pretending to be competent; it is about believing in and
revealing the abilities one truly possesses”.14 Yet, confidence is not a substitute for competence and should not be confused with arrogance.5,15,16
Exploring workforce confidence and patient experiences: a quantitative analysis, Owens and Keller
98 Patient Experience Journal, Volume 5, Issue 1 – 2018
represent a sense of control to influence an
outcome.5,7,15,17,18,19 Confidence also equips individuals to withstand obstacles and problems that may arise in pursuit of an objective.20
Organizational Confidence
Models such as the integrative model of sport confidence and collective efficacy (team confidence) predict team performance based on two components: organizational culture and individual confidence. First, organizational culture can influence confidence based on the competitive standard, environment of motivation, individual
identification with the team, and the goals and expectations for performance.4,6 Second, individual confidence is supported by competence, personality characteristics, attitudes, sense of personal control, and values that manifest confidence.4,5,18
The Role of Leadership
Confidence by leadership has been shown to enhance team member confidence and performance. When a leader is confident and builds team confidence, team members believe their collective team to be successful and capable of winning and there is a positive impact on performance outcomes.21 Additionally, management literature indicates that the most effective leaders are confident and
empowered. Empowered leaders leverage strategies to motivate, build confidence and create organizational commitment among their staff leading to achievement of desired performance objectives.19
Confidence in Athletic Performance
Individual and team confidence is viewed as essential to achievements in sports.4 Research has consistently demonstrated that confidence (while not a replacement for skill) has a positive impact on performance.5 Not only do athletes perform successfully when they experience high degrees of confidence, but they perform unsuccessfully when they experience low confidence.4 Collective confidence (team and coach) plays a significant role in team success in discrete competitions and longitudinally over the duration of a season.6 Confidence provides insulation to protect performance when faced with obstacles and challenges.6,20 Additionally, confidence has been found to allow athletes to maintain focus and make critical decisions under pressure.5
Confidence in Patient Care
Research has demonstrated mixed conclusions with regard to the relationship between confidence and performance in the clinical setting.22 One cannot assume that
confidence equates to competency or replaces the need for progressive mastery of skills that demonstrate clinical proficiency.15 Research has called for recognizing the connection between building confidence to improve competence through blended learning techniques.23 Several studies have utilized confidence questionnaires to
report perceived confidence and then compare
competency evaluations; however few compare confidence to actual achievement of clinical or experiential
performance outcomes.24,25
Patient Experience
The Beryl Institute defines the Patient Experience as the sum of all interactions, shaped by an organization’s
culture, that influence patient perceptions across the continuum of care.26 The Consumer Assessment of Healthcare Providers and Systems Survey (CAHPS) serves
as the nationwide standard by measuring patients’
perceptions of the quality of the experience provided for American Hospitals and Health Systems. In particular, the Hospital Consumer Assessment of Healthcare Providers and Systems (HCAHPS) was implemented nationally in 2006 by Centers for Medicare and Medicaid Services (CMS) to increase hospital accountability and incentives for quality improvement in the hospital environment.27 CMS publicly reports performance on HCAHPS across six domains (Nurse Communication, Doctor Communication, Responsiveness, Pain Control, Medication
Communication, and Care Transitions) and four individual items (Cleanliness, Quiet at Night, Overall Rating, and Would Recommend).28 The patient experience has been identified as one of the top three priorities for healthcare leaders.29
Patient Experience and Confidence
To our knowledge, there is a void in evaluating the impact of workforce confidence on the patient experience. Given the body of literature on the importance of confidence in many areas of life and the recognized priority of improving the patient experience, our goal was to explore
connections between the two.
Method
Our research explored the relationships between
workforce confidence and patients’ perceptions of their
experience.
As a measure of workforce confidence, we leveraged
responses to HealthStream’s Patient-Centered Excellence Survey (PCES), an instrument administered to healthcare leaders, staff, and providers. We asked respondents to rate their confidence in the patient experience provided. Then, we mapped organizational level perceptions to patient responses to the HCAHPS survey. Using this data, we examined variations in confidence in the patient
experience as rated by healthcare workforce members and compared this with patient survey data.
survey. The average hospital size was 183 beds and 40 of the hospitals were privately owned community hospitals (note: one hospital in the study was government owned).
Hospital Consumer Assessment of Healthcare Providers and Systems Survey
We focused primarily on the results for the Overall Hospital Rating measure: Using any number from 0 to 10, where 0 is the worst hospital possible and 10 is the best hospital possible, what number would you use to rate this hospital during your stay? To ensure accurate comparisons and timeliness between the periods in which the patients and healthcare workers at respective organizations evaluated perceptions of the patient experience, we examined HCAHPS scores for patients discharged during a period of nine to twelve months before, during, or after the PCES was fielded. This time period provided an ample sample of patients for each hospital to ensure confidence in the results while also ensuring comparability between the state of the organization for patient and workforce perceptions.
Our team obtained feedback from hospitals and health systems using an instrument called the Patient-Centered Excellence Survey (PCES). Through the PCES, our team
collected feedback from leaders, staff, and providers about their perceptions of the presence and behavioral
consistency of best practices used to improve patient, employee, and provider experiences. In 2015, in an effort to assess variations in perceptions between the healthcare workforce and patients, our team added a question aligned with the HCAHPS survey to measure leader, staff, and provider perceptions of the quality of the patient experience provided. In 2016 we asked the workforce of 41 hospitals and health systems to answer: Using any number from 0 to 10, where 0 is the worst possible and 10 is the best possible, what number would you use to rate the patient experience at your organization? The ratings on this item allowed us to assess the level of confidence healthcare workers have on the patient experience provided by their hospital or health system.
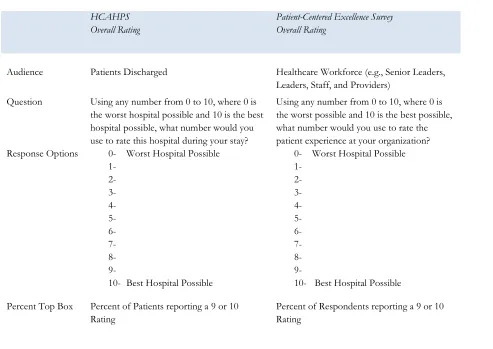
HCAHPS scores for the Overall Hospital Rating question are traditionally reported by combining the number of 9 and 10 responses and dividing by the total number of respondents to create a percent top box score. As such, we used the same methodology for calculating and comparing top box percentages for both surveys. Table 1 depicts the
Table 1. Summary of methodology to compare confidence between workforce and patient perceptions
HCAHPS Overall Rating
Patient-Centered Excellence Survey Overall Rating
Audience Patients Discharged Healthcare Workforce (e.g., Senior Leaders, Leaders, Staff, and Providers)
Question Using any number from 0 to 10, where 0 is the worst hospital possible and 10 is the best hospital possible, what number would you use to rate this hospital during your stay?
Using any number from 0 to 10, where 0 is the worst possible and 10 is the best possible, what number would you use to rate the patient experience at your organization? Response Options 0- Worst Hospital Possible
1- 2- 3- 4- 5- 6- 7- 8- 9-
10- Best Hospital Possible
0- Worst Hospital Possible 1-
2- 3- 4- 5- 6- 7- 8- 9-
10- Best Hospital Possible
Percent Top Box Percent of Patients reporting a 9 or 10 Rating
Exploring workforce confidence and patient experiences: a quantitative analysis, Owens and Keller
100 Patient Experience Journal, Volume 5, Issue 1 – 2018
means by which we compared workforce confidence to patient experience feedback.
Findings
Workforce Confidence with Patient Experience
Of the 10,945 respondents to the PCES, 24.2% rate their organization top box (9 or 10 for Best Possible Hospital). Senior leaders report the highest degree of confidence in the patient experience provided at 28.8% top box, while staff report the lowest degree of confidence at 23.5% top box and the highest percentage of perceptions of being the Worst Possible Hospital (0 to 6) at 31.9% (see Table 2).
Workforce Confidence Observations by Demographic Categories
While Staff and Physicians tend to have lower confidence in the patient experience provided, our team found other trends in demographic confidence worth noting. Ancillary/Support Services (e.g., therapy, social work, diagnostics, lab) have the lowest perceptions across
departments and Non-Clinical (e.g., housekeeping, laundry, facilities) have the highest perceptions. Newest team members (e.g., individuals tenured with the organization for less than one year) have the highest perceptions followed by those with the longest tenure (greater than 15 years). Perceptions of the patient experience provided increase with an increased intent to stay with the organization. While we cannot establish causation in this study, there appears to be a relationship between confidence in the patient experience provided and
an employee’s intent to stay with the organization. In other
words, organizations whose employees feel they provide a better patient experience may be more likely to retain employees. Table 3 contains the percent top box results across demographic areas studied.
Patient Perceptions of the Patient Experience
Across the 41 hospitals included in this study, 67.4% of patients surveyed rate their hospital a 9 or 10 (where 10 is the Best Hospital Possible). See Table 4 for the percent distribution for HCAHPS Overall Rating by patients.
Table 2: Patient-centered excellence survey: Percent distribution of overall rating by position (for 41 hospitals)
Position
Number of Responses
Worst Hospital Possible Respondents who gave their hospital a rating of 6
or lower
Respondents who gave their hospital a rating of 7 or 8
Best Possible Hospital Respondents who gave their hospital a rating of 9
or 10
Staff 9,149 31.9% 44.7% 23.5%
Leader 1,407 23.7% 48.3% 27.9%
Senior Leader 73 20.5% 50.7% 28.8%
Physician 303 26.4% 46.9% 26.7%
Unidentified 13 38.5% 30.8% 30.8%
Grand Total 10,945 30.6% 45.2% 24.2%
Table 3: Workforce percent Top Box (% 9-10) responses to overall rating for best possible hospital by key respondent demographic (for 41 hospitals)
Role Department Tenure Intent to Stay
% 9-10
Staff 23.5% Leader 27.9% Senior Leader 28.8% Physician 26.7% Unidentified 30.8%
Total 24.2%
% 9-10
Non-Clinical 28.3% Ancillary/Support 20.9% Business/Ops 22.4% Direct Patient Care 24.0%
Other 23.7%
Total 24.2%
% 9-10
<1 Yr 31.4% 1 - <3 Yrs 22.3% 3 - <5 Yrs 21.3% 5 - <10 Yrs 22.3% 10 - <15 Yrs 23.3% >15 Yrs 24.5%
Total 24.2%
% 9-10
<1 Yr 14.1% 1 - <3 Yrs 14.0% 3 - <5 Yrs 19.0% 5 - <10 Yrs 22.6% 10 - <15 Yrs 24.2% >15 Yrs 33.2%
Workforce and Patient Perceptions of the Patient Experience
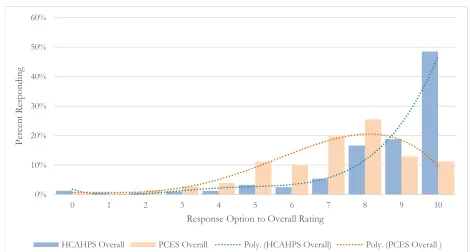
Patients have a higher perception of the patient experience than the workforce by a difference of 43.2%. While workforce perceptions of Overall Rating average 24.2% top box, patients report a percent top box of 67.4%. Figure 1 demonstrates the variation in workforce and patient perceptions of the patient experience across the 10-point scale measuring Overall Rating. To help demonstrate the difference in distributions, we have added a fourth order polynomial (poly) trend line.
For the majority of organizations, there is a 30% to 50% gap between workforce perceptions and patient
perceptions; for instance, a hospital whose workforce responds with 16% top box receives a patient rating of 54% top box. Figure 2 illustrates the distribution of
variance observed between workforce and patient perceptions of Overall Rating of the patient experience.
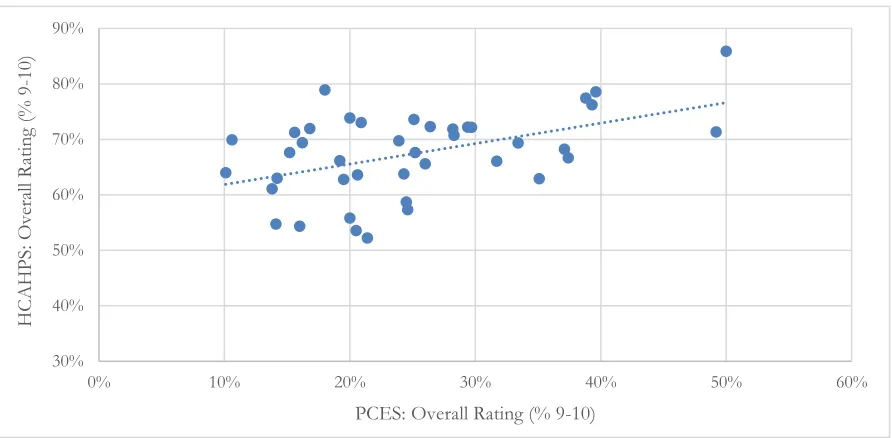
We found a linear relationship emerges when plotting workforce versus patient perceptions of the patient experience (Figure 3). Organizations with a higher degree of confidence in their perceptions of the patient
experience have higher patient perceptions for Overall Rating on the HCAHPS survey.
To further investigate the impact of workforce confidence on the patient experience, we established quartiles among the hospitals based on employee perceptions of the patient experience and evaluated the variation between the top and bottom 25 percent (or top and bottom quartiles, respectively). Additionally, hospitals in the top quartile (or top 25%) with employee perceptions scored 11.7% higher with HCAHPS Overall Rating than hospitals in the
Table 4: Percent distribution of HCAPHS responses for overall rating (for 41 hospitals)
Number of Hospitals
Worst Hospital Possible Patients who gave their hospital a rating of 6 or
lower
Patients who gave their hospital a rating of 7 or 8
Best Possible Hospital Patients who gave their hospital a rating of 9 or 10
Patient Responses 41 10.7% 22.1% 67.4%
Figure 1: Percent distribution of scores for workforce and patient perceptions of the patient experience (for 41 hospitals)
0% 10% 20% 30% 40% 50% 60%
0 1 2 3 4 5 6 7 8 9 10
P
er
ce
nt
Re
sp
on
din
g
Response Option to Overall Rating
Exploring workforce confidence and patient experiences: a quantitative analysis, Owens and Keller
102 Patient Experience Journal, Volume 5, Issue 1 – 2018
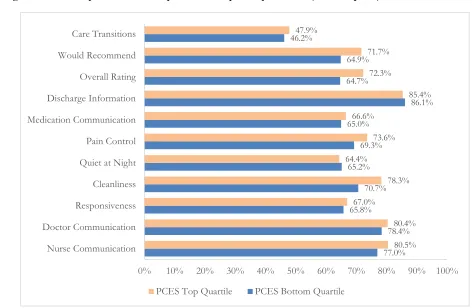
bottom quartile (or bottom 25%) a difference which can equate to a 32 percentile point difference in HCAHPS National Ranking. Furthermore, the top quartile, or top 25% of hospitals with the highest degree of employee confidence in the patient experience, outperformed those in the bottom quartile on every HCAHPS measure except Discharge Information and Quiet at Night (see Figure 4). The top quartile hospitals outperformed the bottom quartile most notably in the following HCAHPS measures:
Overall Rating, Cleanliness, Would Recommend, Pain Control, and Nurse Communication.
Limitations
As an industry, we are early in our understanding how confidence influences healthcare and, in particular, the patient experience. This study analyzed the variation in perceptions between workforce confidence for the patient experience provided and subsequent patient perceptions of
Figure 2: Difference in workforce perceptions and patient perceptions of the patient experience (for 41 hospitals)
0
3
15
14
8
1
10% 20% 30% 40% 50% 60% 70%
0 2 4 6 8 10 12 14 16 18
Difference in Patient and Workforce Top Box Perceptions
F
re
qu
en
cy
o
f
Ho
sp
itals
Figure 3. Relationship between workforce perceptions and patient perceptions of the patient experience (for 41 hospitals)
30% 40% 50% 60% 70% 80% 90%
0% 10% 20% 30% 40% 50% 60%
HCAHPS
: Ov
er
all R
atin
g
(%
9
-10)
the quality of their experience. The average hospital size included in our study was 183 beds and the majority were privately owned community hospitals; thus, we did not measure confidence across a nationally representative set of hospitals. Therefore, extrapolation to the entire population of hospitals and health systems across the United States should be approached with caution. Additionally, our analysis does not afford the opportunity to look precisely at variations in workforce confidence and patient perceptions by departments or service lines (e.g., Oncology, Neurology, Medical/Surgical Units).
The current findings validate our interest for continuing to pursue the impact of confidence on the patient experience. Longitudinal studies across broader samples of health systems will allow us to further deepen our understanding of confidence and the patient experience. As we gather workforce perceptions from additional organizations, further research may be conducted to test for statistically significant differences between hospitals performing in the top and bottom quartiles. Additional research should pursue traits and competencies that create a sense of confidence and trust between caregivers and patients.
Discussion
Our study revealed that organizations with higher confidence (as indicated by the perceptions of overall patient experience performance) performed higher than organizations with lower confidence. In every
organization, the workforce rated the experience lower than patients; however, hospitals with higher degrees of confidence in the patient experience had better performance outcomes for the patient experience (HCAHPS). Hospitals in the top quartile for confidence outperformed the bottom quartile by 11.7% with HCAHPS Overall Rating, equating to about a 32 percentile point difference. Additionally, organizations whose employees feel they provide a better patient experience may be more likely to retain employees. Gaps exist in perceptions of confidence where Senior Leaders (those most distant from the bedside) have the highest perception and staff and providers (those closest to the bedside) expressed the lowest confidence in the patient experience provided. Based on the confidence literature, elevating confidence among those caregivers are most likely to elevate patient perceptions of their experience.
Figure 4: HCAHPS performance for top and bottom quartile performers (for 41 hospitals)
77.0% 78.4% 65.8%
70.7% 65.2%
69.3% 65.0%
86.1% 64.7%
64.9% 46.2%
80.5% 80.4% 67.0%
78.3% 64.4%
73.6% 66.6%
85.4% 72.3%
71.7% 47.9%
0% 10% 20% 30% 40% 50% 60% 70% 80% 90% 100%
Nurse Communication Doctor Communication Responsiveness Cleanliness Quiet at Night Pain Control Medication Communication Discharge Information Overall Rating Would Recommend Care Transitions
Exploring workforce confidence and patient experiences: a quantitative analysis, Owens and Keller
104 Patient Experience Journal, Volume 5, Issue 1 – 2018
Furthermore, we know the role of leadership confidence has been demonstrated to be a critical component of team confidence and efficacy. In our study middle managers had higher confidence than front line team members. Growing leader confidence and developing those leaders to leverage empowerment behaviors, confidence building, and development of patient centered competencies among their direct reports may yield substantial organizational
improvements in patients’ perceptions of the care
provided. Team confidence is driven by organizational culture as well as the confidence and competence of individuals making up the team.4,6 Thus, it is important to explore team-based dynamics and implement strategies that allow caregivers to work best together to feel confident in their interprofessional actions to improve the patient experience.
Practical Implications
While our findings suggest that confidence matters to improve the patient experience, there are three main implications. First, how can we become most aware of the attributes that make us confident in the eyes of patients and their loved ones? First impressions are still a primitive mechanism. When we meet an individual, our mind wants to answer two questions: Can I trust and can I respect this person?30 As leaders, staff, and caregivers, managing our first impression personally can make a difference in how we reassure patients they are in good hands. Additionally, it is important to manage perceptions throughout the entire duration of a patient experience to instill trust, respect, and confidence. Managing up team members can create warm introductions and reinforce confidence through team-based care.
Second, how can we learn from the confidence literature to build a more confident workforce? When people believe they can cope with a challenging task, they are more resilient and become less anxious in the moment. Those who do not feel confident in difficult situations experience more stress and anxiety.13 It is important to be honest and aware of confidence levels individually and as a team over the duration of patient encounters.6
Third, how can we cultivate competencies to improve the confidence of the workforce? Since confidence cannot replace competence, we need to create experiences that support workforce development and mastery of key competencies that yield patients perceiving the best possible care.7 There are four sources recognized as creating efficacy and confidence that we can cultivate to develop patient experience competencies: personal accomplishments, vicarious experience, verbal persuasion of encouragement, and psychological states of positive expectancy.5,6,7
In conclusion, our team was in a position to establish a connection between workforce confidence and positive perceptions by patients of their experience. For healthcare leaders to be successful in the present and future it is not a matter of hope to deliver a better experience but
cultivating competencies and building demonstrable confidence in the quality of the patient experience provided.
References
1. Covassin, T, Pero, S. The Relationship Between Self-Confidence, Mood State, and Anxiety Among Collegiate Tennis Players. Journal of Sport Behavior.
2004; 27 (3): 230-242.
2. Ravenscraft, E. Why Confidence Is So Important (and How to Improve Yours). Life Hacker Web site.
http://lifewhacker.com/how-to-build-your-confidence-and-why-it-matters-1442414831. Accessed January 11, 2017
3. Belcher, LM. The Impact of Confidence on Work Performance. Houston Chronicle. No Date.
http://smallbusiness.chron.com/impact-confidence-work-performance-24235. Accessed January 21, 2017.
4. Hays, K, Thomas, O, Maynard, I, Bawden, M. The role of confidence in world-class sport performance.
Journal of Sports Sciences. 2009; 27 (11): 1185-1199. 5. Feltz, DL. Self-Confidence and Sports Performance.
In Smith D and Bar-Eli, M eds. Essential readings in sport and exercise psychology. Champaign, IL: Human Kinetics.; 2007: 278-294.
6. Skinner, BR. The Relationship Between Confidence and Performance Throughout a Competitive Season.
All Graduate Plan B and other Reports. 2013; Paper 285. 7. Bandura, A. Self-efficacy: Toward a unifying theory
of behavior change. Psychology Review. 1977; 84 (2): 191-251.
8. Bees, J. Intel Report: Patient Experience. Health Leaders Media. August 12, 2016.
http://www.healthleadersmedial.com/quality/intel-report-patient-experience. Accessed January 27, 2017.
9. Medicare.gov. Centers for Medicare and Medicaid Services. Compare Hospitals. Available from https://www.medicare.gov/hospitalcompare/profile .html#profTab=1&ID=100266&cmprID=100266& dist=100&loc=32563&lat=30.3958679&lng=-87.0074423&cmprDist=11.6&Distn=11.6. Accessed January 10, 2017.
10. Oney, E, Oksuzoglu-gven, G. Confidence: A Critical Review of the Literature and an Alternative
Perspective for General and Specific
11. Gist, M, Mitchell, T. Self-Efficacy: A Theoretical Analysis of its Determinants and Malleability.
Academy of Management Review. 1992; 17(2): 183-211. 12. Kay, K, Shipman, C. The Confidence Gap. The
Atlantic. May 2014.
http://www.theatlantic.com/magazine/archive/201 4/05/the-confidence-gap/359815/ Accessed January 11, 2017.
13. Bandura, A, Organisational Applications of Social Cognitive Theory. Australian Journal of Management. 1988; 13 (2): 275-302.
14. Cuddy, A. Presence. Bringing your BOLDEST SELF to
your BIGGEST CHALLENGES. New York: Little,
Brown and Company; 2015.
15. Castle, N, Garton, H, Kenward, G. Confidence vs Competence: basic life support skills of health professionals. British Journal of Nursing. 2007; 16 (11): 664-666.
16. Confidence and Arrogance: A Fine Line. PennState University Leadership Web site.
http://sites.psu.edu/leadership/2015/06/24/confid ence-and-arrogance-a-fine-line/#comments. Accessed January 25, 2017
17. Weisinger, H. The Essence of Confidence: How did a confident person get confident? You can do the same. Psychology Today. September 1, 2015. https://www.psychologytoday.com/blog/thicken-your-skin/201509/the-essence-confidence. Accessed January 11, 2017.
18. Amasiatu, AN. Exploring the role of confidence to enhancing sports performance. Educational Research International. 2013; 1 (3): 69-77.
19. Havei, F, Dahinten, VS, MacPhee, M. Psychological Competence: The Key to Leader Empowering Behaviors. JONA. 2014; 44 (5) 276-283. 20. Bandura, A. Self Efficacy: The Exercise of Control.
Freeman: New York; 1997.
21. Fransen, K, Steffens, NK, Hasiam, SA,
Vanbeselaere, N, Vande Broek, G, Boen, F. We will
be champions: Leaders’ confidence in ‘us’ inspires team members’ team confidence and performance. Scandinavian Journal of Medicine & Science in Sports. 2016: 26 (12): 1455-1469.
22. Agard, A, Maindal, H. Interacting with relatives in
intensive care unit. Nurses’ perceptions of a
challenging task. Nursing in Critical Care. 2009; 14 (5): 264-272.
23. Yang, YO, Kim, M, Park, KY, Yahg, JH. Factors influencing the confidence in core clinical skills among hospital nurses. International Journal of Nursing Practice. 2014; 21: 831-838.
24. McClimens, A, et al. Confidence and performance in objective structured clinical examination. British Journal of Midwifery. 2012; 20 (10): 746-751.
25. Sergeev, CI, et al. Training Modalities and Self-Confidence Building in Performance of Life-Saving Procedures. Military Medicine. 2012. 177 (8): 901-906. 26. Beryl Institute. Defining Patient Experience.
http://www.theberylinstitute.org/default.asp?page= DefiningPatientExp. Accessed January 7, 2017. 27. Owens, K. The HCAHPS Imperative for
Patient-Centered Excellence. Pensacola: Baptist Leadership Group; 2014.
28 Medicare.gov. Centers for Medicare and Medicaid Services. Compare Hospitals. Available from https://www.medicare.gov/hospitalcompare/profile .html#profTab=1&ID=100266&cmprID=100266& dist=100&loc=32563&lat=30.3958679&lng=-87.0074423&cmprDist=11.6&Distn=11.6. Accessed November 20, 2016.
29. Wolf, J. The State of Patient Experience: 2017 A Return to Purpose. Beryl Institute; 2017.
30. Fisk, ST, Cuddy, AJ, Glick, P. Universal dimensions of social cognition: warmth and competence.