Evaluation of the uncertainty of flash flood
prediction using the RRI model in mountainous
rivers
Yosuke Nakamura
1*, Koji Ikeuchi
2, Shiori Abe
3, Toshio Koike
1,
and Shinji Egashira
11 International Centre for Water Hazard and Risk Management (ICHARM), Public Works
Research Institute (PWRI), Tsukuba, Japan
2 Department of Civil Engineering, The University of Tokyo, 7-3-1, Tokyo, Japan 3 Mitsui Consultants Co., Ltd., 1-11-1, Osaki, Shinagawa-ku, Tokyo, Japan
y-nakamura44@pwri.go.jp
Abstract
In recent years, flood damage caused by flash floods in mountainous rivers has been frequently reported in Japan. In order to ensure a sufficient lead time for safe evacuation, it is necessary to predict river water levels in real time utilizing a hydrological model. In this study, we conducted flood prediction using the RRI model and rainfall forecasted for the next 6 hours in the Kagetsu River basin (136.1 km2) in July 2017, evaluated the uncertainty regarding the prediction, and illustrated the results using a box-plot. The evaluation found that the mean error of the forecasted water level was approximately -0.3 m in the prediction for the initial 3 hours and -0.97 m at the 6th hour. Also, the study investigated the possibility of correcting water levels forecasted by clarifying an uncertainty distribution. As a result, the water level forecasted was found to be underestimated because it was predicted to rise as high as Warning Level 2, while the water level forecasted with bias correction was predicted to reach Warning Level 4. Moreover, the lead time was estimated to prolong by 2 hours. Overall, the study suggested that flood forecasting can be improved by considering the uncertainty involved in prediction.
1
Introduction
In Japan, because of its steep terrain, river water levels rise sharply, and the lead time from rainfall to runoff is very short. Since flood discharge in a mountainous river can be more than 100 times as large
* Corresponding author, Tel.: +81-29-879-6779; Fax: +81-29-879-6709
Volume 3, 2018, Pages 1486–1494
as that in normal times, flash floods are one of the main causes for disasters. In recent years, flood damage caused by flash floods in mountainous rivers has been more frequently reported throughout the country. Therefore, it is necessary to predict river water levels in real time to ensure a sufficient lead time for safe evacuation. However, flash flood prediction contains uncertainties because it includes many processes such as radar observation, water level observation, rainfall forecasting, hydrological modeling, and telemetering. In this study, we developed a pseudo environment for real-time flash flood prediction using the Rainfall-Runoff-Inundation (RRI) model. The purpose of this study was to quantitatively evaluate the error of flood prediction and to clarify the effect of flash flood prediction considering uncertainty.
2
Study area and flood event
2.1
Target river basin
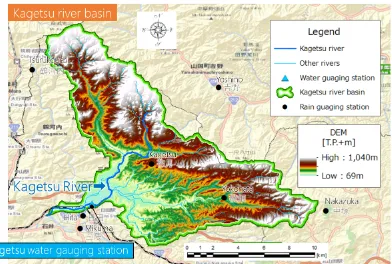
In this study, the target river basin was the Kagetsu River basin in the Kyushu region of Japan (Figure 1). The Kagetsu River basin is a right tributary of the Chikugo River; the catchment area is 136.1 km2, the flow length is 16.6 km, and the watershed is mostly covered with forests. It is a typical mountainous river in Japan. The Kagetsu River basin has a distinctive rainfall-runoff characteristic; it takes less than an hour from the peak of rainfall to the peak of water level. There is no dam with flood control function.
Figure 2: Elevation map of the Kagetsu River basin.
2.2
Target river basin
In the past several years, flooding caused by frontal precipitation occurred three times in this river on 3 July in 2012, 14 July in 2012, and 5 July in 2017. In the floods in 2012, part of the levee collapsed due to a sharp rise in water level, and serious flood damage resulted. Five years later in 2017, a flood recurred due to frontal precipitation and recorded the highest water level at the Kagetsu water gauging station. In this study, we targeted the July 2017 flood; this event caused by heavy rain due to a seasonal rain front. Warm moist air continued flowing in by a rain band, which resulted in the heavy rainfall for several hours in the same place. The peak rainfall of the average watershed precipitation was 53.5 mm/h, and the cumulative precipitation was 370 mm.
3
Methodology
3.1
Hydrological model
The RRI model [1,2] was used as the hydrological model in this study. The conceptual scheme of the RRI model is shown in Figure 4. This model is a two-dimensional model capable of simulating the rainfall-runoff process and the flood inundation process simultaneously at a river-basin scale. The model deals with slopes and river channels separately; the flow on the slope grid cells is calculated with a 2D diffusive wave approximation, while the channel flow is calculated with a 1D diffusive wave approximation. For better representations of the rainfall-runoff-inundation processes, the RRI model simulates also lateral subsurface flow, vertical infiltration flow, and surface flow. The lateral subsurface flow, which is typically important in mountainous regions, takes into account both saturated and unsaturated subsurface flows. On the other hand, the vertical infiltration flow is estimated using the Green-Ampt model. The flow interaction between river channel cells and slope cells is estimated based on different overflowing formulae, depending on water-level and levee-height conditions. The RRI model was developed by ICHARM of the Public Works Research Institute and can be downloaded from ICHARM’s website [3].
Figure 4: Conceptual scheme of the RRI model.
3.2
Rainfall data
In Japan, there are several types of rainfall radars at the present time that can be obtained in real time (see the top three in Table 1); rainfall observed using C-band Radar, rainfall analysed based on precipitation observed on the ground, and rainfall observed using X-band Radar. In this study, as a result of quantitative accuracy verification, Analysis Rainfall was used [4].
Type Rainfall products resolution Spatial interval Time Delay time Predict time
Observation C-band Radar 250m × 250m 5 minutes 1 minute - Observation Analysis Rainfall 1km × 1km minutes 30 13 minutes - Observation X-band Radar 250m × 250m 1 minute 1 minute -
Prediction Nowcast Rainfall 250m × 250m 5 minutes 2 minutes 1 hour Prediction Forecast Rainfall 1km × 1km 30
minutes 18 minutes 6 hours
Table 1: Rainfall products (present/forecast) and its characteristics.
Figure 5: Distribution by Forecasted Rainfall around the Kagetsu River basin at 16 o’clock, July 5th 2017.
3.3
Real-time flood prediction
Real-time simulation predicted water levels every 30 minutes for the next 6 hours. The conditions of the river basin (e.g., soil moisture, river water level) were updated only with data from radar observation. A delay time of 18 minutes needed for analysis and data transfer was considered in calculation. Discharge calculated by the RRI model was converted to water level using the H-Q relational equation. The H-Q relational equation was created based on the data observed in 2012. Steps in flood forecasting simulation are shown below:
Step 1: Spin up: Carry out spin-up calculation utilizing the RRI model for about 5 days,
in order to obtain the initial conditions.
Step 2: Archive the initial conditions: Archive the initial conditions on the river basin,
such as water depth in slope and river channel cells, boundary discharge or
water depth.
Step 3: Prepare rainfall data: Format data as input rainfall data for the RRI model. If
there are missing data in the rainfall data, they should be interpolated from the
nearest data.
Step 4: Run the RRI model: Run the RRI model for calculation using rainfall observed
by radar for 30-minutes and using rainfall forecasted for the next 6 hours.
Step 5: Archive new conditions: Archive new conditions which were calculated using
observation rainfall in order to use them as the initial conditions in the next
step.
4
Results
4.1
Verification of rainfall: Analysis and Forecast Rainfall
First, after comparing various radar rainfall products with ground rainfall, we verified the accuracy of the optimum radar product and Forecast Rainfall. For the accuracy verification of Forecast Rainfall, cumulative rainfall at each time was plotted in Figure 6, and we evaluated Forecast Rainfall using a single regression equation in which the y-axis intercept is zero. As a result, the rainfall for the initial 3 hours was predicted highly accurately with regression coefficient α ranging from 0.9 to 1.1 and determination coefficient R2 at approximately 0.9. However, for the subsequent 3 hours, regression coefficient α and determination coefficient R2 become smaller as the lead time becomes longer. Therefore, longer the lead time, more likely the predicted rainfall is to be underestimated compared to radar-observed rainfall.
Figure 6: Correlation diagram of Analysis Rainfall and Forecast Rainfall, and its regression line.
4.2
Flood prediction using the RRI model
o’clock, but eventually falls to Warning Level 3 (water level to start evacuation). After that, forecasted water levels No. 12 to No. 20 are reproduced to be roughly comparable to the calculated water level.
Figure 7: Calculated water levels by the RRI model and forecasted water levels for the next 6 hours.
Figure 8: Analysis Rainfall and Forecast Rainfall at 12 o’clock, 5 July 2017 (Before the water level rises).
Figure 10: Analysis Rainfall and Forecast Rainfall at 20 o’clock, 5 July 2017 (when the water level peaks).
4.3
Evaluation on uncertainty of flood prediction
Figure 11-left is a box plot showing the uncertainty of the flood prediction in this event. Since the data assimilation to water level observed was not covered in this study, note that there was some error in water level even at the present time. The error is attributed to uncertainty rather than prediction originating in observed rainfall distribution, observed water level, conceptual of hydrological models, modeling processes, and the delay time of radar data. The error value is defined as the difference between the calculated value the observed value. When the difference is positive, the calculated water level is overestimated; when negative, underestimated. As a result of comparison between the calculated water level and the observed water level, at the present time, the minimum error of water level is estimated at -2.25 m, the maximum is +0.63 m, and the mean is -0.33 m. The evaluation also found that the mean error of the forecasted water level was approximately -0.3 m in the prediction for the first 3 hours, -0.53 m at the 4th hour, -0.75 m at the 5th hour, and approximately -0.97 m at the 6th hour. The range of error increases as the prediction is conducted further ahead in the future; when the water level is predicted 6 hours ahead from the present time, the minimum is -4.38 m, the maximum is +0.63 m, the median is -0.45 m, and the mean is -0.97 m.
4.4
Flood prediction considering uncertainty
Since this event was heavy rain caused by cumulonimbus clouds, it was difficult to predict rainfall using the Moving Vector Analysis. Despite such difficulty, river administrators must issue flood warnings, and the underestimation of water levels may cause a fatal situation. If an uncertainty distribution is available, it is possible for them to provide relevant organizations with forecasted water levels with a range of uncertainty. Therefore, error at each prediction time is taken as a bias, and water levels forecasted by the RRI model can be corrected. However, since correction depending on extreme error derived from the minimum and the maximum may compromise the reliability of flood prediction, we decided to make bias correction when the prediction error is within the range between the 25% value and the 75% value, considering the error to be statistically significant. Figure 11-right shows the forecasted water level (at 13:30) as an example. The water level forecasted by the RRI model is predicted to reach Warning Level 2 (water level calling for attention to flooding), and thereafter goes down below Warning Level 1. However, considering the uncertainty range, the water level corrected using the 25% value reaches Warning Level 4.
4.5
Lead time for evacuation
uncertainty (the 25%-value line) predicted at 13:30 that the water level may reach Warning Level 4; the lead time is estimated to be 3 hours 10 minutes.
Figure 11: Evaluation of the uncertainty of flash flood prediction in an event and the bias correction of the forecasted water level (at 13:30).
5
Conclusion
In this study on the frontal heavy rain in July 2017, simulation was conducted for flash flood prediction using the RRI model for the next 6 hours, and predictive uncertainty was also evaluated. Although the RRI model was confirmed to have high reproducibility for this flood event, in real-time simulation, there was error in water levels calculated even for the present time. We also found that the error width increased as the prediction time became longer. In addition, the forecasted water level was corrected using the uncertainty found in this study. The results suggest that the accuracy of flash flood forecasting can be improved by considering uncertainty involved in prediction. Moreover, the lead time for safe evacuation can increase by 2 hours with bias correction compared with the lead time estimated from flood prediction without bias correction.
Reference
[1] Sayama, T., Ozawa, G., Kawakami, T., Nabesaka, S., and Fukami, K.: Rainfall-runoff-inundation analysis of the 2010 Pakistan flood in the Kabul River basin, Hydrological Sciences Journal – Journal des Sciences Hydrologiques, 57(2), 298–312, 2012.
[2] Sayama, T., Tatebe, Y., and Tanaka, S.: Hydrologic sensitivity of flood runoff and inundation:2011 Thailand floods in the Chao Phraya River basin, Nat. Hazards Earth Syst. Sci., 15, 1617–1630, 2015. [3] RRI Model download website:
http://www.icharm.pwri.go.jp/research/rri/rri_top.html, International Centre for Water Hazard and Risk Management (ICHARM), Public Works Research Institute (PWRI).